AIS Electronic Library (AISeL)
PACIS 2018 Proceedings
Pacific Asia Conference on Information Systems
(PACIS)
6-26-2018
Energy Consumption of Office Building Based on
Multi–Agent Modeling and Simulation
Yang Shen
Nanjing University of Aeronautics and Astronautics, [email protected]
Yingchuan Wang
Nanjing University of Aeronautics and Astronautics, [email protected]
Yongchen Guo
Nanjing University of Aeronautics and Astronautics, [email protected]
Follow this and additional works at:
https://aisel.aisnet.org/pacis2018
This material is brought to you by the Pacific Asia Conference on Information Systems (PACIS) at AIS Electronic Library (AISeL). It has been accepted for inclusion in PACIS 2018 Proceedings by an authorized administrator of AIS Electronic Library (AISeL). For more information, please [email protected].
Recommended Citation
Shen, Yang; Wang, Yingchuan; and Guo, Yongchen, "Energy Consumption of Office Building Based on Multi–Agent Modeling and Simulation" (2018).PACIS 2018 Proceedings. 30.
Research on Multi-agent Simulation Model of
Energy Consumption in Office Buildings
*
Type: Completed Research Paper
Yang Shen
Economics and Management College of
Nanjing University of Aeronautics and
Astronautics
Jiangsu Nanjing China
Yingchuan Wang
Economics and Management College of
Nanjing University of Aeronautics and
Astronautics
Jiangsu Nanjing China
Yongchen Guo
Economics and Management College of Nanjing University of Aeronautics and
Astronautics
Jiangsu Nanjing China
Abstract
Based on the reality of the office building, this paper establishes a micro and dynamic simulation model of energy consumption, which combines four factors: human factors, energy management policy, energy management technology and electrical equipment. More than that, this paper uses AnyLogic to simulate the energy consumption of an office building at the university. After validating the validity of this model, this paper designs different simulation experiments to find out the influence of energy saving consciousness and energy management strategy on energy consumption, which provides valuable suggestions for the actual energy problems of the office building.
Keywords:Office building energy consumption, Multi-agents modeling, Energy management strategy
Introduction
Energy-saving emission reduction is being extended from industrial life to all aspects of social life, building energy consumption showed a sudden upward trend. The available information shows that most domestic office buildings are in the low-function, low quality of service level, high-energy operation (Liu, R. 2013). Many scholars have studied the energy consumption rating methods of office buildings (Li, Y. et al. 2016; Chen, Y et al. 2017), the influencing factors of energy consumption scale(Refahi, A. H. et al. 2015; Zhang, S.P. et al. 2012), and the forecast energy consumption trends(Wu, W et al. 2017; Amasyali, K. et al. 2018). At the same time, scholars are also increasingly aware that a large part of the energy consumption of buildings derives from users’ energy use. Some studies (Colmenar-Santos et al. 2013; Duarte, C. et al. 2013; Sanchez, M. et al. 2007; Webber, C et al. 2006) have confirmed the significant impact of human behavior on the efficient operation of buildings.
For instance, Studies conducted by Masoso and Grobler (2010) show that non-working hours (56%) use more energy than working hours (44%). This is mainly due to the user leaving lights and equipment at the end of the day, in part due to poor zoning and control. Meanwhile, Langevin et.al (2007) finds low closing rates of equipment through audit investigation of 16 buildings in North America. And he proposes that simulation models of HVAC systems and rooms can be used during the planning phase of a project for a proper system design. In summary, the uncertainty of energy use behavior of users will lead to huge changes in office building energy. We need to better explain the human factors in the energy consumption model of office buildings. Relatively speaking, due to the lack of experimental means for this kind of macroeconomic analysis, it is difficult to carry out more detailed analysis.
At present, many offices building managers face a dilemma in terms of energy consumption: on the one hand, users need to consume energy to meet their demands; on the other hand, managers need to minimize energy consumption through energy management policies and technologies. To solve this problem, we use multi-agent simulation modeling method to establish a dynamic micro-simulation model that can be dynamically adjusted from the description of the main components of the office building energy consumption system and their interaction rules. By observing the complex energy behaviors emerging from microscopic individuals, the impact of energy use on building energy consumption is explored, providing reference and suggestions for office building managers to solve actual energy problems.
Multi-Agent Modeling about Office Building Energy Consumption
In the field related to complexity research, Agent-based modeling and simulation (ABMS), as a complex system methodology has become an important research tool for academia(Casalicchio, E et.al 2009).On the basis of observing the real-world system, the multi-agent simulation method designs and verifies the simulation model on the perspective of initiative and adaptability, and does not attempt to establish a universally applicable general theoretical framework. Therefore, the multi-agent simulation method can show obvious advantages when there are obvious heterogeneity between the rules of the principal decision-making in the system, the main body and the interaction rules between the main body and the environment (Shen, Y. 2012).
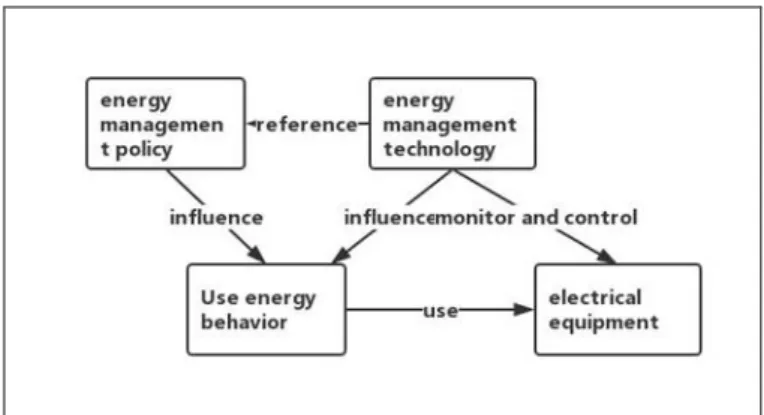
Office building energy system is a typical complex system, the system includes the following four important elements:(1) Energy consumption management policies and rules formulated by the office building energy management department; (2) Energy management technologies used in office buildings, such as energy consumption metering technology and automatic switch control; (3) The type, quantity and distribution of electrical equipment in office buildings, such as lights and computers; (4) Energy consumption behavior when using various types of electrical equipment in an office building.
These four elements interact with each other to form an office building energy consumption system. The interaction between them is shown in Figure 1:
Figure 1. Four-element interaction of energy consumption in office buildings
In the office building energy consumption system, individual energy demands can be influenced by individual needs, energy management policies and other factors to determine the current energy use behavior in office buildings and generate interaction with power consuming equipment. Since there is not a unified and comprehensive theoretical system for analyzing the impact of energy consumption on energy consumption in office buildings, it is necessary to establish a theoretical system based on real world observations from an individual perspective of an individual's behavioral state transition model. The multi-agent simulation method can be a good solution to the above problems.
The Introduction of Model
The basic steps for establishing a conceptual model include: (1) clarifying the objectives of the simulation model and dividing the system boundary; (2) identifying the subject in the system and assigning attributes to the subject; (3) establishing a behavioral state model for each subject; (4) Establish an interaction model between subjects. Therefore, this section will describe the energy consumption simulation model of office buildings from the above four aspects.
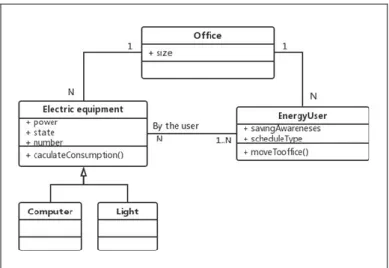
The main agents in the system are individual users, electrical appliances and offices. The energy policy and management technology elements in the system are the external conditions that are affected when the entity makes decisions. The office accommodates multiple office users and multiple power-consuming devices (the office agent in this article is a generic concept, and the corridors are also within the scope of the office agent), and office users use a variety of energy consuming devices to cause energy consumption through daily activities.
In this simulation model, the main objective of the user's agent is to make decisions on energy use behavior based on changes in external conditions. Therefore, it is an active type. The target of the electrical appliances agent is for the user to use, passively respond to the decision of the user's agent and directly generates energy consumption. Therefore, it is a passive type. The basic function of the office agent is to provide the distribution relationship between users and electrical appliances in the entire building.
The simulation model of the energy consumption system is summarized as shown in Fig.2.
Figure 2. A Static Structure Between The Agent
Each agent has a certain internal state, which can be used as a parameter, and the parameters are the attributes of the agent. The parameter reflects the state of the agent. Each agent has many attributes that require simulation targets to determine which attributes needs to be set.
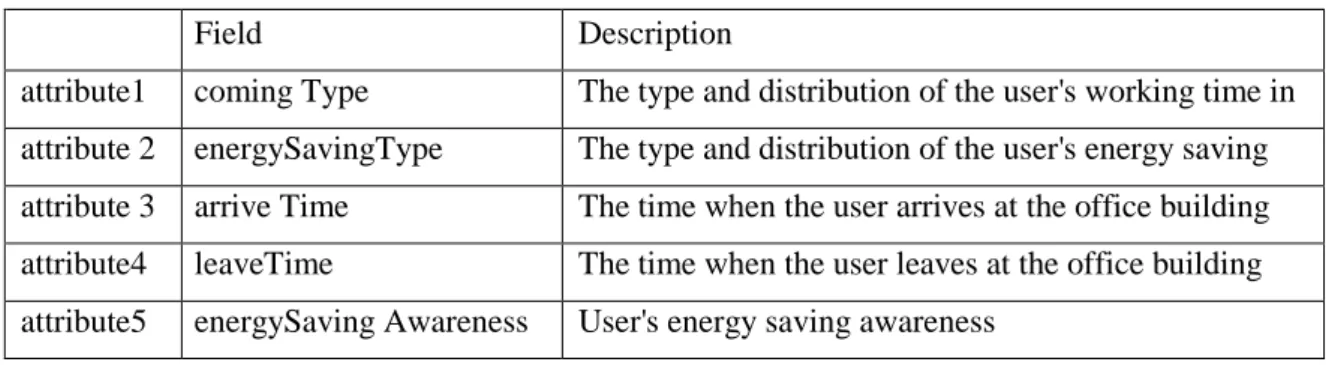
The user's energy consumption behavior is related to the user's behavioral law and energy saving awareness. This paper selects the following parameters to quantify the user's energy consumption behavior in office buildings.
Table 1. The Attributes of The EnergyUser
Field Description
attribute1 coming Type The type and distribution of the user's working time in attribute 2 energySavingType The type and distribution of the user's energy saving attribute 3 arrive Time The time when the user arrives at the office building attribute4 leaveTime The time when the user leaves at the office building attribute5 energySaving Awareness User's energy saving awareness
The parameters of the electrical agent and the office agent are shown in Table 2 and Table 3. The use of electrical appliances directly causes energy consumption, so its state and power have a direct impact on the amount of electricity used.
Table 2. The Attribute of The Electrical Appliance
Field Description
attribute1 power The power of the light
attribute 2 stateRecoder The state of the electrical appliance
attribute 3 office The office where the electrical appliance is located
Table 3. The Attribute of Office
Field Description Attribuet1 officeName Office’s name
Attribuet2 officeSize The number of people in the office Attribuet3 numberLight The number of the lights in the office Attribuet4 numberComputer The number of the computers in the office
The State Model of Agent
The state model describes the dynamic behavior of an agent based on the event response, shows the state of change between the behaviors of the agent, and knows what state the behavior is at a certain time, which can directly reflect the behavior of the agent. In the energy consumption system of office building, the agent of the user's energy behavior is not perfect theoretical research as a support; we must conduct a detailed and in-depth empirical investigation and observation based on the actual situation, and then abstract its behavior state model.
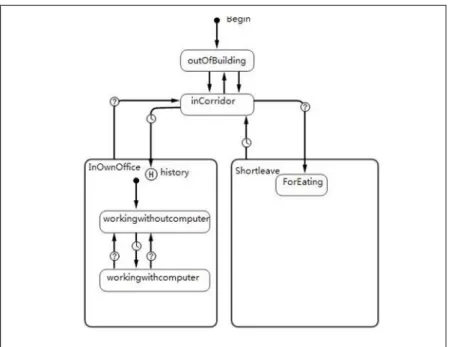
The Behavior of Energy User Agents
In the real office building energy consumption system, the users mainly have the following four states: out of building, in the corridor, in own office and for short leaving.
Figure 3. The Behavior State of The Energy User Agent
For a typical user, his/her activities are mainly: work in the office, a brief departure and leave the office. The corridor is a major connection point in the switching of the three states. When the user is in the corridor, it’s possible for lights at the corridor to produce electricity. The “in own office” state is the most important activity status of the user, with the longest duration. During this time period, the main electrical equipment used by the user is the computer and the light. Therefore, the control of the computers and the lights are noteworthy user activities. For “short leaving” state, the user leaves the office for a meal, but returns shortly. Therefore, whether or not the user has switched off the electric appliances, the users’ habit will affect the energy consumption within the time period. For the state of “leave the office”, the user ends the day of work and leaves the system and no longer uses the equipment in the building. However, the user’s disposal options for the electric equipment before leaving may still affect the energy consumption in the building.
The Behavior of Electric Appliance Agents
In the model, the light agents in the three-floor room are passive agents. Their behavior is a passive response to the behavior of energy users, namely ‘switch on’ and ‘switch off’. The state chart is shown in Figure4.
Figure 4. The Behavior State of The Light Agent
The power of the light is 60w, and the light opens or closes by touching the switch. The transition from off to on is associated with the presence of the user, and the transition from on to off in related to the departure of the user.
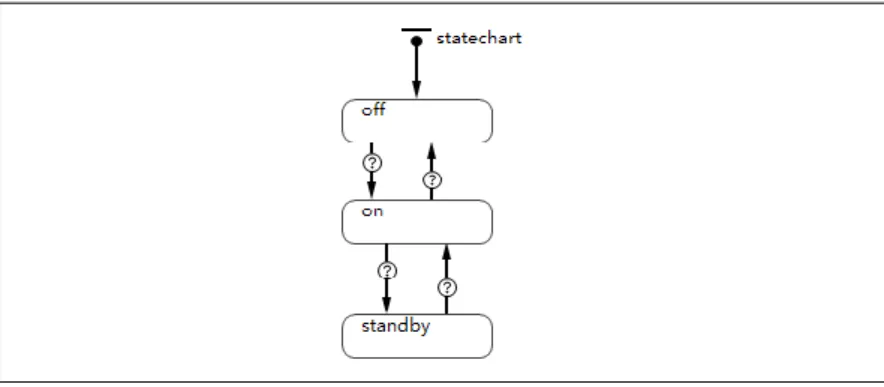
Similarly, the computer agents are passive agents in the model. Computers can be off, on and standby. Their behavior is shown in Figure5.
Figure 5. The Behavior State of The Computer Agent
For a computer, the transitions between on, off and standby are associated to the users’ behavior of using the computer. When a computer is on, its overall power is 70w; when it is off, its power is 0; when it is on standby state, its power is 25w.
Interaction between Agents
The energy user agents are the active agent and are automatically select the change of states and transitions depending on the changes in conditions of the outside world. The light and computer agents are passive to response the behavior of energy user, and their transition transfer is according to the energy users instructions. The office agents accommodate energy users, lighting and computer agents, and the transition transfer is related to the number of users.
Instate of Energy Consumption and Empirical Investigation: A Case Study
A university office building was completed in 2011 and is a place where hundreds of graduate students and teachers have conducted scientific research. By researching the type、quantity and distribution of electrical appliances in office building, we found that power plants are equipped with lighting、computers、air-conditioners、computer servers, and an electricity meter for energy consumption per floor. Through the statistics of the total electricity used of the school office building in 2016, we found it has nearly doubled to nearly 360 kilowatt-hours per person, and energy efficiency is higher than the standard of a person's energy efficiency. The building’s energy saving potential is bigger.
This article chose the third floor of the college building as the case study for the following reasons: (1) The third floor of the building is the area of the graduates’ research area of the college. And the characteristics and the behavior patterns of graduate students are similar. (2)The number of graduate students in the building is far higher than the number of teachers and administrators. (3) Depending on the statistics, the average time for graduate students in office buildings is greater than that of other groups. Because there is no natural gas heating in the building in the winter, mainly to air conditioner heating, and the amount of energy expended in buildings is electricity, this article focuses on electric energy consumption. The air conditioner is not part of the simulated model in this article for the time being. And the reasons for this are as follows: (1) The energy consumption of the air conditioner is related to outdoor weather conditions, internal temperature, construction load and air-conditioner’s equipment parameters. Calculating the energy consumption of air conditioner is complex. (2) The use of an air conditioner is seasonal. During the simulation of the model, the usage frequency of an air conditioner in the office building is low. (3) In this article, the electricity meter has been used to measure the energy consumption of air-conditioners. The number of people and facilities on the third floor of the building is shown in table4.
Table 4. The Situation of Electricity Equipment of The Office Building
Rooms People Lights Computers
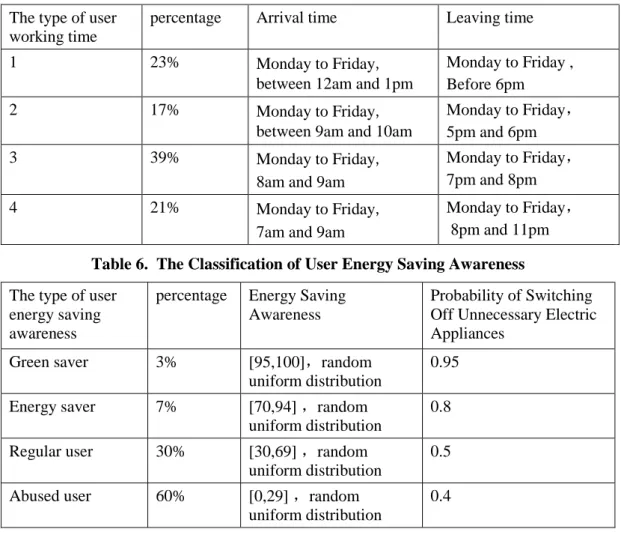
User behavior and users’ saving awareness can lead to the difference in energy consumption. To learn more about the usage pattern of users’ behavior on the third floor, the author does a wide range of empirical research on users’ behavior. The author chose three time segments each day to observe users’ behavior in 3weeks, and posted questionnaires on the Internet and returned 200 copies of valid questionnaires. According to the actual results, the author got the working time type and energy-saving awareness type of energy users. Not only that, the author assigned the proportion of each type of population and the probability of turning down when users don’t electrical appliances, as showed in Table 5 and Table 6.
Table 5. The Classification of Users Working Time
The type of user working time
percentage Arrival time Leaving time 1 23% Monday to Friday,
between 12am and 1pm
Monday to Friday , Before 6pm 2 17% Monday to Friday,
between 9am and 10am
Monday to Friday,
5pm and 6pm 3 39% Monday to Friday,
8am and 9am
Monday to Friday, 7pm and 8pm 4 21% Monday to Friday,
7am and 9am
Monday to Friday, 8pm and 11pm
Table 6. The Classification of User Energy Saving Awareness
The type of user energy saving awareness
percentage Energy Saving Awareness
Probability of Switching Off Unnecessary Electric Appliances
Green saver 3% [95,100],random uniform distribution
0.95 Energy saver 7% [70,94] ,random
uniform distribution
0.8 Regular user 30% [30,69] ,random
uniform distribution
0.5 Abused user 60% [0,29] ,random
uniform distribution
0.4
Simulation Experiments Design and Results Analysis
This article is based on the real environment of the third floor of the office building and implements the simulate model of computer simulation in AnyLogic7.0.2. The simulation model must be validated to ensure the validity of the model’s results and ensure the model matches the reality. This article carries out three simulated experiments: (1) this experiment will reproduce the current energy situation, gain the average daily consumption and the trend of energy consumption in simulation to verify the model; (2) this experiment will research the impact of different energy management strategies on energy consumption; (3) this experiment will explore the impact of improving the energy saving awareness of users on different management strategies on the basis of the experiment 2.
Set Situational Parameters
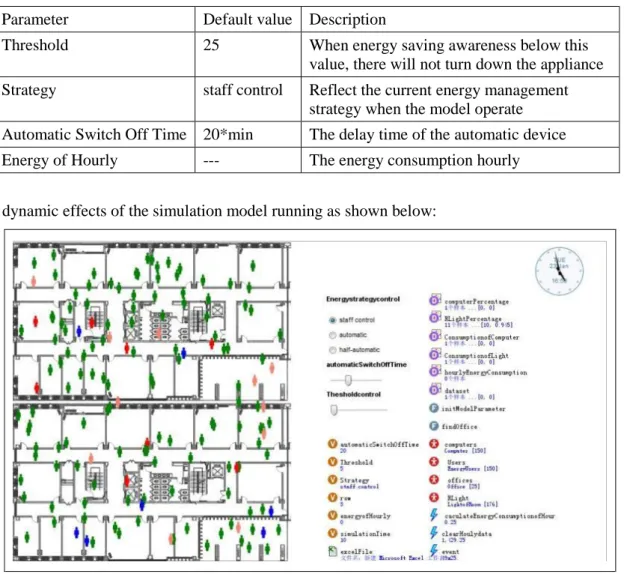
Table 7. The Scenario Parameters in The Model
Parameter Default value Description
Threshold 25 When energy saving awareness below this value, there will not turn down the appliance Strategy staff control Reflect the current energy management
strategy when the model operate Automatic Switch Off Time 20*min The delay time of the automatic device Energy of Hourly --- The energy consumption hourly The dynamic effects of the simulation model running as shown below:
Figure 6. Simulation Model Dynamic Running Renderings
In the simulation model operation, the color of the users will change as the state changes. For example, an individual presents a green color when the user is in the office, an individual is pink when the individual is in the hallway, and an individual appears red when the user leaves the office.
Experiment 1: verify the model
At present, the floor of the building takes artificial energy management strategy and the user control the lights to open and close. This experiment aim to reproduce the current energy situation in this building and to verify the model to ensure the model matches the reality. On the basis of parameters setting, repeat the experiment for 3 times, and each time running for 1440*5 model times to collect time-sharing energy data and display it through a line chart.
Experiment 2: the energy consumption situation in different management strategy
In the background of energy-saving and emission-reduction, more and more buildings promote the automatic energy strategy, i.e. installing sensors to control the opening and closing of various devices. In term of energy management strategy of lighting, there is no definite evidence that the manual controlled strategy is less efficient than the automation controlled strategy. There seems to be a debate between the automatic strategy and staff-controlled strategy.
This experiment aims to explore the impact of different energy management strategy on energy consumption. This experiment will treat the energy management strategy as an independent variable
to observe the changes in energy consumption. And the energy consumption is reflected by the daily consumption indicator. The experiment set up two sets of juxtaposed experiments on the setting of the scenario parameters: dividing the energy management strategy into staff-controlled strategy and automatic strategy to simulate daily energy consumption. Under the automated lighting strategy, when a user's presence is detected, the sensor automatically turns on the light and automatically turns off the light after 20 minutes of his/her leave. At this scenario, user can’t control lights, and can control the computer to open or close. Except the energy management strategy, other variables are control variables. Each experiment runs three times, with a length of 1440 * 5 model times (6 times in total), to collect data on energy consumption and analyze it, and present them through a time stack.
Table 8. The Parameters in The Model
Strategy Threshold Automatic Switch Off Time Strategy1 Staff control 25 none
Strategy2 automatic 25 20min
Experiment 3: the effect of two energy strategy when improve the users’ saving awareness
On the basis of experiment 2, this experiment adds to the consideration of users' energy saving awareness, and explores the impact of energy saving awareness on energy consumption under different energy strategies. In this section, the energy saving awareness of energy users in the model is reallocated before the model is initialized, and the proportion of people with high saving awareness is improved. The pre-and post-improvement user's energy saving awareness assignments are shown in table9.
This experiment will set two sets of control experiments on the basis of experiment2 after increasing the proportion of people with high energy saving awareness. Each experiment run three times, with a length of 1440 * 5 model times (6 times in total), to collect data on energy consumption and analyze it, and present them through a time stack
Table 9. the Assignment of User Energy Saving Awareness
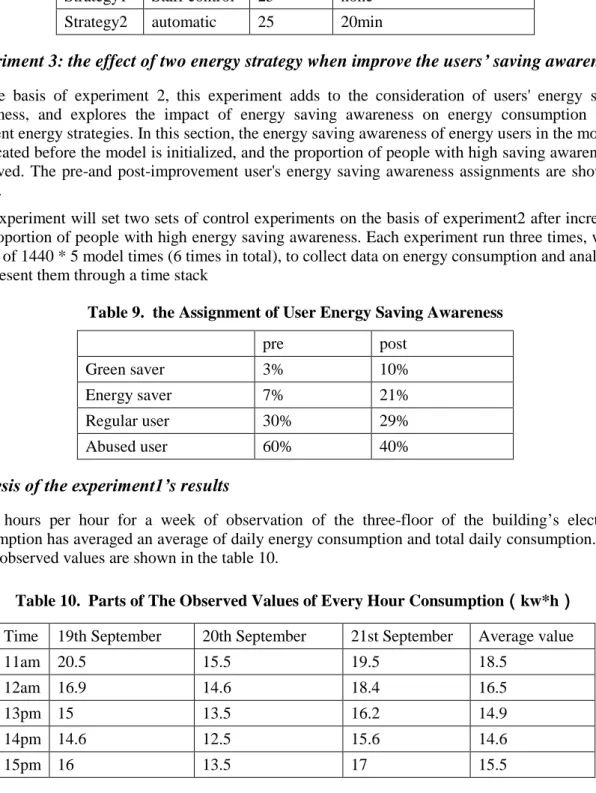
pre post Green saver 3% 10% Energy saver 7% 21% Regular user 30% 29% Abused user 60% 40%
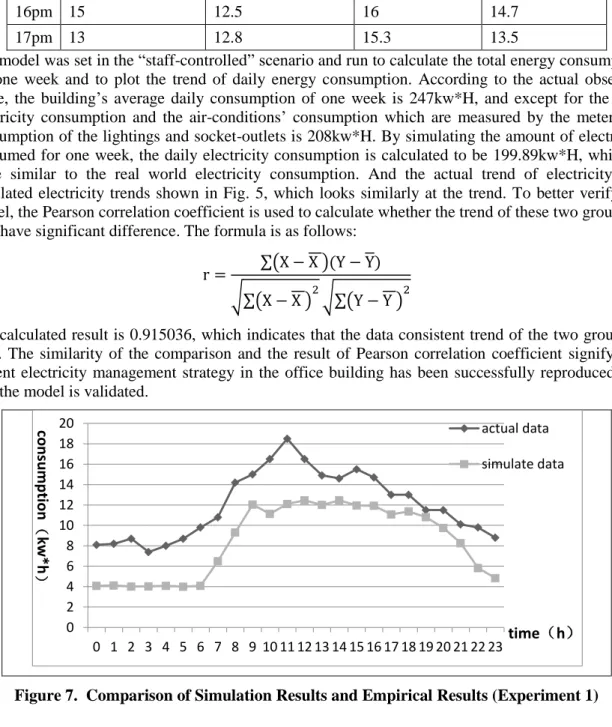
Analysis of the experiment1’s results
Three hours per hour for a week of observation of the three-floor of the building’s electricity consumption has averaged an average of daily energy consumption and total daily consumption. Parts of the observed values are shown in the table 10.
Table 10. Parts of The Observed Values of Every Hour Consumption(kw*h)
Time 19th September 20th September 21st September Average value 11am 20.5 15.5 19.5 18.5
12am 16.9 14.6 18.4 16.5 13pm 15 13.5 16.2 14.9 14pm 14.6 12.5 15.6 14.6
16pm 15 12.5 16 14.7 17pm 13 12.8 15.3 13.5
The model was set in the “staff-controlled” scenario and run to calculate the total energy consumption for one week and to plot the trend of daily energy consumption. According to the actual observed value, the building’s average daily consumption of one week is 247kw*H, and except for the base electricity consumption and the air-conditions’ consumption which are measured by the meter, the consumption of the lightings and socket-outlets is 208kw*H. By simulating the amount of electricity consumed for one week, the daily electricity consumption is calculated to be 199.89kw*H, which is quite similar to the real world electricity consumption. And the actual trend of electricity and simulated electricity trends shown in Fig. 5, which looks similarly at the trend. To better verify the model, the Pearson correlation coefficient is used to calculate whether the trend of these two groups of data have significant difference. The formula is as follows:
r = ∑(X − X )(Y − Y)
√∑(X − X )2√∑(Y − Y )2
The calculated result is 0.915036, which indicates that the data consistent trend of the two groups is high. The similarity of the comparison and the result of Pearson correlation coefficient signify that current electricity management strategy in the office building has been successfully reproduced and also the model is validated.
Figure 7. Comparison of Simulation Results and Empirical Results (Experiment 1)
Analysis of the experiment2’s results
Table 11. Parts of Empirical Value in Experiment2(kw*h)
Date Staff-controlled strategy Automatic strategy 9.25 194.2431 183.2342 9.26 192.2356 180.4920 9.27 186.0011 178.9907 9.28 183.2433 175.3955 9.29 191.0227 174.9555 Total consumption 946.7458 893.0679 0 2 4 6 8 10 12 14 16 18 20 0 1 2 3 4 5 6 7 8 9 10 11 12 13 14 15 16 17 18 19 20 21 22 23 actual data simulate data time(h) c o n su mption (kw *h )
Figure 8. Energy Consumption Comparison in Different Energy Management Strategy
Run the model and gain the simulation results in table12 and Fig.6, which shows that the energy consumption of the automatic strategy is lower than the staff-controlled strategy’s consumption. Through the time stack in Fig.8, it can be seen that the peak time energy consumption of two strategies is almost same. The difference is the trough time energy consumption, which means users have poor saving awareness to turn down the appliance when they don’t have to use it, resulting in the trough time there is still unnecessary waste of energy.
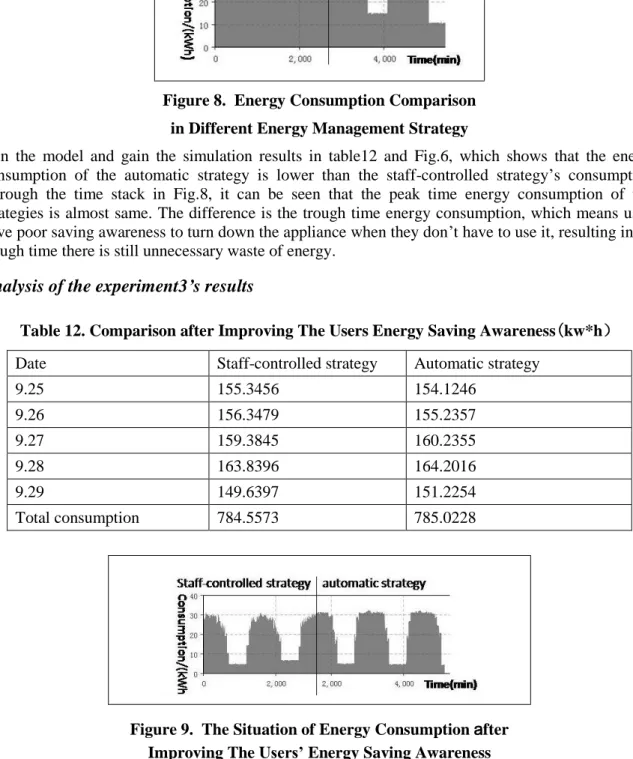
Analysis of the experiment3’s results
Table 12. Comparison after Improving The Users Energy Saving Awareness(kw*h)
Date Staff-controlled strategy Automatic strategy 9.25 155.3456 154.1246 9.26 156.3479 155.2357 9.27 159.3845 160.2355 9.28 163.8396 164.2016 9.29 149.6397 151.2254 Total consumption 784.5573 785.0228
Figure 9. The Situation of Energy Consumption after Improving The Users’ Energy Saving Awareness
Comparing the total energy consumption between table 12 and table 13, it shows that the overall energy consumption in the building will decrease after increasing the user's energy saving awareness. From the comparison of two strategy in table 12 and Fig.9, it can be seen that automatic control is not much less energy-saving than human control, which means that when users energy saving awareness improves, the automatic strategy will not be much different from staff-controlled strategy .Compared to the technical improvement, the user's energy behavior is also the main influencing factors of energy consumption, affirmed the human behavior of the important impact on energy consumption.
Conclusion
This paper presented an integration of the four elements involved in office energy consumption, and then developed an agent-based model of office energy consumption based on the case of office building and presented the simulation results. After verifying the model, this paper designed experimental scenarios and explained the simulation results. Based on the experimental results and analysis, this paper has the following conclusions:
(1)In the environment where users’ awareness of energy conservation is generally poor, automated energy management strategy will save energy compared to staff-controlled management strategy. (2)A significant increase in the energy saving awareness of users not only reduces unnecessary consumption, but also changes in effective energy management strategy. When users’ energy saving awareness improves, automated energy management strategy will not be much different from staff-controlled management strategy.
(3)Multi-agent simulation can be used as a very effective method and technical tool for building the office building energy consumption model. The "artificial laboratories" of energy consumption research are constructed by means of computers. Experimental research based on simulations can provide practical and theoretical basis for the management and implementation of energy-saving measures for energy consumption of office buildings.
Although the energy simulation model based on a comprehensive empirical survey, the users’ electricity behavior is basically deducted. Clearly the model does not replicate the users’ real life, the model has limitations.
(1)After the comprehensive empirical survey, the classification of the user agents is divided into four categories, which means an energy user agent’s stereotype in the model is fixed. However, the switch of stereotypes can happen for some reasons in the real world.
(2)At the property set of the energy user saving awareness, the communication between people is ignored. This interaction may lead to changes in users’ saving awareness.
(3) Since air-conditions’ consumption can be affected by varieties of factors, and the calculation is complex and use less during the operation, the air-condition agent is not included in the model. The agent-based model of office building energy consumption described in this paper has potential for further development. Theoretically, the interaction between users and more flexible human–electric appliance interactions can be incorporated into the model, which will make the model more applicable. Moreover, the psychological factors can be added into the energy user agents, and study how to optimize energy consumption while maintain staff’s satisfaction about energy use.
References
Amasyali, K., and El-Gohary, N. M. 2017. " A Review of Data-Driven Building Energy
Consumption Prediction Studies," Renewable & Sustainable Energy Reviews (81), pp. 1192-1205.
Chen, Y., Tan, H., Zhou, Y., Xu, W., Feng, W., and Yi, B. 2017. "Study on Energy Consumption Quota of Public Buildings in Hangzhou," Construction Science (12), pp. 90-95.
Colmenar-Santos, Antonio, Lober, T. D., Noemi, L., Borge-Diez, and David. 2013. "Solutions to Reduce Energy Consumption in the Management of Large Buildings," Energy & Buildings
(56:56), pp. 66-77.
Casalicchio, E., Galli, E., and Tucci, S. 2009. "Modeling and Simulation of Complex Interdependent Systems: A Federated Agent-Based Approach," in: Critical Information Infrastructure Security. Springer-Verlag, pp. 72-83.
Duarte, C., Van Den Wymelenberg, K., and Rieger, C. 2013. "Revealing Occupancy Patterns in an Office Building through the Use of Occupancy Sensor Data," Energy and Buildings (67:4), pp. 587-595.
Langevin, J., Wen, J., and Gurian, P. L. 2015. "Simulating the Human-Building Interaction: Development and Validation of an Agent-Based Model of Office Occupant Behaviors," Building and Environment (88:3), pp. 27-45. Liu, R. 2013. "Optimization of Office Energy Saving Scheme and Technical Analysis," Southeast University
Li, Y., Niu, H., Dong, X., Liu, X., Chu, G., and Wang, Q. 2016. "Research on Method of Energy Consumption Quota for Public Buildings Based on Total Control," Journal of Shandong Jianzhu University (31:3), pp. 219-223.
Liu, R. 2013. "Optimization of Office Energy Saving Scheme and Technical Analysis." Southeast University.
Masoso, O. T., and Grobler, L. J. 2010. "The Dark Side of Occupants’ Behavior on Building Energy Use," Energy and Buildings," Energy and Buildings (42:2), pp. 173-177.
Refahi, A. H., and Talkhabi, H. 2015. "Investigating the Effective Factors on the Reduction of Energy Consumption in Residential Buildings with Green Roofs," Renewable Energy (80:4), pp. 595-603.
Sanchez, M., Webber, C., Brown, R., Busch, J., Pinckard, M., and Roberson, J. 2007. "Space Heaters,
Computers, Cell Phone Chargers: How Plugged in Arecommercial Buildings?," Lawrence Berkeley National Laboratory).
Shen, Y. 2012. "Research on the Modeling and Simulation of Multi-Agent System with Complex Event Scheduling Logic and Bayesian Network Decision-Making." Nanjing University of Aeronautics and Astronautics.
Wu, W., Xu, Q., Yan, Z., and Lin, Y. 2017. "Application of Lssvm Model in Prediction of Building Energy Consumption," Journal of Fuzhou University (Natural Science Edition) (45:2), pp. 238-245.
Webber, C., Roberson, J., Mcwhinney, M., Brown, R., Pinckard, M., and Busch, J. 2006. "After-Hours Power Status of Office Equipment in the USA," Energy (31:14), pp. 2823-2838.
Zhang, S. P., Xu, X. J., and Li, R. 2012. "The Influence Factors of Energy Consumption and Energy Savings Potential in Office Buildings," Applied Mechanics & Materials (209:211), pp. 1820-1824.