University of Wollongong University of Wollongong
Research Online
Research Online
University of Wollongong Thesis Collection
2017+ University of Wollongong Thesis Collections
2017
Urban flood modelling using geo-social intelligence
Urban flood modelling using geo-social intelligence
Kun YangUniversity of Wollongong
Follow this and additional works at: https://ro.uow.edu.au/theses1
University of Wollongong University of Wollongong
Copyright Warning Copyright Warning
You may print or download ONE copy of this document for the purpose of your own research or study. The University does not authorise you to copy, communicate or otherwise make available electronically to any other person any
copyright material contained on this site.
You are reminded of the following: This work is copyright. Apart from any use permitted under the Copyright Act 1968, no part of this work may be reproduced by any process, nor may any other exclusive right be exercised, without the permission of the author. Copyright owners are entitled to take legal action against persons who infringe
their copyright. A reproduction of material that is protected by copyright may be a copyright infringement. A court may impose penalties and award damages in relation to offences and infringements relating to copyright material.
Higher penalties may apply, and higher damages may be awarded, for offences and infringements involving the conversion of material into digital or electronic form.
Unless otherwise indicated, the views expressed in this thesis are those of the author and do not necessarily Unless otherwise indicated, the views expressed in this thesis are those of the author and do not necessarily represent the views of the University of Wollongong.
represent the views of the University of Wollongong.
Recommended Citation Recommended Citation
Yang, Kun, Urban flood modelling using geo-social intelligence, Master of Philosophy thesis, School of Computing and Information Technology, University of Wollongong, 2017. https://ro.uow.edu.au/theses1/ 47
Urban Flood Modelling Using Geo-social Intelligence
A thesis submitted in partial fulfilment
for the award of the degree Master of
Philosophy
from
University of Wollongong
by
KUN YANG
4814265
School of Computing and Information Technology
March 2017
I, Kun Yang, declare that this thesis, submitted in partial fulfilment of
the requirements for the award of Master of Philosophy (Information
Technology), in the School of Computing and Information
Technology, University of Wollongong, is wholly my own work
unless otherwise referenced or acknowledged. The document has not
been submitted for qualifications at any other academic institution.
Kun Yang
Acknowledgements
I would like to thank the University of Wollongong’s SMART Infrastructure Facility for their ongoing support with my Masters of Philosophy research. I could not have hoped to have worked on a more interesting project that had real world application, than PetaJakarta.org. PetaJakarta was a UOW defined project, that was awarded a competitive Twitter Data Grant that meant my work had a real impact in Jakarta, Indonesia, helping local authorities to respond to seasonal monsoonal flooding, and raising awareness among the community on how geo-social intelligence could be used to harness collective intelligence.
While at the University of Wollongong, I was situated in the SMART Infrastructure Facility with direct access to Dr Tomas Holderness, a chartered geographer and Vice Chancellor Fellow from whom I am indebted to for his patience and vision. Tomas Holderness together with the co-director of PetaJakarta Dr Etienne Turpin, is now at the MIT Urban Risk Lab. Tomas was responsible for the three specific experiments that I had to complete as part of this MPhil. He led my technical contributions into the wider PetaJakarta project, and quite unbelievably I saw the fruits of my work being implement live into Jakarta between June 2013 and June 2016. Sometimes timing is everything, and I feel I hit the jackpot.
To my primary supervisor, Professor Katina Michael who patiently took me through the research process, explained the fundamentals of GIS and database principles in the context of social media, and crowdsourcing urban data, a very big thank you! You were there for me every step of the way, inspiring me toward completion. I miss our weekly meetings. Katina you helped me realise my dreams, and you never let me lose sight of the bigger picture. You are the reason why I am now back in China thriving in my own organisation with angel investors backing me up. You listened so carefully to all my thoughts, ideas, beyond the thesis. I will never ever forget what you have done for me. Associate Professor Jun Shen, thank you for your final year’s co-supervision when Dr Holderness left for MIT. I enjoyed completing coursework with you and your ongoing advice about how to prepare for the final write up. I also appreciate the assistance of Dr Roba Abbas who edited the last draft of my work. And of course the lecturers who taught me in 30 credit points I completed toward this degree.
Finally, to my mother and father, thank you. Without your support, none of this would be possible. You helped me every day of my life. I dedicate this work to you.
Online Contributions
The PetaJakarta Project, though meant to solve an urban flooding problem, has had a global reach. It has changed the way that government and non-government organisations approach disasters in megacities by raising the possibility of using social media to respond and then forward plan for future events. The Jakarta Emergency Management Agency (BPBD DKI Jakarta) was a direct client of my work, although my segment was a small part of the project at large, it was an integral piece into analysing the relationship between Tweets and actual flood zones. Please see the following reputable media publications of which my research directly contributed. Rapid application development meant rapid deployment was possible. An online tool for civic engagement during emergency events:
http://smart.uow.edu.au/projects/petajakarta-org/index.html
Social data mapped in real time helping to save lives and inform emergency services during extreme weather events: https://www.uow.edu.au/research/researchimpact/UOW208258.html
Harnessing social media to respond to natural disasters:
https://globalchallenges.uow.edu.au/impact/UOW219619.html
Peta Jakarta: real-time flood mapping in Jakarta: http://theodi.org/odi-showcase-peta-jakarta-real-time-flood-mapping-jakarta
PetaJakarta: what works: http://www.newcitiesfoundation.org/global-urban-innovators-alumni/petajakarta/
PetaJakarta case study: https://aws.amazon.com/solutions/case-studies/petajakarta/
How tweeting about floods became a civic duty in Jakarta:
https://www.theguardian.com/public-leaders-network/2016/jan/25/floods-jakarta-indonesia-twitter-petajakarta-org
Need the latest news on flooding? In Jakarta, there's an app for that:
https://www.pri.org/stories/2016-09-16/need-latest-news-flooding-jakarta-theres-app
Peta Jakarta gets netizens to report floods:
http://www.thejakartapost.com/news/2015/02/04/peta-jakarta-gets-netizens-report- floods.html
Jakarta: A City on the Edge of a Social Media Revolution:
http://voices.nationalgeographic.com/2016/02/10/jakarta-a-city-on-the-edge-of-a-social-media-revolution/
Dari Jakarta sampai London: Bagaimana kota-kota dunia melawan polusi udara?
http://www.bbc.com/indonesia/majalah-39176908
Antara doeloe: peta Jakarta versi swasta banyak keliru:
http://www.antaranews.com/berita/587014/antara-doeloe-peta-jakarta-versi-swasta-banyak-keliru
Making smart cities work for people. No 1: Crowdsourcing flood maps in Jakarta:
http://www.citymetric.com/horizons/making-smart-cities-work-people-no-1-crowdsourcing-flood-maps-jakarta-1228
This site lets you know when Jakarta’s streets turn to rivers:
https://www.techinasia.com/indonesia-jakarta-floods-peta-app
Be a Global Urban Innovator! A Call for the World’s Best Ideas to Make our Cities Better:
http://www.huffingtonpost.com/adam-cutts/be-a-global-urban-innovat_b_8837736.html
Banjir Jakarta Bisa Dipantau dari PetaJakarta.org:
http://www.cnnindonesia.com/teknologi/20141202180741-185-15349/banjir-jakarta-bisa-dipantau-dari-petajakartaorg/
Corporate Social Responsibility for a Data Age:
https://ssir.org/articles/entry/corporate_social_responsibility_for_a_data_age
Ini peta banjir di Jakarta berdasarkan aduan masyarakat:
http://www.antaranews.com/berita/479026/ini-peta-banjir-di-jakarta-berdasarkan-aduan-masyarakat
PetaJakarta turns tweets into flood alerts – ANDS: http://www.ands.org.au/news-and-events/dataimpact/data-impact-stories/petajakarta-turns-tweets-into-flood-alerts
Additionally, I have submitted a full research paper for consideration to the forthcoming International Symposium on Technology and Society 2017, to be held in Sydney, Australia in August 2017.
Abstract ... 9
Chapter 1. Introduction ... 11
1.1 Definitions ... 11
1.2 Research Background ... 12
1.2.1 Jakarta Flooding ... 12
1.2.2 The Role of Social Media... 14
1.2.3 PETAJakarta.org... 16
1.3 Research Question and Aim ... 17
1.4 Research Objectives ... 18
1.5 Outline of the Thesis ... 19
Chapter 2. Literature Review ... 20
2.1 Introduction ... 20
2.1.1 Technical Background ... 20
2.1.2 Existing Literature Reviews ... 22
2.2 Review method ... 23
2.3 Review Results... 24
2.3.1 Methods Used to Analyse Data from Twitter ... 24
2.3.2 Management of Health ... 27
2.3.3 Monitoring of Traffic ... 27
2.3.4 Making Inferences Using Location ... 28
2.3.5 Social Network Analysis ... 28
2.4 Discussion... 29
2.4.1 Synthesis of Relevant Literature ... 29
2.4.2 Gaps & Limitations in Past Research... 35
2.5 Conclusion ... 37 Chapter 3. Methodology... 38 3.1 Introduction ... 38 3.2 Research Strategy ... 38 3.3 Multiple Datasets ... 39 3.3.1 Dataset A ... 39 3.3.2 Dataset B ... 39 3.4 Systems diagram ... 40 3.4.1 Framework ... 40
3.4.2 Research Diagram ... ... 40
3.4.3 Software ... 42
3.5 Experiments... 46
3.5.1 Summary Statistics ... 46
3.5.2 Time Series Plot ... 47
3.5.3 Relationship between Twitter Activity and Flood Events ... 47
3.6 Data Analysis ... 48
3.7 Conclusion ... 48
Chapter 4. Results... 49
4.1 Experiment One ... 49
4.1.1 Processes Employed to Achieve Objective 1 ... 49
4.1.2 Experiment Outcomes ... 52
4.2 Experiment Two ... 53
4.2.1 Processes Employed to Achieve Objective 2 ... 53
4.2.2 Experiment Outcomes ... 55
4.3 Experiment Three ... 56
4.3.1 Processes Employed to Achieve Objective 3 ... 56
4.3.2 Experiment Outcomes ... 59
4.4 Discussion and Analysis ... 62
4.4.1 Findings and Illustrations ... 63
4.4.2 Benefits of Twitter in Floods ... 64
Chapter 5. Conclusion ... 67
5.1 Introduction ... 67
5.2 Principal Findings and Major Contributions... 67
5.3 Limitations and Next Steps ... 67
5.4 Future Research ... 70
5.5 Conclusion ... 71
Appendices ... 73
Appendix A - Experiment 1 ... 73
1. Codes for PostgreSQL:... 73
Appendix B - Experiment 2... 76
1. Codes for PostgreSQL:... 76
2. Codes for Python:... 76
Appendix C - Experiment 3 ... 80
1. Codes for PostgreSQL:... 80
2. Codes for Python:... 80
Abstract
Social media is not only a way to share information among a group of people but also an emerging source of rich primary data that can be crowdsourced for good. The primary function of social media is to allow people to network near real-time, yet the repository of amassed data can also be applied to decision support systems in response to extreme weather events.
The megacity of Jakarta, Indonesia has the greatest number of Twitter users of any city worldwide. Furthermore, the city experiences seasonal flooding during the annual monsoon seasons, which endangers human health, damages civic infrastructure and causes large economic loss. In this study, the use of social media data is examined as a way to help government organisations respond to flooding in a timely manner.
Tweets from two previous monsoons related to flooding were collected and analysed using the hashtag (#) “banjir”. Additionally, government data sources on the location of flood events in the city over the same period were collected. By analysing the relationship between the tweets and the flood events, this study aims to create “trigger metrics” of flooding based on Twitter activity. Such trigger metrics have the advantage of being able to provide a situational overview of flood conditions in near real-time, as opposed to formal government flood maps which are only produced on a six-hourly schedule. The aim is to provide continuous intelligence, rather than discrete intervals of decision-making capability.
The theory of this thesis demonstrated is to enhance the capacity to understand and promote the resilience of cities to both extreme weather events due to climate change and to long-term infrastructure transformation with the process of climate adaptation. To understand the full potential of Twitter as a real-time indicator for flooding, this research aims to quantify the temporal relationship between tweets related to flooding, and flood events in the city of Jakarta, Indonesia. This research can also provide methodological support to make social media a real time crowd-sourcing tool during extreme weather events. Past Twitter data and the real observed flooding events are used as the basis for modelling the urban flooding event in its totality.
To advance the comprehensive understanding of the relationship between flood events and Twitter activity in Jakarta and the modelling of urban flood using geo-social intelligence, this
research will quantify the relationship using three stages. Each stage is characterised by an experiment, the results of which are presented and interpreted. This thesis presents the background of the research topic, literature review, research methodology, process of analysis and statistical analysis of results based on these experiments, and a discussion of the outcomes of the research.
Chapter 1. Introduction
1.1 Definitions
This study is located in the domain of geographic information systems (GIS). GIS use “information technology and data to input, structure, manipulate, integrate, analyse, and display information with a geospatial aspect”[1]. In this case, the University of Wollongong PetaJakarta Global Challenge Grant provides the project scope, bringing together multiple rich data sets from several sources, such as social media (i.e. Twitter data), and government reports (e.g. flood detail data). GIS has the primary ability to bring together information and join it to digital imagery which enables spatial analysis. The data in a GIS that is “tagged” to a location is known as spatiotemporal data because it includes both time and space
information.
Take for example, a standard tweet which contains text and optionally one or more hashtags or identifiers within the body of the message. It also contains a time stamp, a date stamp, a location stamp, and possibly a picture or multimedia clip. Geographically locked to a position on the earth’s surface, data can reveal a great deal about context, and even physical changes and human movement changes in short intervals of space and time. A variety of analyses can then be performed on the data, taking the form of traditional statistical analysis (like in any other information system), or spatial analysis that takes advantage of the geographic component embedded in the system. In spatial analysis, “knowledge of a process is used to predict the spatial patterns that might result, and the likelihood of any observed pattern being a result of this process is then established by an analysis of one or more of its realizations” [2].
The significance of this study within the context of the PetaJakarta project is in the use of social media for civic infrastructure management. In this case, it is the use of Twitter data to aid in the improvement of civic infrastructure management for the provision of public services for citizens and the protection of the city from extreme weather events. While there are a variety of social media tools and platforms that give people the ability to create, share or exchange information, text messages, pictures and videos in virtual communities and
networks, Twitter (and tweets) belong to a set of computer-mediated applications known as micro-blogging tools.
These applications allow “users to send short messages to people subscribed to their streams”[3]. Microblogs allow for very succinct text messages to be sent, usually 140
characters in length. Increasingly, citizens are participating and generating content that can be used for analysis, and not all of it is text-based. This is known as Volunteer Geographic Information (VGI) and it is the harnessing of applications and tools to create, assemble and disseminate geographic data that is provided voluntarily by individuals in the community freely [4]. In some ways it can be considered an information flow from the people to the people, where there is stealth in the collection of data analysed in an aggregated fashion. Tomas Holderness describes the outcome of VGI data as geosocial intelligence to aid in decision-making [5]. Increasingly, given the sensor data available on handsets, more and more people are enabling location capabilities, for instance, when tweeting photos or even sending a plain message. These kinds of networks that are increasingly become dependent on the location element are known as location-based social networks (LBSN). For further reading on LBSN, including their social and ethical implications, refer to the work of Fusco
et al. [6] and [7].
1.2 Research Background
Flooding in Jakarta is a problem that endangers human health, damages civic infrastructure and causes substantial economic loss. Social media companies like Twitter are now seeking to harness their data to solve big problems, for instance in the disaster management field. The University of Wollongong was awarded a Twitter Data Grant at the beginning of 2014 as applied to the Jakarta, Indonesian context. This study is a component of the larger research project that can be found at PETAJakarta.org, which primarily focuses on flood disaster management in Jakarta through the use of Twitter.
1.2.1 Jakarta Flooding
Flood management becomes a significant task in every flooding incident due to the destruction that floods can cause in the context of global climate change. The megacity of Jakarta,
Indonesia, with a metropolitan population of more than 20 million and rising, is situated in the western side of Java Island, on the north coast of the island. It faces the jaws of the Ciliwung River, the largest river, which divides the city into its western and eastern principalities.
Figure 1. River and drainage ways through Jakarta, Indonesia.[8]
As is demonstrated by Figure 1, there are 13 rivers flowing through the city, but most of them flow northwards toward the Java Sea [8]. Jakarta’s climate is tropical and rainy, and is the wettest during the monsoon season, experienced October through March annually. Flooding has always been a problem in the rainy season, due to Jakarta’s low topography, climate, congested areas and infrastructure [9]. According to BPBD DKI Jakarta, the emergency management agency of Jakarta, it was estimated that there were more than one million people in the city that suffered from the Great Flood in January 2013. Worse yet, Jakarta residents suffered cascading destructive influences when the civic infrastructure established to cope with the monsoon season partially broke down.
If a one-fold river gate fails, for instance, one of the city’s main streets can be destroyed, as well as civic infrastructure sent into chaos. For example, the main transportation hub was closed and blocked by the flood of 2013. Therefore, the bio-system of the whole city begins to feel the pangs of flooding right from the very first rainfall.
In 2005, UNESCO proposed a larger project for Indonesia in an effort to establish a warning system for its archipelago at an estimated cost of $60 million [10]. The system will act to warn authorities of the flow direction of the water, and levels of flooding by location, making it conducive to flood disaster management. Hence, the government is able to simultaneously control the river gates and pumps using the system so they can visualise and direct the flow of the flood to prevent the highest density population areas from being affected and to best protect important civic infrastructure.
1.2.2 The Role of Social Media
The mobile Internet has changed the way people communicate[11]. Additionally, the introduction of social media has meant that individuals can have global reach with their sentiments, opinions, likes and dislikes. The penetration rates of the mobile Internet have increased substantially over the last 5 years. Social media is interactive and a shared information-based network which makes every individual a potential information source. Micro-blogging is the act of sharing short and timely messages, on a broadcast social media platform. Micro-blogging messages may optionally contain geographic information (e.g. longitude and latitude coordinates) leading to the integration of geographic information systems and social media platforms. The integration of social media and geographic information systems is an emerging concept in the geosocial intelligence space.
Micro-blogging now is not only a way to share social messages, but also to grant power to access the data that can be useful during emergency management situations, such as flooding disasters and earthquakes, because the locational information is of vital importance [5]. Locational information can be embedded within a microblogging message using text (e.g. “Jakarta” string) or it can come embedded using the GPS (Global Positioning Systems) sensor on the device being used to microblog.
In effect, any individual who shares a message with a location on it by using a GPS-enabled smart phone is a sensor themselves during a disaster [12], such as a flood, which can
potentially aid in rescue efforts and providing aid to the target area. When the number of “field” sensors becomes ubiquitous, the distribution and scale of the disaster area can be mapped out and even more specific details shown that would otherwise go undetected. A fundamental example of how GIS can show near real-time information is the Google Maps application that not only provides driving direction solutions and positions in the map but real-time traffic information, by which users can change routes when there is congestion. The traffic information is calculated using Google’s servers and traffic algorithms, but real-time traffic data is provided by innumerable users via GPS-enabled smart phones.
Demonstrated uses of social media making use of geographic sensor data was exemplified during the Arab Spring and the Occupy Movement. These events demonstrated the
importance of how infrastructure could be used to mobilise citizen resources. Applying this kind of systems thinking to disaster management, given the immediacy of a rising flood, can potentially aid in minimising the loss of life and loss of infrastructure [5]. Hurricane Katrina in 2005 more than any other event triggered the use of new techniques for emergency
response. A number of similar case studies have been explored in the emergency management realm and the value of location based services in this realm has been examined [13]. Other notable disaster management events, which made use of social media for the first time in novel ways, were the Queensland Floods[14]. For a given context (i.e. disaster event), all the
information is first established by recreating a network visually, in particular a public social network from which an event map is presented.
Geographic information coming from citizens during a disaster event is extremely effective in providing real-time reporting [5]. This kind of crowdsourcing data being delivered by the people for the people is a new data stream known as “volunteer geographic information” (VGI), described above. Geo-social intelligence is an approach used to manage civic problems such as infrastructure management by using VGI from social media. The current geographic information data-source that is built by governments or formal organizations has its limitations. Hence, it becomes a supplement to existing data-sources that are human- powered sensor networks driven by people via social media.
Twitter is one of the most popular micro-blogging social media platforms. Increasingly it is being used as a powerful crowd-sourced tool supporting research in a variety of different
fields. It is forming one of the largest global networks of intelligent mobile sensors. Even in many slum communities, Twitter is already used to capture geographic information about infrastructure and populations.
1.2.3 PETAJakarta.org
It is well known that Jakarta has the highest density of Twitter users in the world. Jakarta is also the location where the government currently has limited or no information about the performance of its hydraulic and hydrological infrastructure systems in the city during flood events. With the pervasiveness of mobile social media in Jakarta, Twitter data can be applied to offer unparalleled insight into the response of citizens and the city’s infrastructure to extreme flooding events.
PetaJakarta.org (Map Jakarta), by leveraging the timely data from Twitter’s network, is a crowd-sourcing urban data collection project coordinated by the SMART Infrastructure Facility at University of Wollongong, the Jakarta Emergency Management Agency (BPBD DKI Jakarta), and Twitter Inc. The project’s primary aim is to assist and improve the lives of residents in Jakarta. It is a web-based platform on which flooding information for Jakarta residents can be gathered, sorted and displayed in real time by utilizing the power of social media. Twitter is providing a framework where all its data can be collected and disseminated by community members via GPS-enable smart mobile devices.
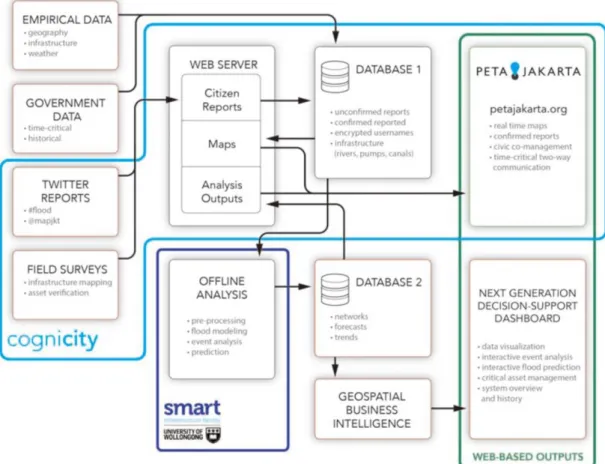
As Figure 2 shows, the entire project PETAJakarta.org contains three parts: CogniCity, Web- based Outputs and Offline analysis. CogniCity is open source software that uses a GeoSocial Intelligence Framework developed by the SMART Infrastructure Facility, University of Wollongong, which allows situational information to be collected and disseminated by community members through their location-enabled mobile devices. It also optimises
infrastructure surveys and asset management for governmental actors. Equipped with scalable mapping technology for mobile devices and a critical alert service, this software enables the communication of two-way time-critical information to and from individuals and government agencies. The platform of PETAJakarta.org runs on CogniCity. The web-based outputs use an information display online platform, which presents the crowdsourced citizen data
publicly for anyone to access. This research is a part of the “Offline Analysis” system, which is retrospective and not time sensitive.
Figure 2. System Diagram for PETA Jakarta.org
1.3 Research Question and Aim
Research question:To understand the full potential of Twitter as a real-time indicator for flooding, this research project in particular to quantify the temporal relationship between tweets related to flooding, and flood events in the city of Jakarta, Indonesia. Principally the project uses a statistical approach to investigate a time series of tweets related to flooding over specific monsoon periods, to determine whether the number of tweets is proportionally relational to the extent of flooding in the city at that point in time. Therefore, in this study, the focus is on the demonstration of the relationship between Twitter activity and flood events using statistical means. Past Twitter data and the real observed flooding events are used as the basis for modelling the urban flooding event in its totality.
Research aim:
The overall aim of the PETAJakarta.org project is to enhance the capacity to understand and promote the resilience of cities to both extreme weather events due to climate change and to long-term infrastructure transformation with the process of climate adaptation. It is hoped that such research can contribute to a wider understanding of the potential of social media to act as a real time crowd-sourcing tool during extreme weather events. The long-term goal of this research is to quantify the utility of social media data during flood events within the context of a civic co-management framework.
1.4 Research Objectives
This research is divided into a series of data experiments that will use statistical tests to examine different aspects of the corpus of Tweet data that was collected.
To advance the comprehensive understanding of the relationship between flood events and Twitter activity in Jakarta, this study will quantify the relationship by addressing a
spatiotemporal comparison of historical tweets with official flood data from the 2012-2013 and 2013-2014 monsoon seasons. The study relies on three stages of enquiry, each of which corresponds to a specific experiment.
As such, there are distinct objectives for each of the three stages:
• Stage 1-Summary Statistics: To provide an overview of the data
• Stage 2-Time Series Plot: To explore the relationship between Twitter activity and
flood events
• Stage 3-Relationship between Twitter activity and Flood events: To test whether
there is a relationship between number of tweets and number of flooded areas over time
The first two stages can be regarded as the pre-processing stages in the processes of analysis and modelling, which are attempting to summate all data and gain a preliminary
understanding of flooding events and Twitter activities beyond the data itself. Stage three seeks to provide a comprehensive analysis of data and relationships between flooding events and Twitter activities.
1.5 Outline of the Thesis
This thesis employs a traditional layout to investigate urban flood modelling using geo-social intelligence. It begins with defining the problem through a thorough literature review of previous work in the interdisciplinary domain of GIS and social media from 2009 until September 2013. Specifically, the literature reviewed concentrates on the adoption of Twitter in broad event detection and emergency management contexts using crowd-sourced civic data to grant organisations the ability to develop preparedness and response strategies. This thesis is an integral component of the larger Cognicity architecture which is now available through the Open Data Institute (ODI). Chapter 3 uses the analysis of previous literature to address the gaps found in methodology, namely the ability to interrogate big data using statistics- from descriptive to correlational analysis. A detailed description of how the experiments were set-up and the software used to manipulate the datasets is included in this chapter as well as the main hypotheses. The expected outputs include tabular and graphical results working at the Twitter-based “Tweet” unit of analysis. Chapter 4, includes a thorough description of the results of the three experiments completed in this project, providing further insights into the relationship between tweets in the urban megacity of Jakarta and urban flooding hotspots during seasonal monsoonal activities. Chapter 5 concludes with the major outcomes and future work.
Chapter 2. Literature Review
2.1 Introduction
2.1.1 Technical Background
The problems of the distribution and acquisition of crowd sourced information have been addressed by emerging technologies. As more and more mobile devices are equipped with GPS sensors, computers and Internet connection with advanced server- and client-side technologies, users can actively participate and be satisfied with these applications and location services. From a distinct perspective, the user is becoming a complex stakeholder given the dual role held as producer and consumer. Prosumers, as they are now known, have an important role to play in society. Web 2.0 has enabled and encouraged citizen-generated reporting useful to problems requiring large-scale coordination. Participation by citizens in once government-only problem solving is a completely new paradigm that has been enabled by emerging technologies. The act is known as “participatory sensing”.
Citizens wishing to engage in contributing vital flood knowledge using Twitter do not require previous expertise. They simply go about their business as usual and may additionally opt to include particular hashtags that are encouraged for ease of near real-time data mining. Goodchild, in 2007, named this practice as “Citizens as Sensors”, where Volunteered Geographic Information is created, gathered, and spread by those individuals or groups who can use Web 2.0 [4].
The interactive networked and shared model of “People as Sensors” information is supplied for free and entirely voluntary. Haklay calls this new social web mapping application the evolution of the Geo-Web [15].
Social Networks are an important part of this development, combining new information with communication tools and applications, attracting hundreds of millions of users. Boyd and Ellison point to the term Social Network Sites (SNS), on behalf of individuals who construct an online profile communicating with other users, in order to share their common ideas, activities, events interests and backgrounds [16]. Furthermore, Location Based Social Networks improve existing social networks, adding space with location services (for more information, see [7] and [6]). For example, users upload geo-tagged photographs from Flickr,
checking in by a venue with Foursquare or commenting on a local event on Twitter. These are all digital touchpoints that leave behind digital traces. Geo-information drawn from the Location Based Social Network is included under the umbrella of volunteered geographic information, although sometimes users themselves do not realise they are leaving behind these breadcrumbs.
However, Harvey argues that a preferable term would be “contributed” data, since people do not consciously volunteer their data, but use the platforms to generate it for their particular purpose [17]. When data generated for one purpose is used for another purpose, no matter how honourable the aim, there are privacy and ethical implications that come to the fore. While outside the scope of this project, the utilitarian approach has been espoused here- for the sake of the common good this data can help aid Jakarta’s securitization.
As for Twitter, users can publish short status messages with at most 140 characters and may attach photos and videos. The act of sending a message using Twitter is known as “tweeting”. These status updates may contain syntax such as hashtags, which can refer to a key word or jargon relevant to the given topic the users are discussing or commenting about. Users have the option of “following” other users, or being “followed” themselves. One can tweet or retweet or even favourite someone else’s tweets. Additionally, one user can send direct messages to another, and any user can search the entire corpus of tweets for specific information.
According to Twitter, an average of 500 million tweets is being generated per day among about 270 million monthly active users. With the permission of the user, each tweet requires geo-location information from the GPS sensor within users’ devices. These location
structures allow users to exchange details of their location as an important interaction via the Internet. Location Based Social Networks connect our physical world and network services containing three layers of information: user layer, location layer and content layer [18]. Therefore, a status update which users publish using Twitter represents a spacing signal in a semantic information layer. After registration in Twitter, all tweets can be recorded in real- time through the streaming API. The Twitter API prompts for allowance filtering of selected tweets or a choice to access only those tweets obtained by geo-referenced Twitter messages in a bounding box. From this spatiotemporal information layer, we can see that a byproduct of individual social interaction may drive research in spacing structures. In the last five years,
there has been an increase in papers addressing location based social networking. The
following literature review looks to identify previous works that are relevant to this project in application, aim and method.
It will be particularly interesting to view the emergence of the use of Twitter for research purposes, and specifically disaster management, in this case flooding. It is important to note, given the nature of this project, that the review will draw on interdisciplinary work.
2.1.2 Existing Literature Reviews
Given the nature of this research, this literature review was focused on searching in the following journals: International Journal of Geographic Information Science, International Journal of Remote Sensing, Photogrammetric Engineering Remote Sensing, Computers and Geosciences, Transactions in GIS and Geo-Informatics. Only the top-ranking GIS journals were selected for the literature review. Interestingly, besides literature surveys and basic non-systematic reviews, no journal articles were found conducting a systematic literature review.
This primary observation emphasises the need of further research that focusses on
systematically reviewing literature in the geographic information science (GIScience) domain. Related to this field of study, Horita, et al. estimated the actuality of search for a conference paper that analyses VGI for disaster management and applied a systematic literature review, including a screening process of important electronic databases [19]. Roick & Heuser offered a general review of current research on Location Based Social Networks which was not systematically conducted. However, they pointed out the need of further studies that
investigate how social networks can be applied to special use cases [20]. Blaschke & Eisank also conducted a non-systematic keyword based literature search, which compared the “GIS” and “GIScience” and their total number of citations over time [21]. However, existing
literature reviews of GIScience have been performed in a non-systematic manner, lacking any descriptive statistics of the field at large.
2.2 Review method
This review will follow the guidelines given by Kitchenham & Keele in 2007 for conducting a literature review, dividing the research into three main sections[22]:
1. Planning the review,
2. Conducting the review by electronic databases, and 3. Reporting on the final results.
The flowchart review model in Figure 3 presents the adopted workflow approach. The following paragraphs and sections are divided according to the review process shown in Figure 3.
Papers online Databases
Search by Keywords
Review method Quantitative Review
Concept
Qualitative Review
Analysis
Review Results
The detailed review method steps are shown in the shaded box in Figure 3. For identifying primary studies presenting detailed state of the art research, a clear research question was established, followed by the selection of eligible literature sources by:
- Choosing journal, workshop and conference proceedings published between 2005 and September 2013 in English (this is consistent with the time in which the study was conducted).
- Choosing multiple digital libraries related to information identified by Brereton et al. in 2007 and more with GIScience relevant digital libraries [23].
The databases used for searching relied on defining a set of keywords and searching all published papers before thirty-first of September 2014. To ensure that there was limited bias, a test review with preliminary trial searches was carried out using defined search strings for the data extraction process. Initially, 288 papers were found, while 92 were finally used in the literature review. It should be noted that duplicate “hits” were found between various
electronic databases. Ultimately, during the paper screening process, 42 papers were chosen in order to demonstrate the linkages between the formulated research questions. 15 of these final 42 chosen papers did not address their methodological approach in analysing Twitter- based data.
2.3 Review Results
The number of papers related to Twitter specific examples increased substantially in the review period. Between 2009 and 2012 the quantity of published papers that directly referenced Twitter as a microblogging engine as applied to organizational preparedness increased from 27 to 84.
2.3.1 Methods Used to Analyse Data from Twitter
A deeper examination of how Twitter was utilized within the selected review papers indicates how the social media application was utilized by organisations. The methods demonstrate that Twitter data was utilized as a data input. About a third of papers utilized all the
information layers including the Tweet message, the geo-tag and the timestamp. These papers were mainly about spatiotemporal and semantic analyses. About a tenth of papers focused on researching spatiotemporal in Twitter but did not include any form of semantic analysis.
More than half of the paper did not address spatial information requirements but only considered the semantic information of the tweet itself. They analyzed the content of tweets and constructed a semantic network to get more non-spatial posts with geographic
information to deduce people’s location. Among these papers, 4 papers only analyzed the Twitter posts to get location and mark landmarks from textual information. Besides, one paper [24] deeply analyzed semantic tweet frequencies to distribute and locate non-geo- tagged tweets to those with a geographical reference. About 10 papers added some analysis of follower and following activities of Twitter users, and 5 papers added a label and 2 papers included a URL analysis. Metadata that describes users and their personal information was found to be a key outcome of conducting a Tweet metadata analysis. This user-centric focus was applied within 6 of the reviewed papers, includes the analysis of Twitter profiles
metadata and tweet posts as well as social relationships, for the prediction of user locations and the clustering of similar users.
25
20
15 Spa-otemporal & Seman-c
10 Spa-al Seman-c 5 0 2006 2008 2009 2010 2011 2012 2013
Figure 4. Paper counts per year
Most reviewed papers between 2006 and 2011 conducted research on Twitter by using non- spatial information to study the temporal evolution of information in Twitter, as shown in Figure 4. At the same time, only one reviewed paper in 2009 focused on researching Twitter data with spatial information. Therefore, the number of reviewed papers that made use of spatial information peaked in 2012 with a steady increase in proceeding years. As the number
of papers focusing on spatial aspects of Twitter data increase, the number of reviewed papers researching spatiotemporal and information grew also. There are a number of reasons for this, including the fact that many smartphone apps now have the location feature enabled by default.
Classified Papers according to methods
Applica-on System Architecture Method40% 40%
20%
Figure 5. Classified Papers according to applied methods
We can see from Figure 5 that 40% of the articles reviewed had a significant technical component which focused on investigating and developing methods of exploring, extracting, validating and aggregating Twitter data. One fifth of the review articles went further,
providing a conceptual model which could be implemented using a system architecture so that researchers could collect and process data from the Twitter streaming API. The rest of the review papers were mainly about the application aspects of Twitter. Looking deep into the applied methods, more than 92% of the 55 papers investigated methods for event detection in Twitter. Those methods and approaches analyzing the social network of Twitter to get
location are also frequent methodological applications. Four of the review papers were working on topic detection and about 11 papers had no specific identifiable method.
2.3.2 Management of Health
Twitter, together with its contents, was identified as a method to estimate market prices for medicine when a flu pandemic happened [24]. Sofean & Smith, in 2012, hold the view that disease reports from this social media tool formulate an ontology of medical terms classified by SVM standards [25]. In addition, keywords from tweets were consolidated and utilised to handle semantic similarities and spatiotemporal events during the dengue fever in Brazil [26]. What is more, Lampos & Cristianini in 2010 conducted a mathematical study in UK to seek several inner relationships between Twitter posts and real world disease reports through a correlation regression assumption [27].
2.3.3 Monitoring of Traffic
Without a doubt, tweet information could be adopted to manage the operation of the traffic systems. In order to match traffic conditions from Twitter about road networks in Thailand, online content was found to be valuable in determining the spatiotemporal traffic-related information with the support of NLP and keyword filtering method [27]. Through the usage of gazetteer, Gerais et al. in 2012 conducted research, detection and locating for traffic incidents with Twitter [28]. Sakaki & Matsuo in 2012 also operated an investigation in Japan with additional classifications of driving data from the social media to achieve whether close connection exists [29]. Similarly, with the help of NLP, traffic-related information could be gathered from Twitter and finally be applied to judge the plausibility of events [30]. It is clear that research in this field is focussed on mining typical or characteristic motion patterns from a single user or collection of Twitter users.
Wakamiya & Lee, in 2012, extracted Japanese driving data from tweets by spatial partition methods such as administrative parts or a grid cluster [31]. Similarly, Ferrari et al. in 2011, together with Fuchs et al in 2013, extracted urban patterns in the USA by spatiotemporally investigating Twitter and its user activities [32]. Yuan et al. also developed a program to analyse location and user activity on Twitter for forecasting mobility patterns. Sadilek et al. mined data of spatiotemporal behaviour curves regarding Twitter users [33]. Furthermore, in 2013, Andrienko used Twitter data to assemble, classify and analyse spatial distribution, in order to determine spatial behaviours [34].
2.3.4 Making Inferences Using Location
Location inference refers to the procedure of retrieving and mining location-related information from Twitter, with not only metadata, but also the simple tweet contents. To attain sufficient geo-location and geo-referenced tweets, Gerais et al. in 2012 deduced locations through user profiles and their net friends, while Finin et al. constructed a named- entity recognition program on Twitter by establishing a sourced natural language processing, based on a language-based mode identified by Kinsella et al. in 2011 [28, 35]. Hecht et al. in 2011 estimated the semantic geo-referencing method based on user content derived from Twitter, by comparing term frequencies with Naive Bayesian Classifier [36].
Kulshrestha & Gummadi determined user geo-location through analysing user origin and Twitter population. Li et al. tried several other approaches such as a ranking method for concluding POI tags on tweets in 2012. GPS and related devices are also adopted to indirectly evaluate the geo-location from Twitter contents [37]. In addition, Gonzalez & Chen, together with Hiruta, et al. in 2012, utilised profile location and semantic classified tweets to create a site inference system [38]. Concentrating on a Twitter data analysis, Watanabe et al. in 2011 developed rules so that computers could automatically tag non geo-referenced Twitter data for local events with actual location [24]. Furthermore, Dalvi et al. in 2012 identified the geographic information of Twitter users through connecting indirect spatial data to real world spatial objects [38].
2.3.5 Social Network Analysis
Social network analysis focuses on features of users within a network and their operational behaviours. Recent scholarship concentrates on content information from Twitter posts. Based on the linguistic test on Twitter, led by Hong et al., researchers identified that 51% of Twitter tweets are written in English. In addition, after the adoption of the LDA model, based on several linguistic characters, experts concluded how political and ethnicity issues, together with some affinity aspects, influence the unique activity of each Twitter user [39]. Wu et al (2011) also point out that the affinity of users for diversified events can be differentiated due to their characteristic lifespan.
Similarly, Takhteyev et al. applied several algebra techniques and flight information to investigate the relationship between particular spoken languages and the social ties of Twitter users [40]. Through research on user tweet and re-tweet behaviours, experts have conducted studies on the perceptions of individuals with respect to particular social topics [41]. Weng et al. conducted a study on the impact of diversified users on calculating and ranking topic similarities, based on LDA and the relationship structure [42]. With the research conducted by Krishnamurthy & Arlitt in 2006 and Yardi & Boyd in 2010 [43], it has been concluded that distinct groups of Twitter users behave in a specific manner based on their usual social
network conversations. What is more, Cranshaw et al. evaluated Foursquare data from Twitter, with a spectral clustering algorithm, and found that characteristic neighbourhoods exhibit their own spatial and social proximities.
Sentiment and emotion investigation on Twitter is another breakthrough point whereby researchers conducted an analysis of social network and computational linguistics. For instance, Maximum Entropy machine learning technologies [44]. In addition, Wang et al. adopted a system to conduct real-time Twitter Sentiment Research during the US election. Therefore, mining emotional vocabularies could be used as an alternative method to determine the relationship between sentiments, topics and social ties [45].
2.4 Discussion
2.4.1 Synthesis of Relevant Literature
Before conducting the literature review, it was evident that the growth of publications
concerning Twitter between 2005 and 2013 was significant. In fact, it is obvious that attention from users to Twitter has increased, so too has the attention that Twitter has received from researchers. There is a multiplicity of reasons for this, including the movement toward
crowdsourcing government and non-government open data, and harnessing big data strategies toward environmental sustainability, citizen science initiatives, and advancing humanity for good strategies. During 2005 and 2010, ACM was the electronic database where most studies reviewed were published. However, after 2010, there were publications about Twitter from a variety of publication outlets. As a result, related investigations have widely spread due to the difference of target audiences of each electronic database. Since the review was conducted,
the number of publications has grown exponentially, indicating the importance of social media toward solving big societal problems. Increasingly, the lower cost of sensors within an Internet of Things infrastructure, also has had a major impact on the way that Twitter might well be used in the future to generate data, machine-to-machine.
A large number of studies were focused on spatiotemporal Twitter analysis (43%) that described the collection and handling of textual data sources from tweets through keyword filtering. It is clear that limitations exist because those studies were focussed on the
uncertainty and sparseness of the data, which made it difficult in validating and comparing reference data. What is more, the Twitter API query also negatively influenced the number of tweet posts.
Location Based Social Networks and Twitter derived from the field of computer and
information sciences, and interestingly, the dominant topic of academic journals was Twitter from 2005 to 2011. However, these studies demanded new categorisation to be incorporated into the review of literature beyond the central theme of the thesis. This involved the
integration of dimensions or disciplines such as earth-geoscience and social science.
Currently, consumers are more likely to exchange location information on a mobile device or platform equipped with GPS capabilities, which could underpin the penetration effects and usage of social network. This in effect results in the development of the geoscience field, whereby the goal is to utilise “Citizens as Sensors” for forecasting when and where a natural catastrophe happens [4]. As a result, adopting spatiotemporal information from location based social networks, like Twitter, creates many research opportunities in the field of GIScience. Table 1 provides a summary of the results of reviewed studies, presented in chronological order. Geo-referenced data from Twitter offers accurate location information that can be used in many ways. High spatiotemporal reliability is valuable in many disaster and emergency management situations, such for real-time detection and analysis of earthquakes. In addition, the information can also be used for disease and health management.
For instance, these data can indicate the spatiotemporal contagion situation of illnesses, compared with the official data. Given the up-to-date, cheap, often free and potentially widespread nature of the information, companies are also able to develop spatiotemporal solutions for their particular benefits. An example would be early-warning systems,
delivering spatial and real-time information regarding issues that may affect the business operation. The data is also beneficial to monitoring of traffic and human mobility, whereby the can be adopted to achieve rapid reactions and better managerial outcomes.
Date Authors Research Method Research Overview
2009 Longueville &
Smith
Geographic-feature- based extraction from tweets with keywords to land mark
Spatiotemporal Tweets accurate to real world event include indirect geographical information
and URLs tend to media
2010 Lee & Sumiya Central Points of K-
means cluster used to form voronoi
diagrams
2010 Lamps & Cristinini Matching geo-
referenced tweets within 10km radius, n-gram textual analysis
2010 Sakaki et al. Using SVM to
classify tweet
locations into text by Kalman filtering
2011 Maceachren et al. Filter aggregated grid
based number of geo- referenced tweets with a set keywords
2011 Earle et al. To detect spatial
outliers by tweet frequency analysis filtered with spatiotemporal
Unusual crowd activities
assuming abnormal events, such as earthquake, have been
detected by observing
geographic regularities within defined regions. (Case study on Japan)
Significant correlation at 95% between the flu epidemic related tweets with the official health report. (Case study on UK)
Estimation of the earthquake location and typhon track by tweets is possible.
Approach was able to extract and validate locations of tweets during an earthquake event
It is to compare worldwide with Twitter data with official
geological surveys on
earthquake detections. There are only 48 earthquakes have been
Date Authors Research Method Research Overview
keyword detected within Twitter in 5175 earthquakes with the average 2 minutes detection delay.
2011 Stefanidis et al. Spatial hotspot
detection
2011 Veloso & Ferraz Filter tweets with a set
of keywords
Geopolitical events (e.g. riots) and hotspots of other crises have been detected and information dissemination within Twitter studied to
improve the situation awareness and emergency response. Strong correlation (at 95%) between spatiotemporal
distribution of tweets related to dengue fever cases and official statistics(case study in Brazil).
2011 Wanichayapong et
al.
Geocoding of geo- referenced tweets to road related attributes, Tweets have been filter with a set of keywords
Point and link based traffic incidents from Twitter have been classified into road segments with 93% accuracy and on points with 76% accuracy.
2011 Li et al. POI matching and
ranking method
2012 Terpstra Mapping of geo-
referenced tweets which have been filtered with a set of keywords
The developed ranking method predicted the POI tag of tweets bases on textual information and time (case study in Chicago).
Extract event information for storm and demonstrate the insights for improving disaster management and relief (case study festival in Belgium).
Date Authors Research Method Research Overview decomposition of
LDA semantic topic modelled tweets to detect abnormal spatiotemporal pattern
2012 Kling et al. Spectral clustering
and geographical heat maps of LDA
semantic topic modelled tweets
2012 Boettcher & Lee Keyword frequency
analysis of DBSCAN clustered tweets
2012 Lee & Hwang Text based grouping
method correlating geo-referenced tweet with user set profile location
been detected by using location information and textual
information
Temporal patterns and functions of urban areas have been
detected
There is 68% precision of events’ been detected by estimating the average tweet frequency of keywords per day in and around a potential even area
Correlation of user profile locations and geo-referenced tweets showed that more than half of all tweets are posted in the user’s hometown. 30 % of Twitter user did not have any posts near their set profile location.
2012 Hiruta, et al. Classification of geo-
referenced tweets called Place-triggered geo-referenced Tweets. Tweets have been filtered with a
Tweets have been successfully classified into type of places (whereabouts of people, food, weather, back at home, and earthquake). Detection of place triggered geo-referenced tweets
Date Authors Research Method Research Overview set of keywords had 82% accuracy.
2012 Dalvi et al. Probabilistic Distance
based model with parameter inference using EM algorithm. Tweets have been filtered with a set of keywords
Language and distance based model was able to infer and match tweets with a real objects geographic location (example POI restaurants)
2012 Cranshaw et al. Spectral clustering of
geo-referenced check- ins posted through Twitter. Activity have been classified
according to check-in venue categories
Social media check-ins and qualitative interviews revealed collective social behavior of people differentiating a city into “Livehoods” which correspond to municipal boundaries (case study in Pittsburg of USA) Table 1. Study overview of papers on spatiotemporal Twitter analyses
Nowadays, it is obvious that experts can extract, mine and even forecast users’ locations information by using Twitter data. As a result, academics could use this data to conduct detection and other managerial tasks through information from Twitter and other metadata. However, Twitter data is mostly used in the United States. For example, although Brazil has one of the highest use-density of Twitter, related data are only adopted for two fields. Nowadays, most studies do not pay attention to the quantitative geographical spread of Twitter information, so that it may make it difficult in achieving other outcomes in other research fields.
One of the major uses of tweet information is in disaster management, and most studies are focused on the field of earth-geosciences to deal with emergent disaster monitoring. Since several studies have started to focus on event detection, new applications have benefited from
the related theoretical contributions and analysis, especially in fields with limited availabilities of sufficient official data.
2.4.2 Gaps & Limitations in Past Research
Concentrating on current related research, one significant research gap in the GIScience domain is the limited utilisation of common methods, such as spatial data mining technology, when experts want to adjust to recent data sorts such as uncertain and sparse geo-referenced social media feeds. Although the use of density based spatial clustering techniques and point based observations, two clustering methods benefit studies. The uncertainty of data, dynamic and diversified point densities and geographic scale effects, still do harm to the measurement of parameter value for distance. As a result, the procedures in the studies reviewed could not completely be incorporated into the real world of geographical-based datasets [46]. However, great potential still exists in mining and processing data from Twitter information for
improvement.
A little less than half of the papers were focused on event detection, and only one fifth of the reviewed investigation formulated several system architectures or some potential service applications. The PetaJakarta project differs substantially from these studies because it allows data to flow through Cognicity with an end point for data visualisation and immediate
application toward emergency preparedness and response. This fresh analysis method, which can spatiotemporally mine data from social networks like Twitter in near real-time, is
destined to open a new door for researchers in a variety of disciplines.
It is clear that keyword-filtering in microblogs are widely used as more than three quarters of the research reviewed extracted spatiotemporal information from Twitter in this way. In addition, the increasing adoption of computer linguistic approaches to deduce textual messages from Twitter, together with associated spatiotemporal analysis, is presently an emerging field which is currently still lacking real-world implementation beyond small scoped/scaled studies. It is one thing to extract 500 hashtags in a small geographic location about a flood, and another to get more than a hundred thousand tweets for a monsoon from a dense urban area (e.g. #banjir) in the span of a weekend. Due to the wide application of semantic data from tweets, one is able to link theoretical studies to practical analysis of semantic and spatiotemporal information. It is true that the primary adoption of those textual
data, such as user profile, follower and following information, is for investigation of their social networking and research about user emotions, but related data layers must not be ignored. Experts who focus on those investigations could benefit from the utilization of spatial data sources of geo-tagged Twitter messages. What is more, several researches also conduct programs to trace how information of events spreads and transforms social networks by investigating associated website links. There is no doubt that the technology and theories could be useful to manage lots of events or incidents, like illness, catastrophe and business development.
In conclusion, GIScience and its effects seemed to have been limited until September 2013, especially in the analysis of spatial methods. One of the major issues is that only 7% of the papers reviewed were conducted by researchers with a geoscience background but in the last few years especially, there has been a significant shift in researcher skillset to see the
integration of GIScience and IT/social media expertise. Although the application of Twitter information to determine location is studied by many researchers, the lack of GIScience qualifications has created a research gap. In summary, four main limitations of current research are identified in this GIScience study:
- Firstly, there are a limited number of traditional approaches or techniques to spatially handle and deal with information from location-based social networks due to its uncertainty.
- Secondly, experts currently could only marginally investigate the geographic scale effects of information source from tweets.
- Thirdly, most reviewed research on the spatiotemporal analysis of information from Twitter only uses one or two methods. As a result, limited combined effects were shown or found from recent studies.
- Forth, limited research has been conducted to find methods to upgrade data mining filtering perspectives for information from Twitter.
Besides the angle of GIScience, current researches also own limitations due to their use of several terms that could be unclear or have heterogeneous understanding in diversified academic areas. In addition, some researchers arbitrarily decided the keywords of their studies of spatiotemporal analysis of Twitter data so that several different vocabularies are used as keywords, which added to the complexities of the literature review [47].
2.5 Conclusion
With the support from current academic sources, a systematic literature review was conducted in reviewing present scholarship, related theories and methodologies pertaining to the use of information from Twitter to conduct spatiotemporal processes, such as event detection. To complete this review, a large amount of diversified online libraries and databases were searched, in order to achieve a large and sufficient amount of relevant academic information. To avoid the negative effects of bias during the research, an iterative keyword searching method was adopted. In addition, with the support of both quantitative and qualitative review approaches, the searching process reduced the proportion of papers
that were not checked. With the systematic literature review, investigations of Twitter, from a new angle, as a location-based social network with statistically-based analysis could be performed. What is more, new doors for the investigation in the field of GIScience were opened by researchers who combined GIS with location-based social networks. Without a doubt, with the methods offered by GIScience, the spatiotemporal extraction and analysis of real-time social-media information, such as data from Twitter, could be much more
Chapter 3. Methodology
3.1 Introduction
This chapter uses the gap found from the literature review in chapter 2, and addresses the need for conducting an experiment with social media data for civic co-management strategies towards the PetaJakarta Twitter Grant project. A deficiency was found in literature published prior to September 2013, whereby a lack of integration between GIS and social media existed, as well as scant techniques on approached to analysing the linkage between location information in microblogging content and related metadata. This thesis attempts to
demonstrate the importance of geosocial intelligence toward urban flood modelling and management, specifically in Jakarta. This chapter sets out the chosen approach to modelling crowdsourced data to prove in the strong relationship between the social media posts by everyday citizens as per identified flood zones. The chapter includes a research strategy, the data sets available for the study and how they were extracted, the systems configuration for the study, the actual experiments conducted in the thesis, and the manner in which data analysis is to be conducted.
3.2 Research Strategy
This research employs the quantitative approach to research, using statistical, mathematical and computational techniques. Quantitative data is any data that is in numerical form such as statistics and percentages. The objective of the quantitative method, in this instance, is to develop and utilise mathematical models, theories and hypotheses pertaining to the phenomena in question: Jakarta Flooding events. Twitter data (from tweets) containing semantic and spatiotemporal information was gathered, filtered and settled, after which the data was analysed statistically. Given that this research is focused on models of urban flooding and flood management, the quantitative technique is ideal in that it provides the fundamental connection between empirical observation and mathematical expression of quantitative relationships.
![Figure 1. River and drainage ways through Jakarta, Indonesia.[8]](https://thumb-us.123doks.com/thumbv2/123dok_us/11063078.2992972/14.892.113.785.134.1065/figure-river-drainage-ways-jakarta-indonesia.webp)