DigitalCommons@University of Nebraska - Lincoln
DigitalCommons@University of Nebraska - Lincoln
Computer Science and Engineering: Theses,Dissertations, and Student Research Computer Science and Engineering, Department of
11-2019
View-Dependent Data Prefetching for Interactive Visualization of
View-Dependent Data Prefetching for Interactive Visualization of
Large-Scale 3D Scientific Data
Large-Scale 3D Scientific Data
Jin Wang
University of Nebraska-Lincoln, [email protected]
Follow this and additional works at: https://digitalcommons.unl.edu/computerscidiss Part of the Computer Sciences Commons
Wang, Jin, "View-Dependent Data Prefetching for Interactive Visualization of Large-Scale 3D Scientific Data" (2019). Computer Science and Engineering: Theses, Dissertations, and Student Research. 183. https://digitalcommons.unl.edu/computerscidiss/183
This Article is brought to you for free and open access by the Computer Science and Engineering, Department of at DigitalCommons@University of Nebraska - Lincoln. It has been accepted for inclusion in Computer Science and Engineering: Theses, Dissertations, and Student Research by an authorized administrator of
A THESIS
Presented to the Faculty of
The Graduate College at the University of Nebraska In Partial Fulfilment of Requirements
For the Degree of Master of Science
Major: Computer Science
Under the Supervision of Professor Hongfeng Yu
Lincoln, Nebraska November, 2019
of Large-Scale 3D Scientific Data
Jin Wang, M.S. University of Nebraska, 2019 Adviser: Hongfeng Yu
One of the most significant challenges for today’s interactive visualization is the efficient analysis and visualization of large-scale data, and I/O becomes a significant performance bottleneck. This thesis proposes a new data management policy to support interactive large-scale visual analytics. Our method can characterize user’s data access patterns ac-cording to their data-dependent and view-dependent visualization operations, and lever-age application knowledge to derive a novel scheme to predict data access during the inter-active operations. Based on the prediction results, we develop a data replacement policy to exploit data locality and minimize data movement across multiple levels of a memory hierarchy. We evaluated our approach on machines with multiple hierarchical memory levels and compared it with state-of-the-art data replacement methods to demonstrate the effectiveness of our approach.
ACKNOWLEDGMENTS
Firstly, I would like to express my sincere gratitude to my advisor Prof. Hongfeng Yu for the continuous support of my master’s study and related research for his patience, moti-vation, and immense knowledge. His guidance has helped me in all the time of research and writing of this thesis. I could not have imagined having a better advisor and mentor for my master’s study.
Besides my advisor, I would like to thank the rest of my thesis committee: Prof. Ashok Samal, and Prof. Zhenghong Tang, for their insightful comments and encouragement, but also for the hard questions which incented me to widen my research from various perspectives.
I thank my fellow labmates for the stimulating discussions, the sleepless nights we were working together before deadlines, and the fun we have had in the last years.
Finally, I must express my very profound gratitude to my parents and to my spouse for providing me with unfailing support and continuous encouragement throughout my years of study and through the process of researching and writing this thesis. This accom-plishment would not have been possible without them. Thank you.
Contents
List of Figures vii
List of Tables viii
1: Introduction 1
2: Background and Related Work 3
2.1 Interactive Scientific Visualization . . . 3
2.2 Out-of-Core Algorithms . . . 4
2.3 Cache Algorithms . . . 5
3: Approach 7 3.1 Static Prefetching . . . 10
3.2 Dynamic Prefetching . . . 11
3.3 Droplet Shaped Prefetching . . . 15
4: Results and Discussion 18 4.1 Dataset and Environment . . . 18
4.2 User Study . . . 19
4.3 Parameter Choices . . . 20
4.3.1 The Number of Exiting Points . . . 20
4.3.3 The Radius of Prefetching Area . . . 22
4.4 Accuracy of Prediction Engine . . . 23
4.5 I/O Latency . . . 27
5: Conclusion and Future Work 29
List of Figures
2.1 A scientific visualization example on combustion dataset . . . 4
3.1 A combustion volume dataset with four resolution levels . . . 8
3.2 Static prefetching by predicting visible blocks with respect to the current cam-era position.. . . 10
3.3 Structure of LSTM neural network cell . . . 12
3.4 An example of the discontinuity in Polar coordinate system . . . 14
3.5 An example of camera path prediction . . . 15
3.6 Prefetching process flow diagram . . . 16
3.7 The shape of prefetched sampling points . . . 17
4.1 The accuracy of LSTM and SVR . . . 21
4.2 The Accuracy with DifferentkValues . . . 22
4.3 The end-to-end response time with differentrvalues . . . 24
4.4 The evaluation of miss ratio . . . 25
4.5 Visualization of user’s trajectories . . . 26
List of Tables
4.1 Details of the resolutions at each level . . . 19
Chapter 1
Introduction
Researchers have developed many sophisticated visualization techniques. However, it re-mains a challenging task to apply these techniques to large-scale applications efficiently and effectively. Given that the breakthroughs in scientific technology have led to massive growth in the amount of data generated every day, one frequent problem users often en-counter today is that the data is too large to load into memory, which makes it impossible to render all the data. The lagging of the I/O speed becomes one of the major performance bottlenecks for large-scale interactive visualization when considering the transferring of such extensive data across multiple memory hierarchies. Besides, as different users may have different explorations, data access patterns can vary significantly among different users, thereby exacerbating the complexity of data movement across memory hierarchies for visualization operations.
Many system techniques have been developed to make data movement more effi-ciently.1 However, most of them can hardly achieve optimal performance for
visualiza-tion because they attempted to obtain a more general soluvisualiza-tion without considering the specific application behaviors. Some of the efforts tried to optimize the data transferring across different hierarchies by incorporating domain knowledge, but mainly focused on relatively more uncomplicated data operations instead of the complex data explorations
from real-world visualization applications.
In this thesis, a new approach is presented to address the issues and support interac-tive large-scale 3D visualization. Our method first characterizes user’s data access pat-terns according to their data-dependent and view-dependent visualization operations, and then leverage application knowledge to derive a novel scheme to predict data access during the interactive actions. Based on the prediction results, a data prefetching tech-nique is developed to exploit data locality and minimize the data movement across multi-ple levels of a memory hierarchy for 3D visualization.
Our approach is evaluated with different hierarchical memory levels and compared with state-of-the-art data replacement methods. The experimental results demonstrate the effectiveness of our approach.
Chapter 2
Background and Related Work
2.1
Interactive Scientific Visualization
Interactive scientific visualization operations can be approximately divided into two types: view-dependent operations and data-dependent operations. For view-dependent operations, a user changes the view (or camera), and the content displayed will change ac-cordingly. Such view-dependent operations require a series of visualization processes in a very brief period smoothly to display the camera movement. For a fixed view, users may apply data-dependent operations, such as transfer functions or query-based visualization, that require the computation to control the visual properties of different data.
Figure2.1is an example of a scientific visualization process. Figure2.1(a) and (b) show the images corresponding to a zooming in operation, and Figure2.1(a) and (c) il-lustrate the camera movement images. Both of the operations are view-dependent, which are marked in red. Figure2.1(d) and (e) show images corresponding to data-dependent operations, which are marked in blue and present the change of transfer functions at a fixed view.
Figure 2.1: A scientific visualization example on combustion dataset
2.2
Out-of-Core Algorithms
Optimization of data movement across hierarchical memory levels has been extensively studied for interactive visualization.
For view-dependent operations, a common strategy for improving data movement performance is to build a multi-resolution representation according to views.2When the
camera is far from the object, it is sufficient to load only the low-resolution blocks; when the camera is close to the data area, the data will be rendered at the original resolution. LRU is usually used as the data replacement policy in fast memory because the visible blocks are possibly visible in the next time-step.
For data-dependent operations, researchers also develop different data representa-tions to reduce data and corresponding movement according to different operarepresenta-tions. For example, for ray-guided volume rendering, empty brock skipping is commonly employed under certain transfer functions and sampling rates.3 Isenburg et al.4 implement a new
pro-hierarchy of tetrahedra to spatially partition the model, where each of the tetrahedral cells contains a precomputed simplified version of the original model using cache-coherent indexed strips for fast rendering. Ueng et al.7 build an octree to manage the raw data
to achieve fast data retrieval. The octree can partition and restructure the unstructured tetrahedral meshes so that only a few small amounts of data are required to be loaded into the memory on demand. Sicat et al.8 present a multi-resolution volume representation
using sparse probability density functions (PDFs) of voxel neighborhoods.
Silva et al.2 summarize sophisticated out-of-core algorithms in streamline
compu-tation, isosurface compucompu-tation, and I/O efficient volume rendering. Li et al.9 provides a
survey of data reduction techniques for scientific visualization and data analysis to lower I/O and storage costs.
2.3
Cache Algorithms
Cache replacement and prefetching algorithms can also be used to reduce the I/O cost. Studies on cache algorithms have been investigated comprehensively in Computer Sys-tem to increase the hit ratio under specific working circumstances. Belady10proposes a
classic data replacement algorithm, MIN, that replaces the element whose next reference is the furthest in the future. Since Belady’s MIN can pre-see the future, it is provably op-timal with a high hit ratio and usually used as a competitor in many papers. Even under certain assumptions, Belady’s algorithm is very brilliant and inspiring at that time, but it has some limitations. For example, it applies only one single level of the caching hierarchy where elements must be inserted. Cheng et al.11 mention that read-around writes need
not be inserted into flash as long as persistent writes will be stored on disk. Johnson et al.12 propose the Two Queue (2Q) algorithm to remove cold data blocks quickly. Zhou et
al.13 propose a multi-level cache algorithm, named Multi-Queue (MQ), that takes blocks’
minimal lifetime, priority, and temporal frequency into account so that useful blocks can be stored in the cache as long as possible, which leads to better performance.
Another limitation of MIN is that the overhead is very high because it has to find which block is the furthest when considering long-term reuse. Jain and Lin14introduce
a method that simulates Belady’s MIN algorithm to make a replacement decision based on users’ past behavior to solve this problem. Such decision is a partially optimal result because it only considers part of the data stream. Megiddo et al.15present an online cache
replacement policy, named Adaptive Replacement Cache (ARC), which can dynamically tune itself with low overhead to achieve a partially optimal data movement operation.
These advanced caching algorithms are developed for different specific working cir-cumstances. However, very few of them are fully exploited for highly interactive visualiza-tion. Yu et al.16 present an application-aware data replacement policy for interactive
sci-entific visualization, where they partition a volume data into a set of uniform-size blocks and prefetch the data blocks by predicting user visualization operations. Simple data re-placement policies, such as least recently used (LRU) or first in first out (FIFO), are still commonly used in large-scale visualization systems.3,17
Chapter 3
Approach
This thesis employs the traditional view-dependent multi-resolution data representation and focuses on the cache and prefetching problem concerning the user’s view changes. The data-dependent characteristics (e.g., empty data blocks) are not considered in this study.
A simple multi-resolution representation of a volume dataOis built to improve the
data movement performance. At Level 0, the data has its full resolution, and at Leveli,
the resolutionli = li−1/8. For the volume data at each level, it is partitioned into a set
of blocks, and the size of blockbiis uniform across the level. Figure3.1is an example of
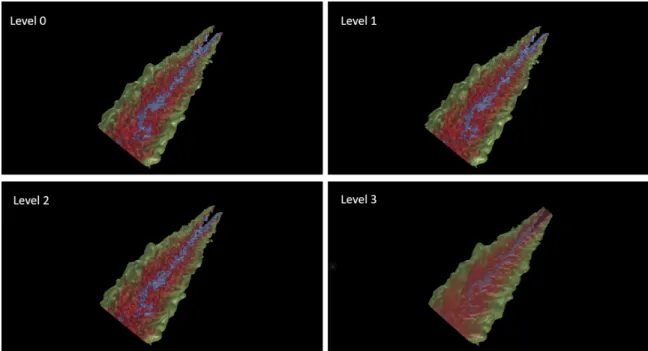
displaying data at different resolutions. Level 0 can convey full details, but require longer data movement and rendering time. As some features can be too small to be noticed in visualization, there may not need to render all blocks at such a high resolution. Instead, it is reasonable to check the distance of each visible block at each camera position in order to load the block at an appropriate resolution into the faster memory so that the data can be rendered faster with displaying enough information. More details can be revealed when the user zooms in with loading and rendering the blocks at higher resolutions.
This part aims to enhance data movement performance by leveraging caching and prefetching algorithms. The basic idea is simple: assume that it is possible to predict user’s
Figure 3.1: A combustion volume dataset with four resolution levels
exploration, one of the most effective ways to minimize data movement is to load the in-coming blocks during the rendering of current blocks. In this way, the rendering time and the data movement time would be overlapped, and thereby the overall rendering perfor-mance would be maximized. The possible perforperfor-mance gain depends on the accuracy of the prediction (i.e., more accurate predictions can decrease cache miss rates and enhance performance, or vice versa). Algorithm1illustrates the framework of our approach.
This thesis first presents a static data prefetching algorithm for the multi-resolution data representation based on Yu et al.16’s work. This static method assumes that the
cam-era will smoothly move because users cannot directly jump to another position in the next time step. Therefore, the next camera position must be nearby. Thus the method will prefetch all the visible blocks from nearby camera positions at each timestep.
Secondly, based on the static method, a dynamic data prefetching algorithm is pro-posed to minimize the data movement by predicting the direction of the user’s motion. The rationale of the dynamic algorithm is that, given a similar data set, the camera move-ment patterns around some specific areas will be similar. For example, when
encoun-Finally, assuming that a user will be most likely to follow the previous direction of view or camera movement, the improved dynamic prefetching method will load more blocks in the predicted direction, and load fewer blocks in the opposite direction.
Compared to the existing approaches, the proposed algorithm can improve the per-formance significantly. It can not only increase the hit ratio of data blocks in the faster memory but also utilize the rendering time to predict the user’s movement and prefetch possible blocks into the cache. The next part will first introduce the overview design of our method and then discuss the data prefetch and replacement strategy and motion predic-tion in detail.
Algorithm 1I/O optimization for large-scale scientific visualization
1: //initializevec_bas empty, wherevec_bis a queue storing the visible blocks. 2: vec_b← ∅
3: foreach camera positionpido
4: foreach blockbido
5: ifbiis visible and at an appropriate resolution based on the camera distancethen
6: vec_b ←bi
7: end if
8: end for
9: for each visible blockbvdo
10: if bvis in the faster memorythen
11: Hit
12: else
13: Miss
14: Loadbvand use it to replace the least recently used block in the faster memory
15: end if
16: end for
17: Render the visible blocks
18: During the rendering, predict the possibly visible blocks in next time step, and
prefetch part of (or all if time permits) them into the faster memory
3.1
Static Prefetching
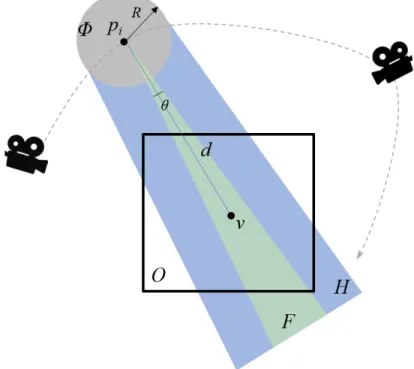
The static approach assumes that the visible data regions between two connective camera positions are very near because the camera usually moves smoothly, and most of the visible areas of two neighbor points are overlapped. As shown in Figure3.2,piis current camera
position. The green region corresponds to the view frustumF ofpi, and the intersection
region between the view frustumF and the volumeO is visible. Givenpi, assume that
the next camera position will likely locate within a sphereΦ. It is possible to compute the
aggregated view frustumH of all points inΦ, as shown in the blue region. Therefore, it
would be possible to predict that the intersection region betweenHandOwill be visible
for the next camera positionpi+1 and prefetch all possibly visible blocks within the blue
region during the rendering atpi.
Figure 3.2: Static prefetching by predicting visible blocks with respect to the current cam-era position.
It is easy to see that the radiusRof the sphereΦplays a vital role. AsRincreases,
whereSizef astandSizeslow represent the cache sizes of fast memory and slow memory
respectively,θdenotes the angle of view frustumF of the camera, anddis the distance
between the current camera positionpiand the volume centerv. Therefore, the optimal
Ris view-dependent.
3.2
Dynamic Prefetching
As mentioned before, it is tough to predict the data access pattern because the exploration of users can nearly randomly form it. However, the user’s (or camera’s) movement is more or less dependent on the data because users would look for interesting spots during the exploration. Based on existing research,18the user’s movement pattern can be divided into
the following phases:
1)Zooming/Moving (a user may not zoom and move at the same time, and usually a
user would move to find the region of interest in the coarse zoom level or keep studying the region of interest at the detailed zoom level);
2)Comparison (a user may move quickly between two or more areas to compare their
characteristics).
Therefore, it is feasible to predict the camera’s motion by knowing its past moving behavior because the user will make a similar or identical decision when facing the same choice again.
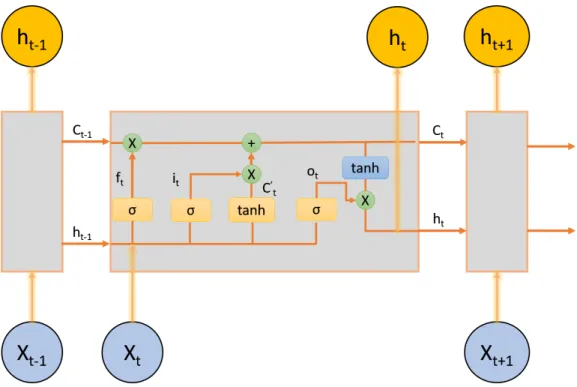
Long short-term memory (LSTM), which can be viewed as a modified Recursive Neu-ral Network (RNN), is well-suited for classifying, processing, and making predictions based on time series data. Compared to traditional RNN, LSTM can fix the vanishing and
Figure 3.3: Structure of LSTM neural network cell
exploding gradient problems in RNN by storing the long-term useful information and for-getting the useless information. Figure3.3 shows the typical structure of LSTM neural network cells. There are three gates in the cell whose weights and biases are independent. These gate modules adjust the amount of previous output to keep, the amount of current input to keep, and the amount of internal state to send out to the output.
a. Forget Gate
ft =σ(Wf ·[ht−1, Xt] +bf), (3.2)
whereftis a sigmoid layer. Ifft = 0, the previous internal state will be totally forgotten;
and ifft= 1, it will be passed through completely.
b. Input Gate
it =σ(Wi·[ht−1, Xt] +bi)
Ct0 =tanh(Wc·[ht−1, Xt] +bc)
Ct =ft∗Ct−1+it∗Ct0
c. Output Gate
Ot =σ(Wo·[ht−1, Xt] +bo)
ht=Ot∗tanh(Ct)
(3.4) This gate controls how much of the internal state will be passed as the output (ht).
The camera’s moving pattern is a set of time-series coordinate points of the camera in 3D space for a period of time, which can be written as P atternt =
{Pt, Pt−1, Pt−2, ..., Pt−k}wherePtrepresents the camera location at a time stept. In the
experiment, this thesis employs LSTM to learn the user moving patterns and forecast the next move. More specifically, we use the last three camera positions to indicate a piece of
P attern, and then pass it into the LSTM neural networks as input, which can be written
asXt = {Pt, Pt−1, Pt−2} → {Pt+1}. Pt,Pt−1, andPt−2represent the last three positions
of the camera, andPt+1denotes the next possible position. Our work collects user’s
trajec-tories during their exploration, and approximately 50,000 points are used as the training data. Therefore, for each time step, the last three points are used as input, and the next point is used as the label to train the model. For example, in the first step, we useP1, P2, andP3 asX1 and useP4 asY1. In the second step, we useX2 = {P2, P3, P4}and Y2 = {P5}, and so on. Similarly, Support Vector Regression(SVR) is also used to predict
the camera motion as the competitor. In our work, Linear Regression is also used to com-pare the prediction accuracy, but its accuracy is not as good as the SVR. Hence, this thesis only presents the SVR result.
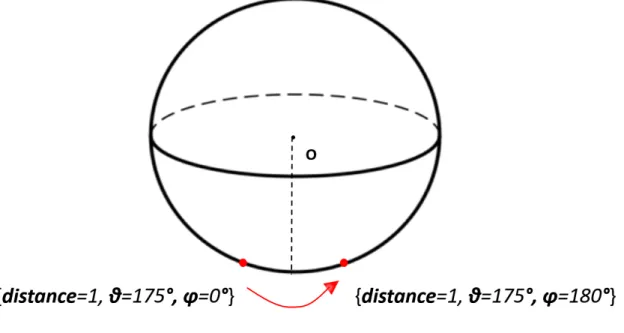
The dynamic approach implements Cartesian coordinate system instead of Polar co-ordinate system when training the model. This is because the characteristic of Polar coor-dinate system makes it harder to recognize the moving pattern. Figure3.4is an example
to explain this. Suppose the current position is{distance= 1, θ= 175, ϕ = 0}as shown
in Figure3.4, and if theθkeeps increasing,ϕwill directly jump to180from0. This
discon-tinuity ofϕleads to a very low accuracy of the prediction. Therefore, Cartesian coordinate
system is employed to avoid this problem.
Figure 3.4: An example of the discontinuity in Polar coordinate system
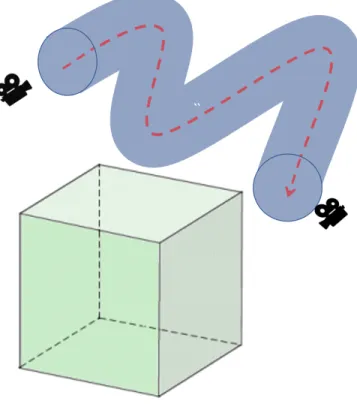
In general, the closer the predicted camera point is to the ground truth, the higher the hit ratio it can achieve. However, if the predicted camera point located in a different resolution interval, the prefetching would not help improve any performance no matter how close it is to the ground truth because the resolution of the prefetched blocks is not correct. In order to solve this problem, the dynamic method learns the moving trajectory as a tube instead of a curve line so that it can prefetch all the possible blocks when near the critical point between two resolution intervals. Figure3.5shows the dynamic Prefetching. Since the goal of this thesis is to reduce the I/O time by increasing the hit ratio when loading data from one level of memory hierarchy to another. The optimal situation is that the prefetching time is completely overlapped and hidden by the rendering time as
tak-Figure 3.5: An example of camera path prediction
ing advantage of the rendering time as much as possible. However, if the prefetching time exceeds the rendering time, it can no longer guarantee the improvement of the per-formance. Therefore, a monitor module is added in the prefetching module to monitor whether the rendering process completes or not. If the rendering process completes, the monitor module will cease the prefetching process and let the program move on. Figure3.6
is the process flow diagram.
3.3
Droplet Shaped Prefetching
In the static method, all the next camera positions are treated equally to load the visible blocks. However, in the real world, users are more likely to follow the previous direction of view or camera movement. In other words, the accuracy of the prediction can be fur-ther improved if prefetching more blocks in that possible direction and prefetching fewer
Figure 3.6: Prefetching process flow diagram
blocks in the opposite direction. To quantify this problem, we useRto represent the
far-thest distance the camera can reach in the previous direction of movement, andrto
indi-cate the distance the camera moves in the opposite direction. We have:
r =k1×R(d), k1 ∈[0.01,1.0] R=k2×R(d), k2 ∈[k1,2.0],
(3.5) wherek1, k2represent the preference of the direction of the camera motion. In our
pre-experiment, we project the user’s trajectory intoX, Y, Z, and run all the values ofkfrom
0,01to2.0. Optimizedk1andk2values can be achieved based on the miss ratio. Thus, in
the prefetching process, we can get thekvalues based on the previous moving direction,
and then all the possibly visible blocks will be loaded into cache. To further describe the shape of these sampling points area, the hit rate (or the reciprocal of the miss rate) is used to indicate the probability of becoming the next camera position. For example, if a 100%
camera locations, and the darker camera icon represents the current camera position. If treating all the nearby points equally, the sampling points look like a sphere. However, based on the preference of the motion, the user is more likely to keep moving to the right with prefetching more blocks from the right side than left. Based on the achieved miss ratio of each sampling point, the shape of the zone looks like a droplet.
Chapter 4
Results and Discussion
The I/O optimization methods are evaluated with different camera paths on the real sim-ulation dataset. Traditional cache algorithms such as LRU and FIFO are used as the base-line, and some advanced caching algorithms, like ARC and MQ, are used as the competi-tors. We also compare our method with Leilani’s18method (ForeCache), which is the
state-of-the-art prefetching algorithm for 2D data.bl_f lame_mixf racis a real combustion data
set consisting of 4-byte floating-point values. Its size is about 6.7 GB and the resolution is
1408×1080×1100.
4.1
Dataset and Environment
The experiments are conducted on a desktop with an 8X Intel Core i7-4820K 3.70GHz CPU and a laptop with Intel Core i7-7700HQ 2.8GHz CPU with three-level memory hierarchy containing 16GB DRAM, a 512GB solid-state drive (SSD), and a 4TB hard disk drive (HDD). Nvidia GTX 980 8GB (desktop) graphics card and Nvidia GTX 1050 4GB (laptop) graphics card are employed to accelerate volume rendering and applied data replacement across these three memory hierarchies. The average rendering time at each timestep is about 0.1 seconds, so this number is used as the rendering time in the result. The ratio of the size between two successive memory is set to 0.5. For example, the cache size on the SSD is
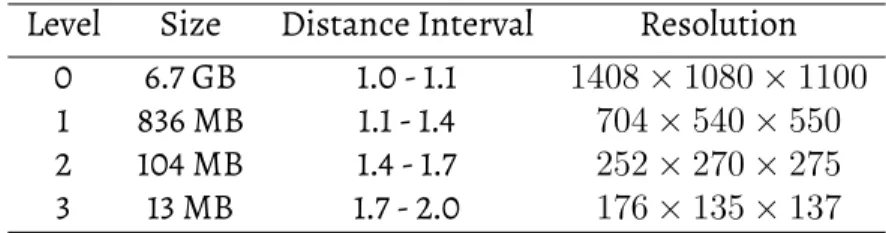
corresponding resolution based on the distance between the camera and the center of the volume. For example, when a block is far away from the camera, it will load its thick block; if the block is very close to the camera, it will load the full-resolution-data. See Table4.1for details of data resolutions at each level.
Table 4.1: Details of the resolutions at each level Level Size Distance Interval Resolution
0 6.7 GB 1.0 - 1.1 1408×1080×1100
1 836 MB 1.1 - 1.4 704×540×550
2 104 MB 1.4 - 1.7 252×270×275
3 13 MB 1.7 - 2.0 176×135×137
4.2
User Study
To ascertain the viability of our method, we worked with real users at the University of Nebraska-Lincoln (UNL) to1)collect user data while they are exploring the provided
dataset; and2)develop a neural network to learn the user’s motion pattern. The study
con-sisted of scientists in computer science, such as graduate students and professors. Before the experiment, all the participants are required to sign the consent document.
All the training and testing data come from real explorations by different partici-pants. Participants are asked to explore the 3D combustion data based on their interests, and the camera trajectory data is collected to train the neural network model. Users can zoom in/out, and move up, down, left, or right in the 3D world. Moreover, to avoid the bias of the participant’s behavior, all the data is kept to train the model. The model can pre-dict the next possible camera position by giving the previous movements. Approximately
50,000 points are collected in the experiment, and 80% of them are used as the training data. 5 participant’s trajectories are visualized to compare with the predicted results.
4.3
Parameter Choices
In this section, we will discuss some critical parameters, such as the number of points used to train the LSTM model, the number of prefetched blocks, and the radius of the prefetching area that most influence the performance of our optimized algorithm. Since this part is hardware-independent, the miss rate is used to evaluate the performance and choose the best parameters. However, the miss rate is not suitable to determine the best radius of the prefetching area because the more extensive the radius is, the more blocks it will prefetch into memory, and thus the lower the miss ratio it can achieve. Nonetheless, that does not help improve the overall performance. Therefore, we use the end-to-end time to evaluate the radius. In the next section, the I/O latency, which is hardware-dependent, will be evaluated by the end-to-end response time among all the candidate methods.
4.3.1
The Number of Exiting Points
The predicted camera position is based on its previous trajectory. In this part, various models are trained with a different number of previous points, and their miss ratios are used to evaluate the accuracy of the prediction. Figure4.1shows the result, where X-axis represents the number of points that used to train the model, and Y-axis corresponds to the average miss ratio of the tests.
From the result, the performance of LSTM does not outperform SVR when the num-ber of training points is less than 3, but the performance of LSTM is better if the numnum-ber of training points is greater than 3. This is because some camera motion patterns need more information for LSTM to learn. In other words, the more training points are used to train the model, the better performance it can achieve. On the other hand, SVR can
de-3, the performance increase of LSTM is not very obvious, but the training time would be significantly lengthened. Hence, we choose to use 3 points to train the LSTM model.
Figure 4.1: The accuracy of LSTM and SVR
4.3.2
The Number of Prefetched Blocks
In this part, we discuss the relevance between the prefetched block number and the perfor-mance. Suppose the number of prefetched blocks isnand the size of the original dataset
isSdata, thenn =k∗Sdata. Since the ratio of size between two successive memory is 0.5,
the maximum value ofkis initially set to be 0.5. Figure4.2shows the miss rate with 5
kis more significant than 0.4, the miss rate will increase accordingly. In most of the tests,
the miss rate is very close whenkis between 0.4 and 0.5, but the average value is slightly
higher whenkis equal to 0.5. Therefore, a greater number of prefetch blocks can result
in a lower miss rate while the rendering process has not completed, and the accuracy of the prediction is guaranteed. However, a lousy prediction is sometimes more expensive than not prefetching the blocks because it loads not only unnecessary blocks into the cache but also evokes potentially visible blocks in the next timestep from the cache. Considering the trade-off between the performance improvement due to a large number of prefetched blocks and the performance loss due to some poor predictions, we eventually setkto 0.4.
Figure 4.2: The Accuracy with DifferentkValues
4.3.3
The Radius of Prefetching Area
In Section3.2, it is possible to train a tube instead of a curve line to prefetch all the pos-sible blocks when near the critical point between two successive resolution intervals. The
critical to performance improvement.
We compare the dynamicrwith some fixed values to study the relationship betweenr
and the end-to-end performance. As can be seen from the Figure4.3, our algorithm works more efficiently when using a dynamic prefetching radius. However, there is not a dis-tinct pattern from the result because the influence ofrto the end-to-end response time
is dependent on the user’s trajectory. If the camera stays at the same resolution hierarchy level, the extra prefetched area will not help improve the performance; otherwise, the best
rmay vary for each specific test case. That is the reason the averaged result of different
trajectories is considered to reveal the relationship betweenrand the end-to-end
perfor-mance. Therefore, it is possible to conclude that the dynamicrmay not guarantee to be
the best for all the circumstances, but overall it is the best choice to improve performance.
4.4
Accuracy of Prediction Engine
The miss ratio comparison result is in Figure4.4. Belady’s MIN is the optimal method that will replace the block whose next reference is the furthest in the future. The miss rate of MIN is the lowest value it can get theoretically without the prefetching process. MQ and 2Q use the frequency to extend the time that the hot blocks exist in the cache. MQ uses an 8-queues-structure in the cache while 2Q uses two queues. ARC maintains some variable-sized LRU queues and continuously updates the size of queues to address the cache re-placement problem. Compared to MQ, ARC can track an evolving workload nimbly with constant-time overhead, but MQ can significantly outperform ARC if the data access
pat-Figure 4.3: The end-to-end response time with differentrvalues
tern is closer to the test; otherwise, the miss rate of ARC is a little bit lower than MQ. In our tests, Leilani’s ForeCache, which trains a model using Markov Chain to predict the user’s future actions, is also tested. Our method gets a lower miss rate than the traditional cache methods because it also prefetches blocks during the rendering process. Moreover, the miss rate of our method outperforms ForeCache and SVR.
One interesting found is that the accuracy of ForeCache, the 2D state-of-the-art prefetching algorithm, is even lower than SVR. One possible reason is that ForeCache is designed for the 2D world, where the user’s operation is much simpler and hence easier to predict. When considering the 3D world, the user’s trajectory is more complicated because of the extra dimension, which makes it more challenging to achieve reliable predictions. This issue may be addressed by adding the number size of training data. However, on the other hand, our method can achieve a better result with the same amount of training data. In Figure4.5, both the ground truth and the predicted trajectories are plotted to
de-Figure 4.4: The evaluation of miss ratio
scribe the accuracy of our prediction. The blue line indicates ground truth, and the red line indicates the prediction. These five test cases are very representative:
1)Although Test 1 looks very simple, there are many zooming in & zooming out
oper-ations, which leads to a high number of block replacement;
2)In Test 2 & Test 3, the camera moves smoothly, and we usually can achieve a very
accurate prediction;
3)Users move quickly and aimlessly in Tests 4 & Test 5, which usually happens at the
large the size of the dataset to 8 GB and 32 GB (the resolution of all the other levels increase accordingly). In Figure4.6(a), (b), and (c), the size of the dataset is 8 GB, and we limit the memory size to 2 GB; Figure4.6(d), (e), and (f) use 32 GB data under 8 GB memory. Be-lady’s MIN is an optimal method that will replace the block whose next reference is the furthest in the future, but its performance seems not that good, as shown in Figure4.6. This is because it has to do many computations for each time step to calculate the farthest referenced block when replacing from the cache, which leads to very high overhead. In the previous section, the miss rate of Belady’s MIN is much lower than the other traditional cache methods without the prefetching process, which can confirm this view.
Another interesting found is that the ForeCache outperforms other traditional cache methods in (a), (b), and (c), but it does not perform well in (d), (e), and (f). Since the data in (d), (e), and (f) have a vast size, the time Forecache uses to prefetch blocks can significantly exceed the rendering time. As a consequence, the cost of making false predictions after the rendering process is prohibitive. From the performance test, our method outperforms all the other comparators; We use performance over LRU to better describe the results (see Table4.2). Our method employs a neural network to predict the next camera position, and then prefetch a droplet-shaped area to avoid the different hierarchy problem and bet-ter mimic the behavior of the user’s movement. A monitor module is employed to cease the prefetching process to make the most use of the rendering time. The performance of FlowCache is up to 52% better than using LRU.
Table 4.2: Performance over LRU
Experiment FIFO MIN 2Q MQ ARC ForeCache SVR Ours a 0.01 -2.17 -0.05 0.09 0.04 0.08 0.16 0.22 b 0.01 -2.48 -0.02 0.06 0.03 0.05 0.10 0.14 c 0.01 -1.73 0.08 0.11 0.05 0.05 0.21 0.29 d 0.03 -0.35 0.05 0.23 0.09 -0.12 0.32 0.48 e 0.02 -0.84 -0.03 0.19 0.07 -0.09 0.29 0.42 f 0.03 -0.06 0.12 0.09 0.10 -0.04 0.37 0.52
Chapter 5
Conclusion and Future Work
This thesis work describes the access patterns in the data visualization and proposes a novel data replacement policy to address the I/O latency challenge for interactive visu-alization on 3D scientific data. Our method employs an LSTM neural network to learn the user’s data access patterns according to their visualization operations and can de-liver very accurate prediction results in real-time. We tested the accuracy and the perfor-mance of our method using the real-world data, and the results show that our method can achieve better performance than the state-of-the-art 2D interactive visualization system and other traditional cache algorithms. The dramatic latency improvement over current non-prefetching systems is up to 52%.
There are some future directions for this thesis work:
1)It is possible to generalize the predicting model by adding another layer on the top
to classify similar datasets or users into corresponding groups;
2) When considering data-dependent operations, we can train a model to directly
learn the relationship between the data access and the user’s trajectories without predict-ing the next camera position;
3) Exploring some new caching structures for data visualization can also help
In the future, we also would like to build a client-server architecture system to visu-alize the scientific dataset where the dataset would be retrieved from a back-end server, and the user only needs to interact with a lightweight interface on the client-side. The approach runs in front of a data store to prefetch the relevant blocks. Compared to visu-alizing data locally, running on the browser with limited resources would require a faster data replacement algorithm.
References
[1] Sparsh Mittal. A survey of recent prefetching techniques for processor caches. ACM
Computing Surveys (CSUR), 49(2):35, 2016.
[2] Claudio Silva, Yi-Jen Chiang, Jihad El-Sana, and Peter Lindstrom. Out-of-core algo-rithms for scientific visualization and computer graphics. IEEE Visualization Course
Notes, 2002.
[3] Thomas Fogal, Alexander Schiewe, and Jens Krüger. An analysis of scalable gpu-based ray-guided volume rendering. In2013 IEEE Symposium on Large-Scale Data
Anal-ysis and Visualization (LDAV), pages 43–51. IEEE, 2013.
[4] M. Isenburg, P. Lindstrom, S. Gumhold, and J. Snoeyink. Large mesh simplification using processing sequences. InIEEE Visualization, 2003. VIS 2003., pages 465–472, Oct
2003.
[5] Philip M. Sutton and Charles D. Hansen. Accelerated isosurface extraction in time-varying fields. IEEE Transactions on Visualization and Computer Graphics, 6(2):98–107,
April 2000.
[6] Paolo Cignoni, Fabio Ganovelli, Enrico Gobbetti, Fabio Marton, Federico Ponchio, and Roberto Scopigno. Adaptive tetrapuzzles: Efficient out-of-core construction and visualization of gigantic multiresolution polygonal models. InACM SIGGRAPH 2004
[7] Shyh-Kuang Ueng, C. Sikorski, and Kwan-Liu Ma. Out-of-core streamline visualiza-tion on large unstructured meshes. IEEE Transactions on Visualization and Computer
Graphics, 3(4):370–380, Oct 1997.
[8] Ronell Sicat, Jens Krüger, Torsten Möller, and Markus Hadwiger. Sparse pdf volumes for consistent multi-resolution volume rendering. IEEE transactions on visualization
and computer graphics, 20(12):2417–2426, 2014.
[9] Shaomeng Li, Nicole Marsaglia, Christoph Garth, Jonathan Woodring, John Clyne, and Hank Childs. Data reduction techniques for simulation, visualization and data analysis. InComputer Graphics Forum, volume 37, pages 422–447. Wiley Online Library,
2018.
[10] L. A. Belady. A study of replacement algorithms for a virtual-storage computer. IBM
Syst. J., 5(2):78–101, June 1966.
[11] Yue Cheng, Fred Douglis, Philip Shilane, Grant Wallace, Peter Desnoyers, and Kai Li. Erasing belady’s limitations: In search of flash cache offline optimality. In2016
USENIX Annual Technical Conference (USENIX ATC 16), pages 379–392, Denver, CO,
2016. USENIX Association.
[12] Theodore Johnson, Dennis Shasha, et al. 2Q: a low overhead high performance bu er management replacement algorithm. InProceedings of the 20th International Conference
on Very Large Data Bases, pages 439–450, 1994.
[13] Yuanyuan Zhou, James Philbin, and Kai Li. The multi-queue replacement algorithm for second level buffer caches. InProceedings of the General Track: 2001 USENIX Annual
Technical Conference, pages 91–104, Berkeley, CA, USA, 2001. USENIX Association.
[14] A. Jain and C. Lin. Back to the future: Leveraging belady’s algorithm for improved cache replacement. In2016 ACM/IEEE 43rd Annual International Symposium on
ment policy for interactive large-scale scientific visualization. In2017 IEEE
Interna-tional Parallel and Distributed Processing Symposium Workshops (IPDPSW), pages 1216–
1225, May 2017.
[17] Johanna Beyer, Markus Hadwiger, Ali Al-Awami, Won-Ki Jeong, Narayanan Kasthuri, Jeff W Lichtman, and Hanspeter Pfister. Exploring the connectome: Petas-cale volume visualization of microscopy data streams. IEEE computer graphics and
applications, 33(4):50–61, 2013.
[18] Leilani Battle, Remco Chang, and Michael Stonebraker. Dynamic prefetching of data tiles for interactive visualization. InProceedings of the 2016 International Conference on