University of Nebraska - Lincoln
DigitalCommons@University of Nebraska - Lincoln
Faculty Publications in Food Science and
Technology
Food Science and Technology Department
2017
Negative binomial mixed models for analyzing
microbiome count data
Xinyan Zhang
University of Alabama at Birmingham
Himel Mallick
Harvard T.H. Chan School of Public Health
Zaixiang Tang
Medical College of Soochow University
Lei Zhang
Medical College of Soochow University
Xiangqin Cui
University of Alabama at Birmingham
See next page for additional authors
Follow this and additional works at:
http://digitalcommons.unl.edu/foodsciefacpub
Part of the
Food Science Commons
This Article is brought to you for free and open access by the Food Science and Technology Department at DigitalCommons@University of Nebraska -Lincoln. It has been accepted for inclusion in Faculty Publications in Food Science and Technology by an authorized administrator of
DigitalCommons@University of Nebraska - Lincoln.
Zhang, Xinyan; Mallick, Himel; Tang, Zaixiang; Zhang, Lei; Cui, Xiangqin; Benson, Andrew K.; and Yi, Nengjun, "Negative binomial mixed models for analyzing microbiome count data" (2017).Faculty Publications in Food Science and Technology. 227.
M E T H O D O L O G Y A R T I C L E
Open Access
Negative binomial mixed models for
analyzing microbiome count data
Xinyan Zhang
1, Himel Mallick
2,3, Zaixiang Tang
4, Lei Zhang
4, Xiangqin Cui
1, Andrew K. Benson
5and Nengjun Yi
1*Abstract
Background:Recent advances in next-generation sequencing (NGS) technology enable researchers to collect a large volume of metagenomic sequencing data. These data provide valuable resources for investigating interactions between the microbiome and host environmental/clinical factors. In addition to the well-known properties of microbiome count measurements, for example, varied total sequence reads across samples, over-dispersion and zero-inflation, microbiome studies usually collect samples with hierarchical structures, which introduce correlation among the samples and thus further complicate the analysis and interpretation of microbiome count data. Results:In this article, we propose negative binomial mixed models (NBMMs) for detecting the association between the microbiome and host environmental/clinical factors for correlated microbiome count data. Although having not dealt with zero-inflation, the proposed mixed-effects models account for correlation among the samples by incorporating random effects into the commonly used fixed-effects negative binomial model, and can efficiently handle over-dispersion and varying total reads. We have developed a flexible and efficient IWLS (Iterative Weighted Least Squares) algorithm to fit the proposed NBMMs by taking advantage of the standard procedure for fitting the linear mixed models.
Conclusions:We evaluate and demonstrate the proposed method via extensive simulation studies and the application to mouse gut microbiome data. The results show that the proposed method has desirable properties and outperform the previously used methods in terms of both empirical power and Type I error. The method has been incorporated into the freely available R package BhGLM (http://www.ssg.uab.edu/bhglm/ and http://github.com/abbyyan3/BhGLM), providing a useful tool for analyzing microbiome data.
Keywords:Count data, Correlated measures, Microbiome, Metagenomics, Random effects, Negative binomial model, Penalized Quasi-likelihood
Background
The advent of next-generation sequencing (NGS) tech-nology enables the generation of large volume of meta-genomic sequencing data at moderate cost [1–3]. This opens a new era of metagenomics studies to explore microbial communities sampled directly from the envi-ronments without need for cultivation [4–6]. The meta-genomic sequencing data provide valuable resources for investigating associations between the microbiome and host environmental/clinical factors. Accurately identify-ing and understandidentify-ing these associations is critical to elucidate the true roles of the microbiome in health and
disease states and for development of new diagnostics and therapeutic targets based on the microbiome [7– 10]. Recent studies have found that the human micro-biome is influenced by various host factors including genotype [11–14], lifestyle such as dietary habit [15, 16], physiological status such as aging [17], pathophysiological status [18], and host environment [19]. Abnormalities in compositional features of the microbiome are associated with human diseases such as obesity [20], diabetes [21], inflammatory bowel disease [22], and cancers [23].
Despite our ability to generate large-scale metage-nomic sequencing data, study of the microbiome is still in its infancy and many challenges exist to decipher the mechanisms through which the microbiome affects human health. One of the challenges is the development of robust and powerful statistical methods and
* Correspondence:[email protected]
1Department of Biostatistics, University of Alabama at Birmingham,
Birmingham, AL 35294-0022, USA
Full list of author information is available at the end of the article
© The Author(s). 2017Open AccessThis article is distributed under the terms of the Creative Commons Attribution 4.0 International License (http://creativecommons.org/licenses/by/4.0/), which permits unrestricted use, distribution, and reproduction in any medium, provided you give appropriate credit to the original author(s) and the source, provide a link to the Creative Commons license, and indicate if changes were made. The Creative Commons Public Domain Dedication waiver (http://creativecommons.org/publicdomain/zero/1.0/) applies to the data made available in this article, unless otherwise stated. Zhanget al. BMC Bioinformatics (2017) 18:4
computational tools for properly analyzing and inter-preting complex microbiome data. High-throughput microbiome datasets generated by the 16S ribosome RNA (rRNA) gene sequencing or shotgun metagenomic sequencing have some properties that require tailored analytic tools; these include count compositional struc-ture, varied total sequence reads across samples, over-dispersion and zero-inflation. Several methods have been developed to tackle these properties. One way to ac-count for varing total reads is normalization, i.e., conver-sion of the sequence counts to the relative abundance (or proportion) using the total sum, mean, or median of representative OTUs across all samples [7, 24–27]. The negative binomial regression, which is a standard statis-tical method for analyzing over-dispersed count observa-tions, has been recently applied to microbiome data [28]. On the other hand, several zero-inflated models have also been proposed to correct for excess zero counts in microbiome measurements, including zero-inflated Gaussian, lognormal, negative bimomial and beta models [25, 29–32].
In addition to the challenges resulting from the char-acteristics of microbiome count data, there are other statistical issues due to the study designs commonly used in microbiome studies. Microbiome studies usu-sally collect samples from study designs that bring about hierarchical, spatial, and temporal dependences [32–39], which introduce correlation among the samples and thus further complicate the analysis and interpretation of microbiome count data. Since related samples tend to harbor more similar microbiota than unrelated ones [11, 38], ignoring the correlation among samples can result in biased inference and misleading results. Thus, statis-tical models for accounting for the correlation among samples are crucially required [11, 38, 40].
The literature on mixed-effects models for analyzing microbiome count data is sparse. Most of the previous studies resort to linear mixed models (LMMs) to ac-count for hierarchical structures in microbiome study designs by treating transformed data as normally distrib-uted responses [33–35, 37, 39]. Such methods may be suboptimal due to the discrete and compositional nature of the microbiome measures and can be hard to inter-pret on the original scale, which might lead to challenges in future prediction tasks and replication studies. To ad-dress these limitations, we propose negative binomial mixed models (NBMMs) for directly modeling the raw microbiome count data, which bypasses the need for transformation. Although not dealing with zero-inflation, the proposed mixed-effects models not only ef-ficiently handle over-dispersion and varying total reads, but also account for correlation among the samples. We develop a flexible IWLS (Iterative Weighted Least Squares) algorithm to fit the proposed NBMMs by
taking advantage of the standard procedure for fitting linear mixed models. Through extensive simulations, we show that the NBMMs outperform the negative bino-mial model and the previously used linear mixed models in terms of empirical power and false positive rates. We also apply our method to previously published mouse gut microbiome data to detect taxa significantly associ-ated with high-fat diet. The proposed method is capable of identifying biologically significant taxa, consistent with the existing literature. We have implemented the method in the freely available R package BhGLM, pro-viding a useful tool for microbiome studies.
Methods
Negative Binomial Mixed Models (NBMMs) for microbiome studies
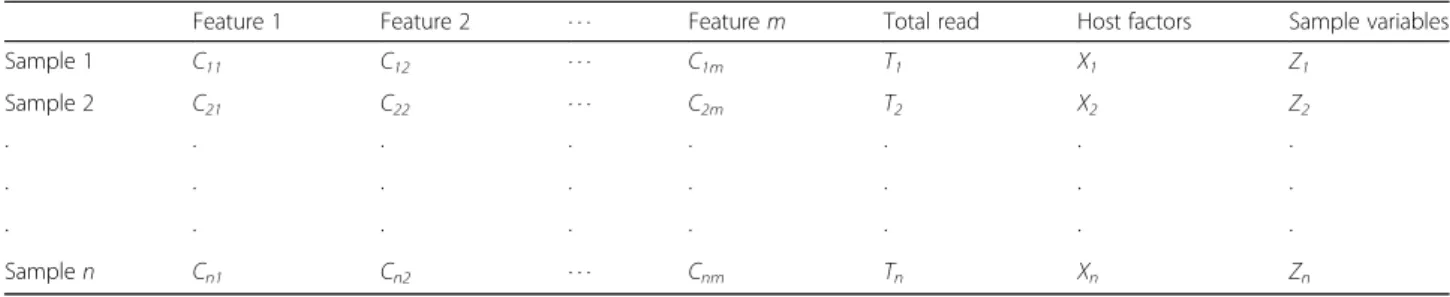
Typical microbiome data generated by the 16S rRNA gene sequencing or the shotgun metagenomic sequen-cing consist of the following components (see Table 1): 1) Counts, Cij, for n samples and m features. The
fea-tures may refer to bacterial taxa at different hierarchical levels (species, genus, classes, etc.), groups of correlated taxa, gene functions, or pathways, etc.; 2) Total se-quence read (also referred to as depths of coverage or library size), Ti, for each sample; 3) Host factors, Xi,
representing host clinical/environmental or genetic vari-ables; 4) Sample variables,Zi, representing sample
col-lection identifier in the hierarchical study design, such as family structure, repeated measures from multiple body sites or time points. The goal is to detect associations between microbiome features Cij and host factors Xi.
The total sequence reads vary from sample to sample by orders of magnitude and can largely bias comparison of counts across samples, and thus should be accounted for in the analysis. Sample variables Zi introduce
hierarch-ical, spatial, and temporal dependence of microbiome counts, and should be included in the analysis as ran-dom factors.
Similar to most existing methods, we separately analyze each feature (count response) in a univariate fashion. For notational simplification, we denote yi=Cij
for any given feature j. We assume that the count re-sponseyifollows the negative binomial distribution:
yieNB yð ijμi;θÞ ¼ΓðyiþθÞ Γ θð Þyi! ⋅ θ μiþθ θ ⋅ μi μiþθ yi ð1Þ where μi and θ are the mean and the shape parameter,
respectively, and Γ(·) is the gamma function. The nega-tive binomial distribution can be expressed as a gamma mixture of Poisson distribution [41]: yi~ Poisson(yi|μiεi)
Varð Þ ¼yi μiþμ
2
i
θ, and Var(yi)≥E(yi). Thus, the shape
parameter θ controls the amount of over-dispersion. When θ= +∞, Var(yi) =μi and the negative binomial
model converges to a Poisson model that cannot deal with over-dispersion.
Our negative binomial mixed models (NBMMs) relate the mean parametersμito the host factorsXi(including
the intercept), the sample variables Zi and the total
se-quence readsTivia the link function logarithm:
logð Þ ¼μi logð Þ þTi XiβþZib ð2Þ
where log(Ti) is the offset, which corrects for the variation
of the total sequence reads across the samples, β is the vector of fixed effects for the host factorsXi, andbis the
vector ofKrandom effects for the sample variablesZi. The
random effects are used to model the correlation among the samples and the multiple sources of variation, and thus to avoid biased inference on the effects of the host factors Xi. The vector of the random effects is usually assumed to
follow the multivariate normal distribution [42, 43]:
beNKð0;ΨÞ ð3Þ
whereΨis a positive-definite variance-covariance matrix that determines the form and complexity of random ef-fects. Although in principle our NBMMs can deal with various patterns ofΨ, we here describe the method with a simple case where the random effects are independent, i.e.,b~NK(0,τ2I).
The IWLS algorithm for fitting the NBMMs
We propose an IWLS (Iterative Weighted Least Squares) algorithm to fit the NBMMs by extending the commonly used algorithms for fitting generalized linear models (GLMs) and generalized linear mixed models (GLMMs). For any fixed shape parameter θ, the negative binomial density is of the exponential form, NB yð ijμi;θÞ ¼ exp
yiϑi−bð Þϑi
ϕ þc yð i;ϕÞ
n o
, where ϑi¼ logμiμþθi , ϕ= 1, bð Þϑi ¼−θlog 1−elogμiþμiθ
¼−θlog 1 −eϑi, and c y i;ϕ ð Þ ¼ log ΓðyiþθÞθθ Γ θð Þyi!
. Therefore, the negative binomial model is a special case of generalized linear models (GLMs) for any
fixedθ. Ifθis an unknown parameter, the negative bino-mial model is not a GLM. However, the NBMMs can be fit by iteratively updating the parameters (β,b,τ2) andθ. Conditional onθ, the NBMM is a special GLMM and thus the parameters (β, b, τ2) can be updated by using the GLMMs procedure. Conditional on (β,b), the shape par-ameterθcan be updated by maximizing the NB likelihood using the standard Newton–Raphson algorithm [44].
Conditional onθ, we update the parameters (β,b,τ2) by extending the IWLS algorithm or equivalently the Penal-ized Quasi-Likelihood procedure for fitting GLMMs. [42, 44–46] The IWLS algorithm proceeds to approximate the generalized linear model likelihood by a weighted normal likelihood and then update the parameters from the weighted normal model [41, 47]. Conditional on the shape parameterθ, the fixed effectsβand the random effectsb, the negative binomial likelihood NB(yi|μi,θ) can be
ap-proximated by the weighted normal likelihood:
NB yð ijμi;θÞ≈N tijηi;wi
−1
ð4Þ where ηi= log(Ti) +Xiβ+Zib, the ‘normal response data’
ti and the ‘weights’ wi are called the pseudo-response
and the weights, respectively. The pseudo-responsetiand pseudo-weightswiare calculated by:
ti¼η^i− L0yij^ηi;θ^ L00 yijη^i;^θ ; and wi¼−L00 yijη^i;^θ ð5Þ where ^ηi¼ logð Þ þTi Xiβ^þZi^b, L yij^ηi;θ^
¼ logNB yij^μi;^θ , L' (yi|ηi,θ) =dL(yi|ηi,θ)/dηi, L'' (yi|ηi,θ) = d2L(yi|ηi,θ)/dηi2, and ^β;^b
and θ^ are the current esti-mates of (β,b) and θ, respectively. Therefore, the NBMMs can be approximated by the linear mixed model withwias weights:
ti¼ logð Þ þTi XiβþZib þwi −1=2 ei; beNK 0;τ2 ; eeNn 0;σ2I ð6Þ The parameters (β, b, τ2, σ2) are then updated from this linear mixed model by using the standard algorithm for fitting LMMs.
Table 1Microbiome Data Structure
Feature 1 Feature 2 · · · Featurem Total read Host factors Sample variables
Sample 1 C11 C12 · · · C1m T1 X1 Z1 Sample 2 C21 C22 · · · C2m T2 X2 Z2 · · · · · · · · · · · · Samplen Cn1 Cn2 · · · Cnm Tn Xn Zn
In summary, the IWLS for fitting the NBMMs is an it-erative algorithm and proceeds as follows:
1) Initializeβ,b, andθsome plausible values; 2) Forj= 1, 2, · · · :
a) Based on the current values (β(j−1),b(j−1),θ(j−1)), calculate pseudo-responseti(j)and pseudo-weights wi(j)
;
b) Update (β,b,τ2,σ2) by fitting the LMM (6);
c) Updateθby the standard Newton–Raphson
algorithm.
3) Repeat Step 2) until convergence.
We use the criterion (η(j)−η(j−1))2<ε(η(j))2 to assess convergence, whereηð Þj ¼Xn
i¼1
logð Þ þTi Xiβð Þj þZibð Þj
, andεis a small value (say 10−5). At convergence of the al-gorithm, we get the maximum likelihood estimates of the fixed effects βk and their confidence intervals from the
final LMM. We then can test H0: βk= 0 following the
LMMs framework.
It has been noted that the maximum likelihood esti-mator of the shape parameter θ in negative binomial models often lacks robustness and may be severely biased or even fail to converge especially if the sample size is small [48]. Similar to quasi-GLMs [47] and GLMMs [44–46], the above IWLS algorithm for fitting the NBMMs introduces an additional parameter σ2, which can correct for over-dispersion to some extent even ifθ is not well estimated. Therefore, our approach can be robust and efficient to deal with over-dispersed microbiome count data.
Computer software for implementing the proposed method We have created an R functionglmmfor setting up and fitting the NBMMs. The function glmm works by re-peated calls to the function lme in the package nlme. The function lme is widely used for analyzing linear mixed models. The function glmm takes advantage of the nice features in lme, and thus provides an efficient and flexible tool for analyzing microbiome count data. We have incorporated the function glmm into our R package BhGLM, which is freely available from the website http://www.ssg.uab.edu/bhglm/ and the public GitHub repository http://github.com/abbyyan3/BhGLM that includes R codes for examples, simulation studies and real data analysis in this article.
Results
Simulation studies
Simulation design
We used simulation studies to assess the performance of the proposed method and to better understand the
properties of our procedure. Several studies have re-cently performed simulations for microbiome data [25, 29, 30, 49, 50], most of which use negative binomial dis-tributions to generate microbiome counts. We followed the simulation framework of Sohn et al. [30] to simulate microbiome counts from negative binomial distributions and extended their framework to include random effects and correlation structures:
yieNB yð ijμi;θÞ; logð Þ ¼μi logð Þ þTi μþxiβ
þzib; beNK 0;τ2I
; i¼1;⋯;n
We simulated n= 200 and 400 individuals clustered into K=n/10 groups (e.g., families), respectively. We considered a binary fixed-effect variable xi and a
random-effect factor zi. The random-effect factor ziwas
a multinomial variable, i.e., zi= (zi1,⋯,ziK), zij=
0 or 1, ∑jK= 1zij= 1, which assigned n samples into K
groups and introduced correlation for the samples within a same group. To simulate xi and zi, we first
generated two continuous variables from the standard normal density N(0, 1) with a preset correlation coeffi-cientρ, and then transformed the first continuous vari-able to a binary indictor xi based on the quantile of
40% and the second continuous variable to a multi-nomial variable zi based on the K quantiles. Our goal
was to evaluate the performance of the proposed method for detecting the simulated fixed effect β and also the accuracy of parameter estimation.
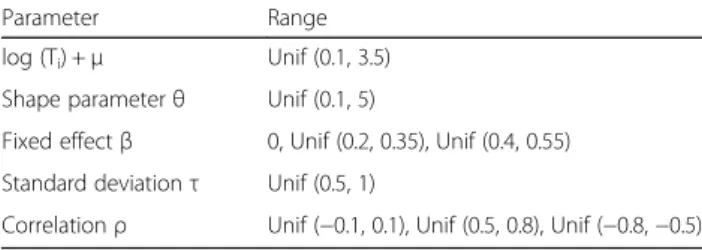
There are several parameters that determine the distri-bution of the simulated count data. To minimize any possible bias and to yield reasonable count values that are similar to real microbiome data, we randomly gener-ated these parameters from wide ranges of values par-tially drawn from the real data described in the next section:
1) The valuesTiare total reads, andμis the overall mean. Thus, the values, log(Ti) +μ, control the mean
of simulated counts. We setμ=−7 and randomly
sampled values, log(Ti), from the range [7.1, 10.5]. In this case, log(Ti) +μfalls in the range [0.1, 3.5], which yield similar counts as in the real microbiome data;
2) The shape parameterθcontrols over-dispersion; we
uniformly sampleθfrom the range [0.1, 5], which yield highly or moderate over-dispersed counts; 3) To evaluate false positive rates, the fixed effectβwas
set to be zero, and to evaluate empirical power,β was set to be low from [0.2, 0.35], or high from [0.4, 0.55];
4) To generate the random effectsbk, we first sampled
5) The correlation coefficientρwas set to be weak from [−0.1, 0.1], positive from [0.5, 0.8], or negative from [−0.8,−0.5].
The ranges of all the parameters used in the simula-tion are summarized in Table 2.
For each combination of the parameters, the proced-ure was repeated 5000 times. Both empirical power and Type I error for testing the hypothesis H0: β= 0 were
calculated under several significance (alpha) levels. We compared the proposed NBMMs with three existing methods:
1) The linear mixed model with the log transformation (LMM_log): logyiþ1
Ti ¼β0þxiβþzibþei, b~
NK(0,τ2I), ei~N(0,σ2);
2) The linear mixed model with the arcsine square root transformation (LMM_arcsine): arcsine
ffiffiffiffiy i Ti q ¼β0 þxiβþzibþei,b~NK(0,τ2I),ei~N(0,σ2);
3) The negative binomial model (NB):yi~NB(yi|μi,θ), log(μi) = log(Ti) +β0+xiβ;
4) The linear model with the arcsine square root transformation (LM): arcsin ffiffiffiffiy i Ti q ¼β0þxiβþei, ei~N(0,σ2). Simulation results
Figure 1 displays Type I error rates for detecting the fixed effect under four significance levels for the four methods. We found that sample size nhad minimal ef-fects on Type I error. However, the correlation between the host variable and the random factor affected Type I error if the random factor was not included in the model. Under the weak correlation setting (i.e., ρ ϵ [−0.1, 0.1]), the four methods, NBMM, LMMs (LMM_arcsine and LMM_log) and LM, controlled Type I error under or close to the nominal level, however, NB had slightly inflated Type I error. In both positive and negative correlation settings (i.e., ρ ϵ[0.5, 0.8] or [−0.8,
−0.5]), NB and LM had largely inflated Type I errors, however, NBMM and LMMs still resulted in well con-trolled Type I errors. This implies that ignoring the ran-dom effects can be misleading and can produce severely biased results.
Figure 2 shows empirical power for detecting the fixed effect under four significance levels for the four methods. As expected, the power was largely affected by the sample size and the effect size. However, the correl-ation between the host variable and the random factor had little influence on the empirical power. It can be clearly seen that the proposed method performed con-sistently much better than the other methods across all the scenarios. For most scenarios, LMMs were able to produce higher power than NB. Therefore, our NBMM that accounts for the dependence of samples and directly analyzes the generated count data produces increased power to detect the fixed effect of interest.
Figure 3 displays the differences between the estimates of three parameters, the fixed effect β, the variance τ2 and the shape parameter θ, and their simulated values, in our NBMM. It can be seen that the estimates of β and τ2 were very close to the corresponding simulated values under all the scenarios and the estimates of the shape parameter were slightly inflated. These results show that the proposed IWLS algorithm was able to provide accurate model fit. We found that models in which the estimates of the shape parameter were inflated usually gave larger residual variancesσ2. This finding in-dicates that with the additional parameter σ2, our method can robustly deal with over-dispersion even if the shape parameter was not accurately estimated.
Application to mouse gut microbiome data
We applied our method to a robust mouse gut micro-biome data set from the genetic analysis of Leamy et al. [39]. The population of 472 mice is the tenth gener-ation of advanced intercross from an original cross of inbred C57BL/6 J (B6) female mice with male mice from a strain (HR) selected for a high level of voluntary wheel running. The 472 progeny G10 mice were
gener-ated from 45 G9dams and 42 G9sires, forming family
structuring in the G10 progeny. The detailed protocol
for mating can be found in Leamy et al. [39]. At 4 weeks of age, all G10 progeny mice were randomly allocated
into two diet groups, one fed with high-fat diet, the other fed with control diet. At 8 weeks of age, the fecal pellets of mice were collected for DNA extraction and subsequent pyrosequencing. Composition of the micro-biota was assessed by deep pyrosequencing of PCR products originating from the V1-V2 region of the 16S rRNA gene with bar-coded fusion primers containing Roche-454 A or B Titanium sequencing. 203 taxa were detected for the species level data. These species belong to 104 different genera, 45 families, 29 orders, 22 clas-ses and 14 phyla. The median value of the total reads across all animals was 14170 and the standard deviation was 3422.
Table 2Parameter Ranges in Simulation Studies
Parameter Range
log (Ti) +μ Unif (0.1, 3.5)
Shape parameterθ Unif (0.1, 5)
Fixed effectβ 0, Unif (0.2, 0.35), Unif (0.4, 0.55)
Standard deviationτ Unif (0.5, 1)
Correlationρ Unif (−0.1, 0.1), Unif (0.5, 0.8), Unif (−0.8,−0.5)
We used the proposed NBMM and two linear mixed models (LMMs) with the arcsine square root transforma-tions and log (LMM_arcsine and LMM_log) to detect as-sociations between taxa and high-fat diet. Since the maternal environment have a profound influence on the microbiota composition [11], we included dam indicators as a random factor in the NBMM and LMMs. In LMM_arcsine, we treated the arcsine square root trans-formed values, arcsin ffiffiffiffiyi
Ti
q
, as normally distributed, where yi is the microbiome count and Ti is the total
se-quence read for the i-th animal. In LMM_log, we treated the transformed values logyiþ1
Ti as normally distributed.
These two LMMs performed similarly and thus only re-sults of LMM_arcsine were shown in the following figure. Leamy et al. [39] also analyzed the associations between taxa and high-fat diet. However, their analyses compared estimates of alpha diversity in the microbiota across ani-mals fed control or high-fat diets and used ANOVA to identify significant taxa not accounting for the dam effects.
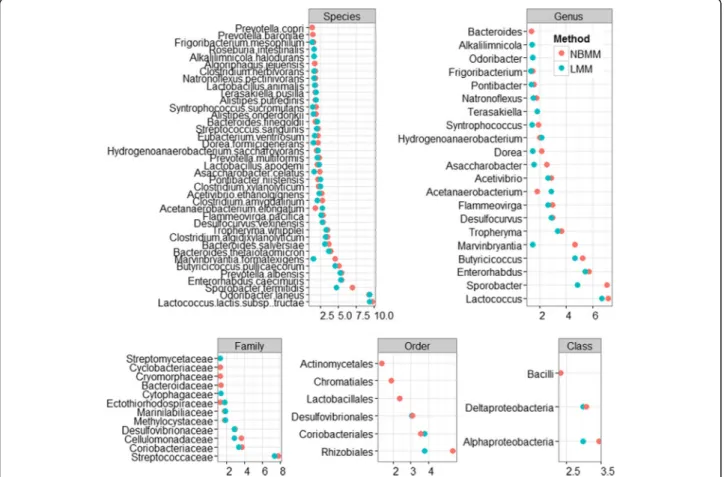
Figure 4 shows the significant features of the species, genus, family, order, class and phylum levels at the 5% significance threshold and their minus log transformed p-values for NBMM and LMM_arcsine. It can be seen that For NBMM and LMM_arcsine the identified signifi-cant features were mostly overlapped. However, the pro-posed NBMM method produced smaller p-values for most of the identified features, and detected more sig-nificant features than the LMM_arcsine. These results indicate that our NBMM approach is more powerful to detect significant features than the previously used LMMs in real data analysis.
The top significant genera includeLactococcus, Sporo-bacter, Enterorhabdus, Marvinbryantia,and Butyricicoc-cus. Some of the identified features are associated with metabolic health and have been previously reported in other studies. At the species level, Marvinbryantia for-matexigenshas been reported to decrease with increased casein levels in dietary intervention, and the genus Mar-vinbryantiais also believed to be associated with human
Fig. 1Type I error rates for the five methods in different simulation settings
health [51, 52]. Eubacterium ventriosumhas been found to be shifted by high fat diet [53] andAlistipes putredinis has also been found to be of particular interest in its as-sociation with obesity [54]. The genus Lactococcus has been reported to decrease overtime in high-fat diet fed mice [51, 55]. The genus Enterorhabdus has been
reported to be positive correlated with intrahepatic levels triacylglycerol concentrations and non-HDL plasma con-centrations in mice or hamsters [56]. The genus Butyri-cicoccushas also been discovered to decrease in mice fed a high-fat diet [57]. Studies have also found that the spe-cies Tropheryma whippleis is associated with acquired
Fig. 3Differences between the estiamates and their simulated values for the parametersβ,τ2, andθin the proposed NBMM in different simulation
settings. The points represent the average values and the lines represent the interval estimates
Fig. 4The analyses of NBMM and LMM with the arcsine square root transformation: minus log transformed p-values for the significant differentially
abundant taxa at the 5% significance threshold between high fat diet and control diet groups for species, genus, family, order, and class levels
obesity [58, 59]. It is also worth noting that certain gen-era were only detected by NBMM, includingBacteroides, which has been reported as an important genus in high-fat fed animals gut microbiome to potentially act as Obesity-Associated Metabolic Parameters [51, 60–62]. Discussion and conclusions
We have proposed a negative binomial mixed model to detect the associations between host clinical/environ-mental factors and the microbiome while accounting for sources of heterogeneity and dependence in microbiome measurements. Many microbiome studies collect sam-ples with hierarchical, spatial, and temporal structures [33–38]. These properties have important implications in the analysis and interpretation of microbiome data. Our simulation studies illuminated the impact of such structuring on the data, showing that ignoring the cor-relation among samples can substantially inflate Type I error and reduce power for detecting the effects of host clinical/environmental factors, thus leading to biased and false inferences. Due to the lack of efficient statis-tical methods and programs, most previous studies used conventional linear mixed models (LMMs) by treating transformed relative abundance data as normally distrib-uted response. Although useful in some situations, LMMs can be less powerful than the proposed method as shown in our simulation studies.
We applied our method to previously published data set of a genetic analysis to detect host genetic factors that control compositional featurs of the gut micro-biome [39]. The goal of our analysis was to detect taxa that are significantly associated with the effect of high-fat diet, which was introduced as an environmental vari-able in the original study to examine G x E effects on microbiome composition. Many studies found that the maternal environment have a profound influence on the microbiota composition [11, 63–66]. Thus, it is neces-sary to incorporate the dam indictors as a random factor into the model to correct for possible counfounding ef-fects. Our analysis identified several significant and bio-logically meaningful taxa that have been previously reported in other studies. Our NBMM method was able to detect more significant taxa and yield much smaller p-values than the LMMs, showing that the proposed method could be more powerful than the conventional LMMs in real data analysis.
The proposed NBMMs directly model microbiome counts generated by the 16S rRNA gene sequencing or the shotgun sequencing. Since most bioinformatics tools produce count data in microbiome studies, the proposed method has broad applications. For shotgun metage-nomic data, some tools such as MetaPhlAn only output the relative abundances or proportions of the bacteria in the sample. Chen and Li [40] have recently developed
zero-inflated Beta mixed-effects models to analyze the proportion data. Although we focus our analysis on microbiome studies, the proposed method are applicable to other similar types of sequence count data such as RNA-Seq. Most of the statistical methods and computer software for analyzing RNA-Seq data are developed based on negative binomial models [27, 67], but have not incorporated random effects. Our ability to deal with other types of sequence count data further broadens the biological impact of the proposed approach.
We have developed an IWLS algorithm to fit the proposed NBMMs by extending a commonly used procedure for fitting GLMs and GLMMs. [42, 44–46] The idea of the algorithm is to approximate the nega-tive binomial likelihood given the shape parameter by a weighted normal likelihood and then to update the parameters by fitting a linear mixed model. This pro-cedure for GLMs and GLMMs has been proved to be highly useful and efficient. Our extensive simulations and real data analysis show that our algorithm is stable and efficient.
The proposed NBMMs with the IWLS algorithm have several remarkable features. Due to the introduction of an additional parameter σ2 to correct for over-dispersion, the proposed method can be robust and effi-cient to deal with over-dispersed data. Our approach takes advantage of the fitting procedure of LMMs to up-date the parameters, and hence can in principle incorp-orate all the features of LMMs into the NBMMs. Although we describe our method with a simple random effect, the proposed method can be applied to various patterned covariance structures for modeling special random effects [42, 43], for example, family, longitu-dinal, repeated measures or kinship structures. The as-sumption Var(e) =σ2I can be relaxed as described in Pinheiro and Bates [43], where they discuss extensions that allows us to model non-constant variances or spe-cial correlation structures. All these extensions will be incorporated into the proposed NBMMs. Microbiome data have the distinct characterstic of zero-inflation. The proposed NBMMs are not particularly designed to deal with zero-inflation, although we suggest it as a future work.
Abbreviations
ANOVA:Analysis of variance; GLMMs: Generalized linear mixed models; GLMs: Generalized linear models; HDL: High-density lipoproteins; IWLS: Iterative Weighted Least Squares; LMMs: Linear mixed models; NB: Negative binomial; NBMMs: Negative binomial mixed models
Acknowledgments
We thank the associate editor and two reviewers for their constructive suggestions and comments. This work was supported in part by the research grants: NIH R01GM069430, NIH R03DE024198, NIH R01 DK087346, National Natural Science Foundation of China 81573253, National Natural Science Foundation of China 31571291.
Funding
This work was supported in part by the research grants: NIH R01GM069430, NIH R03DE024198, NIH R01 DK087346, National Natural Science Foundation of China 81573253, National Natural Science Foundation of China 31571291.
Availability of data and materials
The method has been incorporated into the freely available R package BhGLM (http://www.ssg.uab.edu/bhglm/ and http://github.com/abbyyan3/ BhGLM). Mouse gut microbiome data set are obtained from Leamy et al. [39] (Leamy LJ, Kelly SA, Nietfeldt J, Legge RM, Ma F, et al. (2014) Host genetics and diet, but not immunoglobulin A expression, converge to shape compositional features of the gut microbiome in an advanced intercross population of mice. Genome Biol 15: 552).
Authors’contributions
NY developed the idea, the method, and the software. XZ performed simulation studies and real data analysis. XZ and NY drafted the manuscript. HM, ZT, LZ, XC and AKB revised the manuscript, and discussed the project with NY as it progressed and commented on various drafts of the manuscript. AKB provided and organized the real data. All authors read and approved the final manuscript.
Competing interests
The authors declare that they have no competing interests.
Consent for publication
Not applicable.
Ethics approval and consent to participate
Not applicable.
Author details
1
Department of Biostatistics, University of Alabama at Birmingham, Birmingham, AL 35294-0022, USA.2Department of Biostatistics, Harvard T.H.
Chan School of Public Health, Boston, MA 02115, USA.3Program in Medical
and Population Genetics, the Broad Institute, Cambridge, MA 02142, USA.
4
Department of Biostatistics, School of Public Health, Medical College of Soochow University, Suzhou 215123, China.5Department of Food Science
and Technology and Core for Applied Genomics and Ecology, University of Nebraska, Lincoln, NE 68583, USA.
Received: 26 August 2016 Accepted: 21 December 2016
References
1. Matsen FA, Kodner RB, Armbrust EV. pplacer: linear time maximum-likelihood and Bayesian phylogenetic placement of sequences onto a fixed reference tree. BMC Bioinf. 2010;11:538.
2. Gilbert JA, Meyer F, Bailey MJ. The future of microbial metagenomics (or is ignorance bliss?). ISME J. 2011;5(5):777–9.
3. Ghodsi M, Liu B, Pop M. DNACLUST: accurate and efficient clustering of phylogenetic marker genes. BMC Bioinf. 2011;12:271.
4. Cho I, Blaser MJ. The human microbiome: at the interface of health and disease. Nat Rev Genet. 2012;13(4):260–70.
5. Wooley JC, Ye Y. Metagenomics: facts and artifacts, and computational challenges*. J Comput Sci Technol. 2009;25(1):71–81.
6. Hugenholtz P. Exploring prokaryotic diversity in the genomic era. Genome Biol. 2002;3(2):REVIEWS0003.
7. Knights D, Parfrey LW, Zaneveld J, Lozupone C, Knight R. Human-associated microbial signatures: examining their predictive value. Cell Host Microbe. 2011;10(4):292–6.
8. Virgin HW, Todd JA. Metagenomics and personalized medicine. Cell. 2011; 147(1):44–56.
9. Collison M, Hirt RP, Wipat A, Nakjang S, Sanseau P, Brown JR. Data mining the human gut microbiota for therapeutic targets. Brief Bioinform. 2012; 13(6):751–68.
10. Segata N, Izard J, Waldron L, Gevers D, Miropolsky L, Garrett WS, Huttenhower C. Metagenomic biomarker discovery and explanation. Genome Biol. 2011;12(6):R60.
11. Spor A, Koren O, Ley R. Unravelling the effects of the environment and host genotype on the gut microbiome. Nat Rev Microbiol. 2011;9(4):279–90.
12. Goodrich JK, Davenport ER, Waters JL, Clark AG, Ley RE. Cross-species comparisons of host genetic associations with the microbiome. Science. 2016;352(6285):532–5.
13. Goodrich JK, Davenport ER, Beaumont M, Jackson MA, Knight R, Ober C, Spector TD, Bell JT, Clark AG, Ley RE. Genetic determinants of the gut microbiome in UK twins. Cell Host Microbe. 2016;19(5):731–43.
14. Blekhman R, Goodrich JK, Huang K, Sun Q, Bukowski R, Bell JT, Spector TD, Keinan A, Ley RE, Gevers D, et al. Host genetic variation impacts microbiome composition across human body sites. Genome Biol. 2015;16:191. 15. De Filippo C, Cavalieri D, Di Paola M, Ramazzotti M, Poullet JB, Massart S,
Collini S, Pieraccini G, Lionetti P. Impact of diet in shaping gut microbiota revealed by a comparative study in children from Europe and rural Africa. Proc Natl Acad Sci U S A. 2010;107(33):14691–6.
16. Wu GD, Chen J, Hoffmann C, Bittinger K, Chen YY, Keilbaugh SA, Bewtra M, Knights D, Walters WA, Knight R, et al. Linking long-term dietary patterns with gut microbial enterotypes. Science. 2011;334(6052):105–8. 17. Biagi E, Nylund L, Candela M, Ostan R, Bucci L, Pini E, Nikkila J, Monti D,
Satokari R, Franceschi C, et al. Through ageing, and beyond: gut microbiota and inflammatory status in seniors and centenarians. PLoS One. 2010;5(5): e10667.
18. Turnbaugh PJ, Hamady M, Yatsunenko T, Cantarel BL, Duncan A, Ley RE, Sogin ML, Jones WJ, Roe BA, Affourtit JP, et al. A core gut microbiome in obese and lean twins. Nature. 2009;457(7228):480–4.
19. Dominguez-Bello MG, Costello EK, Contreras M, Magris M, Hidalgo G, Fierer N, Knight R. Delivery mode shapes the acquisition and structure of the initial microbiota across multiple body habitats in newborns. Proc Natl Acad Sci U S A. 2010;107(26):11971–5.
20. Turnbaugh PJ, Ley RE, Mahowald MA, Magrini V, Mardis ER, Gordon JI. An obesity-associated gut microbiome with increased capacity for energy harvest. Nature. 2006;444(7122):1027–31.
21. Samuel BS, Gordon JI. A humanized gnotobiotic mouse model of host-archaeal-bacterial mutualism. Proc Natl Acad Sci U S A. 2006;103(26):10011–6. 22. Frank DN, St Amand AL, Feldman RA, Boedeker EC, Harpaz N, Pace NR.
Molecular-phylogenetic characterization of microbial community imbalances in human inflammatory bowel diseases. Proc Natl Acad Sci U S A. 2007;104(34):13780–5.
23. Holmes E, Li JV, Athanasiou T, Ashrafian H, Nicholson JK. Understanding the role of gut microbiome-host metabolic signal disruption in health and disease. Trends Microbiol. 2011;19(7):349–59.
24. Wagner BD, Robertson CE, Harris JK. Application of two-part statistics for comparison of sequence variant counts. PLoS One. 2011;6(5):e20296. 25. Paulson JN, Stine OC, Bravo HC, Pop M. Differential abundance analysis for
microbial marker-gene surveys. Nat Methods. 2013;10(12):1200–2. 26. Robinson MD, Oshlack A. A scaling normalization method for differential
expression analysis of RNA-seq data. Genome Biol. 2010;11(3):R25. 27. Anders S, Huber W. Differential expression analysis for sequence count data.
Genome Biol. 2010;11(10):R106.
28. White JR, Nagarajan N, Pop M. Statistical methods for detecting differentially abundant features in clinical metagenomic samples. PLoS Comput Biol. 2009;5(4):e1000352.
29. Xu L, Paterson AD, Turpin W, Xu W. Assessment and selection of competing models for zero-inflated microbiome data. PLoS One. 2015;10(7):e0129606. 30. Sohn MB, Du R, An L. A robust approach for identifying differentially abundant
features in metagenomic samples. Bioinformatics. 2015;31(14):2269–75. 31. Peng X, Li G, Liu Z. Zero-inflated beta regression for differential abundance
analysis with metagenomics data. J Comput Biol. 2015;23(2):102–10. 32. Romero R, Hassan SS, Gajer P, Tarca AL, Fadrosh DW, Nikita L, Galuppi M,
Lamont RF, Chaemsaithong P, Miranda J, et al. The composition and stability of the vaginal microbiota of normal pregnant women is different from that of non-pregnant women. Microbiome. 2014;2(1):4.
33. Benson AK, Kelly SA, Legge R, Ma F, Low SJ, Kim J, Zhang M, Oh PL, Nehrenberg D, Hua K, et al. Individuality in gut microbiota composition is a complex polygenic trait shaped by multiple environmental and host genetic factors. Proc Natl Acad Sci U S A. 2010;107(44):18933–8. 34. Srinivas G, Moller S, Wang J, Kunzel S, Zillikens D, Baines JF, Ibrahim SM.
Genome-wide mapping of gene-microbiota interactions in susceptibility to autoimmune skin blistering. Nat Commun. 2013;4:2462.
35. Wang J, Kalyan S, Steck N, Turner LM, Harr B, Kunzel S, Vallier M, Hasler R, Franke A, Oberg HH, et al. Analysis of intestinal microbiota in hybrid house mice reveals evolutionary divergence in a vertebrate hologenome. Nat Commun. 2015;6:6440.
36. Yatsunenko T, Rey FE, Manary MJ, Trehan I, Dominguez-Bello MG, Contreras M, Magris M, Hidalgo G, Baldassano RN, Anokhin AP, et al. Human gut microbiome viewed across age and geography. Nature. 2012;486(7402):222–7. 37. La Rosa PS, Warner BB, Zhou Y, Weinstock GM, Sodergren E, Hall-Moore CM,
Stevens HJ, Bennett Jr WE, Shaikh N, Linneman LA, et al. Patterned progression of bacterial populations in the premature infant gut. Proc Natl Acad Sci U S A. 2014;111(34):12522–7.
38. Faust K, Lahti L, Gonze D, de Vos WM, Raes J. Metagenomics meets time series analysis: unraveling microbial community dynamics. Curr Opin Microbiol. 2015;25:56–66.
39. Leamy LJ, Kelly SA, Nietfeldt J, Legge RM, Ma F, Hua K, Sinha R, Peterson DA, Walter J, Benson AK, et al. Host genetics and diet, but not
immunoglobulin A expression, converge to shape compositional features of the gut microbiome in an advanced intercross population of mice. Genome Biol. 2014;15:552.
40. Chen EZ, Li H. A two-part mixed-effects model for analyzing longitudinal microbiome compositional data. Bioinformatics. 2016.
41. Gelman A, Carlin JB, Stern HS, Dunson DB, Vehtari A, Rubin DB. Bayesian data analysis, third edition. New York: Chapman & Hall/CRC Press; 2014. 42. McCulloch CE, Searle SR. Generalized, Linear, and Mixed Models. New York:
John Wiley & Sons; 2001.
43. Pinheiro JC, Bates DC. Mixed-effects models in S and S-PLUS. New York: Springer Verlag; 2000.
44. Venables WN, Ripley BD. Modern applied statistics with S. New York: Springer; 2002.
45. Schall R. Estimation in generalized linear models with random effects. Biometrika. 1991;78:719–27.
46. Breslow NE, Clayton DC. Approximate inference in generalized linear mixed models. J Am Stat Assoc. 1993;88:9–25.
47. McCullagh P, Nelder JA. Generalized linear models. London: Chapman and Hall; 1989.
48. Saha K, Paul S. Bias-corrected maximum likelihood estimator of the negative binomial dispersion parameter. Biometrics. 2005;61(1):179–85.
49. McMurdie PJ, Holmes S. Waste not, want not: why rarefying microbiome data is inadmissible. PLoS Comput Biol. 2014;10(4):e1003531.
50. Chen J, Li H. Variable selection for sparse dirichlet-multinomial regression with an application to microbiome data analysis. Ann Stat. 2013;7(1):418–42. 51. Clarke SF, Murphy EF, Nilaweera K, Ross PR, Shanahan F, O’Toole PW, Cotter
PD. The gut microbiota and its relationship to diet and obesity: new insights. Gut microbes. 2012;3(3):186–202.
52. Yang J, Bindels LB, Segura Munoz RR, Martinez I, Walter J, Ramer-Tait AE, Rose DJ. Disparate metabolic responses in mice fed a high-fat diet supplemented with maize-derived non-digestible feruloylated oligo- and polysaccharides are linked to changes in the gut microbiota. PLoS One. 2016;11(1):e0146144.
53. Etxeberria U, Arias N, Boque N, Macarulla MT, Portillo MP, Milagro FI, Martinez JA. Shifts in microbiota species and fermentation products in a dietary model enriched in fat and sucrose. Benefic Microbes. 2015;6(1):97–111.
54. Louis S, Tappu RM, Damms-Machado A, Huson DH, Bischoff SC. Characterization of the gut microbial community of obese patients following a weight-loss intervention using whole metagenome shotgun sequencing. PLoS One. 2016;11(2):e0149564.
55. Murphy EF, Cotter PD, Healy S, Marques TM, O’Sullivan O, Fouhy F, Clarke SF, O’Toole PW, Quigley EM, Stanton C, et al. Composition and energy harvesting capacity of the gut microbiota: relationship to diet, obesity and time in mouse models. Gut. 2010;59(12):1635–42.
56. Clavel T, Desmarchelier C, Haller D, Gerard P, Rohn S, Lepage P, Daniel H. Intestinal microbiota in metabolic diseases: from bacterial community structure and functions to species of pathophysiological relevance. Gut microbes. 2014;5(4):544–51.
57. Schulz MD, Atay C, Heringer J, Romrig FK, Schwitalla S, Aydin B, Ziegler PK, Varga J, Reindl W, Pommerenke C, et al. High-fat-diet-mediated dysbiosis promotes intestinal carcinogenesis independently of obesity. Nature. 2014; 514(7523):508–12.
58. Million M, Angelakis E, Maraninchi M, Henry M, Giorgi R, Valero R, Vialettes B, Raoult D. Correlation between body mass index and gut concentrations of Lactobacillus reuteri, Bifidobacterium animalis, Methanobrevibacter smithii and Escherichia coli. Int J Obes (Lond). 2013;37(11):1460–6.
59. Fenollar F, Nicoli F, Paquet C, Lepidi H, Cozzone P, Antoine JC, Pouget J, Raoult D. Progressive dementia associated with ataxia or obesity in patients with Tropheryma whipplei encephalitis. BMC Infect Dis. 2011;11:171.
60. Yan H, Potu R, Lu H, Vezzoni de Almeida V, Stewart T, Ragland D, Armstrong A, Adeola O, Nakatsu CH, Ajuwon KM. Dietary fat content and fiber type modulate hind gut microbial community and metabolic markers in the pig. PLoS One. 2013;8(4):e59581.
61. Graf D, Di Cagno R, Fak F, Flint HJ, Nyman M, Saarela M, Watzl B. Contribution of diet to the composition of the human gut microbiota. Microb Ecol Health Dis. 2015;26:26164.
62. Lecomte V, Kaakoush NO, Maloney CA, Raipuria M, Huinao KD, Mitchell HM, Morris MJ. Changes in gut microbiota in rats fed a high fat diet correlate with obesity-associated metabolic parameters. PLoS One. 2015;10(5): e0126931.
63. Ley RE, Lozupone CA, Hamady M, Knight R, Gordon JI. Worlds within worlds: evolution of the vertebrate gut microbiota. Nat Rev Microbiol. 2008; 6(10):776–88.
64. Ochman H, Worobey M, Kuo CH, Ndjango JB, Peeters M, Hahn BH, Hugenholtz P. Evolutionary relationships of wild hominids recapitulated by gut microbial communities. PLoS Biol. 2010;8(11):e1000546.
65. Li Y, Ismail AI, Ge Y, Tellez M, Sohn W. Similarity of bacterial populations in saliva from African-American mother-child dyads. J Clin Microbiol. 2007; 45(9):3082–5.
66. Li Y, Caufield PW, Dasanayake AP, Wiener HW, Vermund SH. Mode of delivery and other maternal factors influence the acquisition of Streptococcus mutans in infants. J Dent Res. 2005;84(9):806–11. 67. Robinson MD, McCarthy DJ, Smyth GK. edgeR: a Bioconductor package for
differential expression analysis of digital gene expression data. Bioinformatics. 2010;26(1):139–40.
• We accept pre-submission inquiries
• Our selector tool helps you to find the most relevant journal
• We provide round the clock customer support
• Convenient online submission
• Thorough peer review
• Inclusion in PubMed and all major indexing services
• Maximum visibility for your research Submit your manuscript at
www.biomedcentral.com/submit