Investigation of a New
Generation of FCC Compliant
NDT Devices for Pavement
Layer Information Collection -
Test Procedure and Facility
Technical Report 0-4820-2
Performed in Cooperation with the
Texas Department of Transportation
and the Federal Highway Administration
Project Number 0-4820
By
Richard Liu
Jing Li
Xuemin Chen
Aditya Ekbote
Huichun Xing
Ying Wang
Subsurface Sensing Laboratory
Department of Electrical and Computer Engineering
University of Houston
URL: http://subsurface.ee.uh.edu/documents/0-4820-2.pdf
Correlation of Texas Cone
Penetrometer Test Values and Shear
Strength of Texas Soils:
Technical Report
TxDOT Project Report
No. 0-4862-1
Final Report
Texas Department of Transportation
and
Federal Highway Administration
by
C. Vipulanandan Ph.D., P.E.
A. J. Puppala Ph.D., P.E.
M. Jao Ph.D., P.E.
M.S. Kim
H. Vasudevan
P. Kumar
and
Y. L. Mo Ph.D.
I G M A T C 1994Center for Innovative Grouting Materials and Technology (CIGMAT)
Department of Civil and Environmental Engineering University of Houston
Houston, Texas 77204-4003 Report No. CIGMAT/UH 2007-4
Technical Report Documentation Page
1. Report No.
FHWA/TX-08/0-4862-1
2. Government Accession No. 3. Recipient's Catalog No. 5. Report Date
August 2006
Published: February 2008
4. Title and Subtitle
CORRELATION OF TEXAS CONE PENETROMETER TEST VALUES AND SHEAR STRENGTH OF TEXAS SOILS:
TECHNICAL REPORT 6. Performing Organization Code
7. Author(s)
Vipulanandan, C., Puppala, A.J., Jao, M., Kim, M.S., Vasudevan, H.,
Kumar, P., and Mo, Y. L.
8. Performing Organization Report No.
Report 0-4862-1
10. Work Unit No. (TRAIS) 9. Performing Organization Name and Address
University of Houston
Department of Civil and Environmental Engineering N107 Engineering Building 1
Houston, Texas 77204-4003
11. Contract or Grant No.
Project 0-4862
13. Type of Report and Period Covered
Technical Report
1 Sep 2004 - 31 Aug 2006
12. Sponsoring Agency Name and Address
Texas Department of Transportation
Research and Technology Implementation Office P. O. Box 5080
Austin, Texas 78763-5080 14. Sponsoring Agency Code
15. Supplementary Notes
Project performed in cooperation with the Texas Dept. of Transportation and the Federal Hwy. Admin.
Project Title: Correlation of Texas Cone Penetrometer Test Values and Shear Strength of Texas Soils URL: http://tti.tamu.edu/documents/0-4862-1.pdf
16. Abstract
This report discusses the correlation of Texas Cone Penetrometer (TCP) test values and shear strength of Texas soils. Data collected over the past decade by the Texas Department of Transportation (TxDOT) from several parts of Texas were used to verify the current correlation between TCP blow count and the undrained shear strengths of clays with higher (CH) and low liquid limits (CL), sandy clay (SC) and Other soils. Over 4000 sets of data were used to verify the current TxDOT relationships for the entire state of Texas and three TxDOT districts from where most of the data were collected. Limited field studies were performed to verify the current TxDOT relationship with CH and CL soils. Based on the data available and statistical analyses, linear and nonlinear relationships between undrained shear strength of soil and TCP blow count have been developed. The statistical parameters including the probability distribution functions (PDF) for the undrained
shear strength (Su) and TCP blow count (NTCP ) based on the type of soil were determined. Analyses showed
that the current TxDOT design relationships overestimated the undrained shear strength (Su ) and TCP blow count (NTCP ) was dependent on the depth for all types of soils investigated. The depth dependency also varied from location to location. The undrained shear strength versus TCP blow count relationships developed were
also influenced by the locations.
17. Key Words
Correlations, Shear Strength, Soils, Statistical Analyses, Texas Cone Penetrometer
18. Distribution Statement
No restrictions. This document is available to the public through NTIS:
National Technical Information Service 5285 Port Royal Road
Springfield, Virginia 22161
Correlation of Texas Cone Penetrometer Test Values
and Shear Strength of Texas Soils: Technical Report
TxDOT Project Report No.
0-4862-1
Final Report
Texas Department of Transportation
and
Federal Highway Administration
by
C. Vipulanandan Ph.D., P.E.
A. J. Puppala Ph.D., P.E.
M. Jao Ph.D., P.E.
M.S. Kim
H. Vasudevan
P. Kumar
and
Y. L. Mo Ph.D.
I G M A T C 1994Center for Innovative Grouting Materials and Technology (CIGMAT) Department of Civil and Environmental Engineering
University of Houston Houston, Texas 77204-4003 Report No. CIGMAT/UH 2007-4
August 2006
ENGINEERING DISCLAIMER
The contents of this report reflect the views of the authors, who are responsible for the facts and the accuracy of the data presented herein. The contents do not necessarily reflect the official views or policies of the Texas Department of Transportation. This report does not constitute a standard or a regulation.
There was no art, method, process, or design which may be patentable under the patent laws of the United States of America or any foreign country.
PREFACE
In Texas, the Texas Cone Penetrometer (TCP) test is conducted during foundation exploration. Since the TCP test is routinely carried out and required for investigation of foundation materials encountered during geotechnical exploration for TxDOT projects, a large amount of data from this test are available.
Correlations based on the test values could be very useful to engineers to determine the undrained shear strength of the soil and limited research was done in the
mid 1970s to correlate the TCP blow count (NTCP) to the undrained shear strength of soil
(Su). These studies were performed in the upper Gulf Coast region with limited number
of data. Hence, in order to verify the current correlations for soils from different regions of Texas, a research study was initiated at three universities: The University of Houston, Lamar University and The University of Texas at Arlington.
The main objective of this study was to verify the current design relationship used by TxDOT to determine the undrained shear strength of soil from TCP blow count and, if necessary, develop correlations based on the data collected.
In this study, Texas was divided into three sectors to collect the data and the data were collected from TxDOT projects over the past decade (1994 - 2004) and analyzed. Over 4000 sets of data were collected on CH, CL, SC and Other soil types and used in the analyzes. Collected data were verified with the current TxDOT relationships for each soil type for the entire state and for a few TxDOT districts with large amounts of data. Data were statistically analyzed for each blow count. Linear and nonlinear relationships between TCP blow count and undrained shear strength have been developed. Depth effect (influenced by geology and active zone) on blow count and shear strength was investigated.
This report summarizes the verification of the current TxDOT design relationships and developed new relationships between the undrained shear strength of various soils and TCP blow count based on the data collected by TxDOT.
ABSTRACT
Since the Texas Cone Penetrometer (TCP) tests are routinely performed during any foundation exploration for the Texas Department of Transportation (TxDOT), a large amount of data has been collected over the past decades. Correlations based on the blow counts and soil types are currently used to determine the undrained shear strength of the soils. Limited research was done in the mid 1970s to correlate the TCP blow counts to the undrained shear strength of soil, especially for soil in the Upper Gulf Coast region.
In this study, data collected over the past decade by TxDOT were used to verify the current correlations between the TCP blow count and the undrained shear strengths of CH, CL, SC and Other soils. Over 4000 sets of data were used to verify the current TxDOT relationships and the data were collected from four TxDOT districts. Limited field studies were performed to verify the current TxDOT relationship with CH and CL soils.
Analysis of the data showed that, as compared to other soils, CL soils had better correlation with the current TxDOT Method. Based on the data available and statistical analyses, linear and nonlinear relationships between the undrained shear strength of soil and the TCP blow count have been developed. The statistical parameters including the
probability distribution functions (PDF) for the undrained shear strength (Su) and TCP
blow count (NTCP) based on the type of soils were determined. Based on the analysis of
data for every TCP blow count (NTCP), the predominant probability distribution function
(PDF) for Su was lognormal. Analysis of the data also showed that the depth affected the
TCP blow count. Validation analysis with about 1% of the data (about 50 data sets) collected from this study showed that the TxDOT relationship over predicted the least amount of data compared to the other relationships investigated in this study.
The study was completed in two years and was a joint effort among researchers at University of Houston, University of Texas at Arlington and Lamar University.
SUMMARY
The Texas Cone Penetrometer (TCP) is a sounding test similar to the Standard Penetration Test (SPT) and Cone Penetration Test (CPT) used to determine the in situ soil parameters for foundation design. In the case of the TCP test, the potential energy resulting from the hammer impact is similar to the SPT test. The cone shape and apex angle of the TCP are similar to the CPT but the diameter is larger. Therefore, it can be stated that the TCP is a hybrid of the SPT and the CPT, and can be used in all types of soils. The TCP test is a standardized test procedure currently used by the Texas Department of Transportation (TxDOT) for geotechnical studies to indirectly estimate the in situ undrained shear strength of soils (TxDOT Geotechnical Manual, 2000).
The objective of this project was to verify the current design relationship used by TxDOT to determine the undrained shear strength of soil from TCP blow count and to develop correlations with high level of confidence based on the data collected. The parameters investigated were soil types, depth and locations. The objectives were achieved by collecting data from TxDOT projects over the past decade (1994 - 2004) by three universities—The University of Houston, Lamar University and University of Texas at Arlington—together with limited field study and laboratory tests on the soil
samples collected for the field. Over 4,000 data sets (TCP blow count ( NTCP ) and
undrained shear strength (Su) were collected from 3,987 bore holes from past TxDOT
projects. The cumulative length of the bore holes was 177,298 ft. Of the over 4,000 data sets, 2,100 data sets were identified as CH soils, 1,852 data sets were identified as CL soils, 29 data sets were identified as SC soils, and 42 data sets were identified as Other soils.
Collected data were compared to the current TxDOT Su versus NTCP relationship
for each soil type and analyzed based on statistical methods and theoretical concepts in
this study. Also, limited tests were done to validate the data. The relationship between N1
and N2 was also investigated based on the soil type. A total of three approaches were
used to develop new correlations between Su versusNTCP . The first attempt was to
average strength (Su) for each TCP blow count (NTCP), and in the final attempt depth
effect on the mean NTCP (NTCP) and mean Su (Su) was considered.
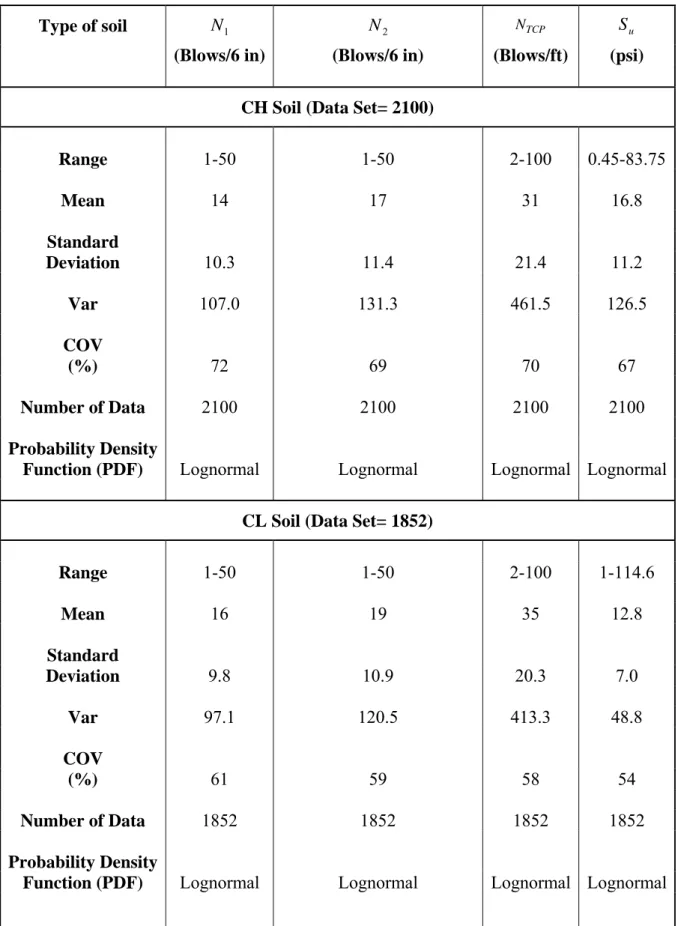
All the analyses were based on soil type. For the CH soil, based on 2100 data sets,
the undrained shear strength (Su) varied from 0.45 to 88.75 psi with a mean of 16.8 psi.
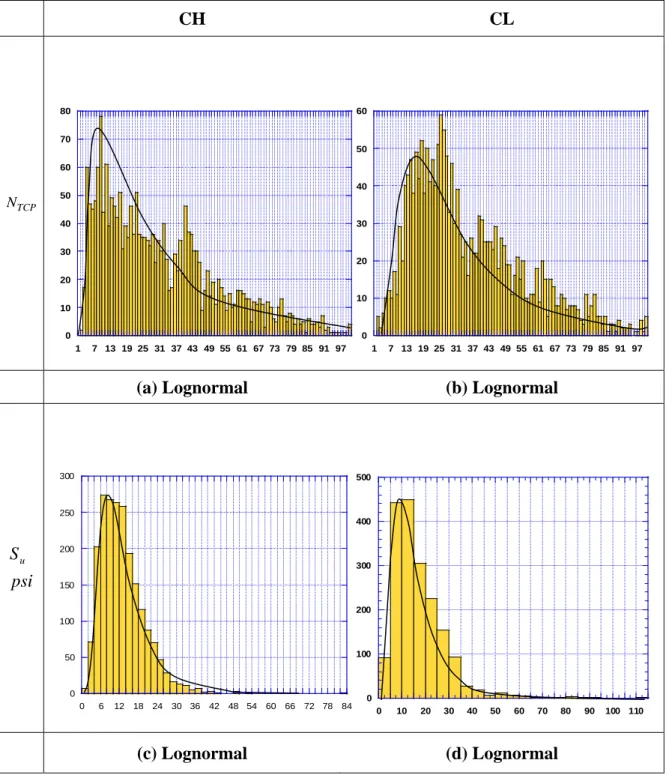
The coefficient of variation (COV) was 67%, which was the highest for the soils investigated in this study. The probability distribution function (PDF) for the undrained
shear strength (Su) was lognormal. The TCP blow count (NTCP) varied from 2 to 100 with
a mean of 31. The COV was 70%, which was the highest for the soils investigated in this
study. The PDF for the TCP blow count ( NTCP ) was lognormal. Current TxDOT
relationship over predicted 59% of the data for the CH soils. For the CL soil, based on
1852 data set, the undrained shear strength (Su) varied from 0.96 to 114.6 psi with a
mean of 12.9 psi. The COV was 54%, which was the lowest for the soils investigated in
this study. The PDF for the undrained shear strength (Su) was lognormal. The TCP blow
count (NTCP) varied from 2 to 100 with a mean of 35. The COV was 58%. The PDF for
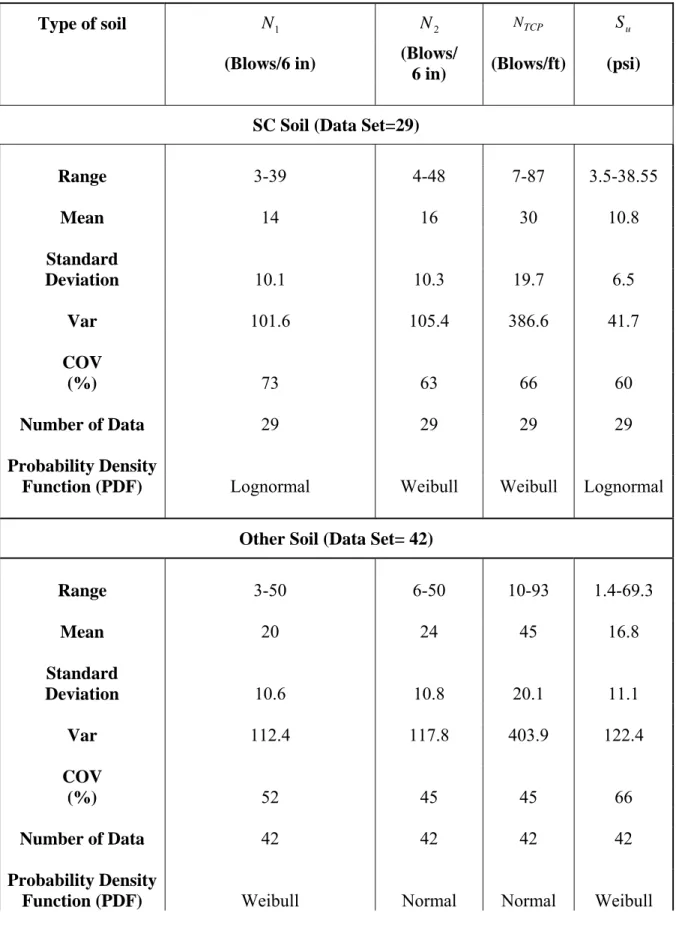
the TCP blow count (NTCP) was lognormal. For the SC soil, based on 29 data set, the
undrained shear strength (Su) varied from 3.5 to 38.55 psi with a mean of 10.8 psi. The
COV was 60%. The PDF for the undrained shear strength (Su) was lognormal. The TCP
blow count (NTCP) varied from 7 to 87 with a mean of 30. The COV was 66%. The PDF
for the TCP blow count (NTCP) was Weibull. For the other soil, based on 42 data set, the
undrained shear strength (Su) varied from 1.4 to 69.3 psi with a mean of 16.8 psi. The
COV was 66%. The PDF for the undrained shear strength (Su) was Weibull. The TCP
blow count (NTCP) varied from 10 to 93 with a mean of 45. The COV was 45%, which
was the lowest for the soils investigated in this study. The PDF for the TCP blow count
(NTCP) was normal.
Based on the analyses of raw data and average values, linear and nonlinear relationships were developed from three attempts. Analyses showed that the current
TxDOT design relationships overestimated the undrained shear strength (Su) and TCP
dependency also varied from location to location. The undrained shear strength versus TCP blow count relationships developed were also influenced by the locations.
RESEARCH STATEMENT
This research project was to verify the current correlations used by TxDOT to determine the undrained shear strength of soils using the Texas Cone Penetrometer blow counts. Over 4000 data sets collected over the past decade were used in this study. Based on this study, the current TCP correlation better predicted the undrained shear strength of CL soils compared to the other soils.
This report will serve as a guidance document for TxDOT engineers on using the Texas Cone Penetrometer blow count to better predict the shear strength of soils in Texas using the correlations developed in this study. Also, local correlations have been developed for a few areas.
TABLE OF CONTENTS
Page
LIST OF FIGURES ... xv
LIST OF TABLES... xix
CHAPTER 1. INTRODUCTION ... 1
1.1 Introduction... 1
1.2 Research Objectives... 2
1.3 Organization... 3
CHAPTER 2. LITERATURE REVIEW ... 5
2.1 Introduction... 5
2.2 Penetrometers... 8
2.2.1 Standard Penetration Test (SPT)... 9
2.2.2 Cone Penetration Test (CPT) ... 10
2.2.3 Texas Cone Penetrometer (TCP) ... 10
2.3 TCP and Shear Strength... 14
2.4 Review of Past Research on TCP ... 15
2.5 Texas Geology ... 18
2.5.1 Houston-Beaumont Area ... 18
2.5.2 Dallas-Forth Worth Area ... 21
2.6 Summary... 23
CHAPTER 3. DATA COLLECTION AND ANALYSIS... 25
3.1 Database System ... 25
3.1.2 Data Collected... 31
3.1.3 TCP and Shear Strength Data ... 34
3.2 Data Correlation... 39
3.2.1 Total Soil Data Analysis ... 44
3.2.2 Local Soil Data Analysis for Houston District ... 47
3.2.3 Local Soil Data Analysis for Beaumont District ... 54
3.2.4 Local Soil Data Analysis for Dallas-Fort Worth District ... 57
3.3 Comparison of Correlations... 61
3.4 Validation... 61
3.4.1 Houston District... 61
3.4.2 Dallas-Fort Worth District ... 64
3.5 Relationships between N1 and N2... 67
3.5.1 Total Soil Data Analysis ... 67
3.5.2 Local Data Analysis for Houston District... 71
3.5.3 Local Data Analysis for Beaumont District... 73
3.5.4 Local Data Analysis for Dallas-Fort Worth District... 74
3.6 Summary... 76
CHAPTER 4. STATISTICAL ANALYSIS ... 81
4.1 Total Soil Data Analysis ... 83
4.1.1 Total CH Soil ... 83
4.1.2 Total CL Soil... 85
4.1.3 Total SC Soil... 86
4.2 Local Soil Data Analysis ... 91
4.2.1. Houston District... 91
(a) Houston CH Soil... 94
(b) Houston CL Soil... 95
(c) Houston SC and OTHER Soils... 96
4.2.2 Beaumont District ... 97
(a) Beaumont CH Soil... 97
(b) Beaumont CL Soil... 100
4.2.3 Dallas-Fort Worth district ... 101
(a) Dallas-Fort Worth CH Soil... 101
(b) Dallas-Fort Worth CL Soil... 103
4.3 Mean Undrained Shear Strength (Su) Analysis... 104
4.3.1 Total Data Analysis... 104
4.3.2 Local Data Analysis (Houston District):... 111
4.3.3 Local Data Analysis (Beaumont district)... 113
4.3.4 Local Data Analysis (Dallas-Fort Worth District)... 115
4.4 Summary... 118
CHAPTER 5. DEPTH EFFECT ANALYSES ... 123
5.1 Factors Affecting Resistance to Penetration, NTCP... 124
5.2 Depth Effect ... 125
5.3 Model-4... 127
5.4 Total Soil Data Analysis ... 128
5.4.2 CL Soil ... 132
5.4.3 SC Soil ... 136
5.4.4 OTHER Soil... 140
5.5 Local Data Analysis for Houston District... 144
5.5.1 CH Soil... 144
5.5.2 CL Soil ... 148
5.6 Local Data Analysis for Beaumont District... 153
5.6.1 CH Soil... 153
5.6.2 CL Soil ... 156
5.7 Local Data Analysis for Dallas-Fort Worth District... 161
5.7.1 CH Soil... 161
5.7.2 CL Soil ... 164
5.8 Summary... 169
CHAPTER 6. CONCLUSIONS AND RECOMMENDATIONS ... 173
6.1 Conclusions... 173
6.2 Recommendations... 179
LIST OF FIGURES
Page
Figure 2.1 Comparisons of Penetrometers (a) SPT, (b) CPT and (c) TCP... 6
Figure 2.2 Texas Cone Penetrometer (TCP)... 13
Figure 2.3 TCP Hammers (TxDOT Geotechnical Manual, 2000)... 14
Figure 2.4 Design Chart to Predict Shear Strength for Foundation Design Using - values; Presently Used by TxDOT (Geotechnical Manual, 2000)... 17
Figure 2.5 Texas Surface Geology... 22
Figure 3.1 Structure of the Data Model for SDBMS...25
Figure 3.2 Typical Drilling Log... 36
Figure 3.3 Texas Borehole Locations ... 38
Figure 3.4 Point Bearing Relationship; Presently Used by TxDOT (TxDOT Geotechnical Manual, 2000) ... 43
Figure 3.5 Correlation Between Su and NTCP for CH Soils (Total Soil Data) ... 48
Figure 3.6 Correlation Between Su and NTCP for CL Soils (Total Soil Data) ... 48
Figure 3.7 Correlation Between Su and NTCP for SC Soils (Total Soil Data)... 49
Figure 3.8 Correlation Between Su and NTCP for Other Soils (Total Soil Data)... 49
Figure 3.9 Correlation Between Su and NTCP for CH Soils (Houston Soil Data) ... 53
Figure 3.10 Correlation Between Su and NTCP for CL Soils (Houston Soil Data) ... 53
Figure 3.11 Correlation Between Su and NTCP for CH Soils (Beaumont Soil Data) ... 56
Figure 3.12 Correlation Between Su and NTCP for CL Soils (Beaumont Soil Data)... 56
Figure 3.13 Correlation Between Su and NTCP for CH Soils (Dallas and Fort Worth Soil Data)... 60
Figure 3.14 Correlation Between Su and NTCP for CL Soils (Dallas and Fort Worth Soil
Data)... 60
Figure 3.15 Possible Trends Observed...61
Figure 3.16 Data Validation (Houston District-CL Soil)... 63
Figure 3.17 Data Validation (Dallas District-CH Soil) ... 66
Figure 3.18 Data Validation (Dallas District-CL Soil)... 66
Figure 3.19 Correlation Between N1 and N2 for Total CH Soils... 69
Figure 3.20 Correlation Between N1 and N2 for Total CL Soils ... 69
Figure 3.21 Correlation Between N1 and N2 for Total SC Soils ... 70
Figure 3.22 Correlation Between N1 and N2 for Total OTHER Soils ... 70
Figure 3.23 Correlation Between N1 and N2 for Houston CH Soils... 72
Figure 3.24 Correlation Between N1 and N2 for Houston CL Soils ... 72
Figure 3.25 Correlation Between N1 and N2 for Beaumont CH Soils... 73
Figure 3.26 Correlation Between N1 and N2 for Beaumont CL Soils ... 74
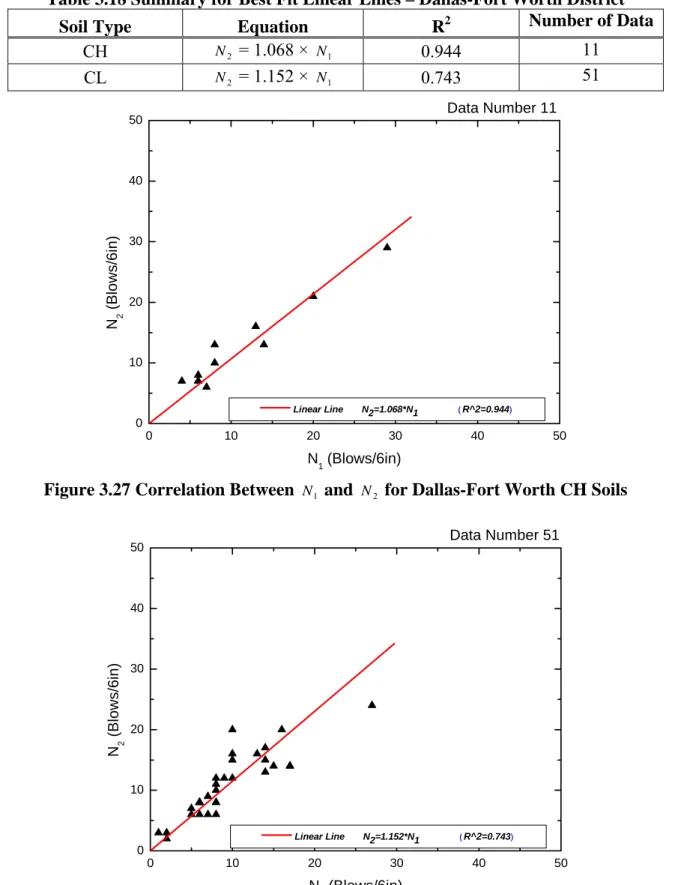
Figure 3.27 Correlation Between N1 and N2 for Dallas-Fort Worth CH Soils... 75
Figure 3.28 Correlation Between N1 and N2 for Dallas-Fort Worth CL Soils ... 75
Figure 4.1 Probability Distribution Functions for NTCP and Su of Total CH and CL Soil Data (a) NTCP for CH Soil (b) NTCP for CL Soil (c) Su (psi) for CH Soil and (d) Su (psi) for CL Soils ... 88
Figure 4.2 Probability Distribution Functions for NTCP and Su of Total SC and OTHER Soil Data (a) NTCP for SC Soil (b) NTCP for OTHER Soil (c) Su for SC Soil and (d) u S for OTHER Soils... 93
Figure 4.4 Variation of Mean Undrained Shear Strength (Su) with NTCPfor CL Soil ... 108
Figure 4.5 Variation of Mean Undrained Shear Strength (Su) with NTCP for SC Soil ... 109
Figure 4.6 Variation of Mean Undrained Shear Strength (Su) with NTCP for OTHER Soils... 110
Figure 4.7 Variation of Mean Undrained Shear Strength (Su)with NTCP for Houston CH Soils... 112
Figure 4.8 Variation of Mean Undrained Shear Strength (Su) with NTCP for Houston CL Soils... 112
Figure 4.9 Variation of Mean Undrained Shear Strength (Su)with NTCP for Beaumont CH Soils... 114
Figure 4.10 Variation of Mean Undrained Shear Strength (Su) with NTCP intervals for Beaumont CL Soil... 115
Figure 4.11 Variation of Mean Undrained Shear Strength (Su) with NTCP intervals for Dallas-Fort Worth CH Soil ... 117
Figure 4.12 Variation of Mean Undrained Shear Strength (Su)with NTCP intervals for Dallas-Fort Worth CL Soil... 117
Figure 5.1 Nine Possible CASES for Depth Effect ... 126
Figure 5.2 Variation of the NTCP and Su with depth for All (Total) the CH Soils... 129
Figure 5.3 Relationship between Mean NTCP and Mean Su for All the CH Soils ... 132
Figure 5.4 Variation of the NTCP and Su with Depth for All (Total) the CL Soils ... 133
Figure 5.5 Relationship between Mean NTCP and Mean Su for All the CL Soils... 136
Figure 5.7 Relationship between Mean NTCP and Mean Su for All the SC Soils ... 139
Figure 5.8 Variation of the NTCP and Su with Depth for All (Total) the Other Soils ... 141
Figure 5.9 Relationship between Mean NTCP and Mean Su for All the Other Soils... 142
Figure 5.10 Variation of the NTCP and Su with Depth for the Houston CH Soils ... 145
Figure 5.11 Relationship between Mean NTCP and Mean Su for the Houston CH Soils 148 Figure 5.12 Variation of the NTCP and Su with Depth for the Houston CL Soils... 149
Figure 5.13 Relationship between Mean NTCP and Mean Su for the Houston CL Soils 152 Figure 5.14 Variation of the NTCP and Su with Depth for the Beaumont CH Soils... 154
Figure 5.15 Relationship between Mean NTCP and Mean Su for the Beaumont CH Soils... 156
Figure 5.16 Variation of the NTCP and Su with Depth for the Beaumont CL Soils... 157
Figure 5.17 Relationship between Mean NTCP and Mean Su for the Beaumont CL Soils... 159
Figure 5.18 Variation of the NTCP and Su with Depth for the Dallas & Fort Worth CH Soil ... 162
Figure 5.19 Relationship between Mean NTCP and Mean Su for the Dallas & Fort Worth CH Soils ... 164
Figure 5.20 Variation of the NTCP and Su with Depth for the Dallas & Fort Worth CL Soil... 165
Figure 5.21 Relationship between Mean NTCP and Mean Su for the Dallas & Fort Worth CL Soils ... 167
LIST OF TABLES
Page
Table 2.1 Existing Correlations between SPT and TCP for Cohesionless Soils (Touma
and Reese (1969)) ... 11
Table 2.2 Existing Correlations between SPT and TCP for Cohesive Soils (Touma and Reese (1969)) ... 11
Table 2.3 Research Findings of the 1977 Research Report and Current Correlations ... 16
Table 2.4 Design Table to Predict Shear Strength for Foundation Design Using NTCP- values (Geotechnical Manual, 2000) ... 16
Table 3.1 Details of Table 1 of Soil Database for the Study ... 26
Table 3.2 Details of Table 2 of Soil Database for the Study ... 27
Table 3.3 Details of Table 3 of Soil Database for the Study ... 27
Table 3.4 Details of Table 4 of Soil Database for the Study ... 28
Table 3.5 Details of Table 5 of Soil Database for the Study ... 29
Table 3.6 Typical Soil Properties of Clay (TxDOT Geotechnical Manual, 2000) ... 32
Table 3.7 Details on Data Collected from various Districts ... 32
Table 3.8 Model Comparisons for Total Soil Data... 50
Table 3.9 Model Comparisons for Houston Soil Data... 52
Table 3.10 Model Comparisons for Beaumont Soil Data... 57
Table 3.11 Model Comparisons for Dallas-Fort Worth Soil Data... 59
Table 3.12 Trend Observed in Various Locations ... 61
Table 3.13 Model Comparisons for Data Validation (Houston District-CL Soil)... 63
Table 3.15 Summary for Best Fit Linear Lines – Total Districts ... 68 Table 3.16 Summary for Best Fit Linear Lines – Houston District... 71 Table 3.17 Summary for Best Fit Linear Lines – Beaumont District... 73 Table 3.18 Summary for Best Fit Linear Lines – Dallas-Fort Worth District... 75
Table 4.1 Summary of the Total CH and CL Soil Data ... 87 Table 4.2 Summary of the Total SC and OTHER Soil Data ... 92
Table 4.3 Summary of the Houston CH and CL Soil Data... 98 Table 4.4 Summary of the Beaumont CH and CL Soil Data... 105 Table 4.5 Summary of the Dallas-Fort Worth CH and CL Soil Data... 106
Table 5.1 Statistical Analysis Summary –Total CH Soil (Depth in ft.)... 130 Table 5.2 Statistical Analysis Summary –Total CL Soil (Depth in ft.)... 134 Table 5.3 Statistical Analysis Summary –Total SC and OTHER Soil (Depth in ft.)... 138 Table 5.4 Model Comparisons for Total Soil Data... 143 Table 5.5 Statistical Analysis Summary –Houston CH Soil (Depth in ft.)... 146 Table 5.6 Statistical Analysis Summary –Houston CL Soil (Depth in ft.)...150
Table 5.7 Model Comparisons for Houston Soil Data... 152 Table 5.8 Model Comparisons for Beaumont Soil Data... 159
Table 5.9 Statistical Analysis Summary - Beaumont CH & CL Soil (Depth n ft.)... 160
Table 5.10 Model Comparisons for Dallas & Fort Worth Soil Data ... 167
Table 5.11 Statistical Analysis Summary –Dallas-Fort Worth
CHAPTER 1. INTRODUCTION
1.1 Introduction
For site investigation, in situ tests are increasingly used to determine soil properties for geotechnical analysis and design. The penetration resistances are used to classify and characterize subsoils. Based on the problem, substantial data can be obtained economically and in much shorter time using in situ devices, such as the standard penetration test (SPT), cone penetration test (CPT), dilatometer, pressure meter and field
vane shear (Bowles, 2002; Jimiolkowski, 1985; Kulhawy et al. 1983; and 1990).
The Texas Department of Transportation is currently using the Texas Cone Penetrometer (TCP) test, which is a sounding test similar to the SPT and CPT for determining the soil parameters in situ. In the case of the TCP test, the driving method is similar to SPT, and the shape of cone is similar to the CPT cone, but the diameter is larger than the CPT. Hence, it can be interpreted that the TCP is a hybrid of SPT and CPT. One advantage of the TCP test is that it can be used in both soil and rock.
In all foundation design, it is necessary to know the shear strength of soil. When it is not feasible to measure the necessary soil strength parameters directly, estimates will
have to be made from other available data, such as in situ tests (Kulhawy and Mayne,
1990). Numerous correlations between in situ tests such as Cone Penetration testing (CPT) and the Standard Penetration Test (SPT) and soil shear strength parameters have
been developed (Kulhawy and Mayne, 1990). Also, the Texas cone penetrometer test and
its correlations have been used to predict undrained shear strength of clayey soils. These correlations are useful as they provide a quick and simple way to determine soil shear strength without sampling and laboratory tests.
In the case of TCP, limited research was performed in 1974 and 1977 to develop
the correlations between NTCP-values and shear strength parameters. It should be noted
that these correlations were based on TCP tests conducted predominantly in the upper Gulf Coast region of Texas, with a small amount of data and empirical analysis. These correlations are currently used by TxDOT for geotechnical design of foundations, embankments and retaining walls. Hence the applicability of these correlations for soils in other regions in Texas must be verified and there is a need to continuously update the existing correlations with more recent test data. Hence, in order to verify the current correlations for soils from different regions of Texas, a research study was undertaken at three universities: The University of Houston, Lamar University and University of Texas at Arlington.
1.2 Research Objectives
The objective of this research study was to develop equations, with high level of
confidence to predict the undrained shear strength (Su) for soils in Texas based on TCP
blow count.
The objective was achieved in Six PHASES as follows.
Phase 1: Literature Review: Reports and papers on TCP were critically reviewed and analyzed. Since the SPT and CPT have similarity to TCP, relevant information on the SPT and CPT were collected and analyzed.
Phase 2: Collection of Data: Since TCP is used all around Texas, a large amount of data was available with TxDOT. Hence the state of Texas was divided into three sectors to collect the data and the data were saved on a single server.
Phase 3: Database Analysis and Plan for Field Study: Data were analyzed based on theoretical concepts and using statistical methods. Current TxDOT correlations between TCP and undrained shear strength of soil were verified and new relationships were developed.
Phase 4: Field Study and Laboratory Tests: A limited amount of control tests were performed to determine the repeatability of the TCP in various Texas soils. Also, laboratory tests were performed on undisturbed samples to verify the current TxDOT undrained shear strength correlations with high quality data.
Phase 5: Verification of Correlations: Current TxDOT relationships for CH, CL, SC and Other Soils were verified and linear and nonlinear relationships have been developed.
Phase 6: Final Report: All the information collected during this study was compiled into the final report.
This study was a joint effort between the University of Houston, University of Texas at Arlington and Lamar University. Each University collected data from a different region in Texas.
1.3 Organization
This report has been organized into six chapters. In Chapter 2, literature review
related the current study has been summarized. Other in situ methods used to characterize
the soils have been compared to the TCP method. In Chapter 3, collected data have been
summarized and verified with the current TxDOT relationships for CH, CL, SC and
Other Soils with data from the entire state and a few TxDOT districts. Variation of N1
types was investigated. In Chapter 4, data have been statistically analyzed for each blow count. Linear and nonlinear relationships between TCP blow count and mean undrained shear strength have been developed and the data were verified with the current TxDOT method. Depth effect (influenced by geology and active zone) on the TCP blow count
and shear strength was investigated in Chapter 5. Conclusions and recommendations are
CHAPTER 2. LITERATURE REVIEW
2.1 Introduction
Probing with rods through weak ground to locate a firmer stratum has been
practiced since 1917 (Meigh, 1987). Soil sounding or probing consists of forcing a rod
into the soil and observing the resistance to penetration. According to Hvorslev (1949),
the oldest and simplest form of soil sounding consisted of driving a rod into the ground by repeated blows of a hammer, where the number of blows (N) required per foot penetration of the rod was used as an index of penetration resistance and was correlated to the foundation response parameters. The numerical value of the correlation not only depended on the characteristic of the soil, but also on diameter, length and weight of probing devices in relation to weight and drop of the hammer. Variation of the resistance indicates dissimilar soil layers, and the numerical values of this resistance permit an
estimate of some of the physical and engineering properties of the strata (Hvorslev, 1949).
Use of the penetrometer evolved because of the need to acquire data from the
subsurface soils which were not obtainable by any other means (Hamoudi et al., 1974).
Considerable savings in time and cost are achieved by using in situ devices such as the standard penetration test (SPT), cone penetration test (CPT), dilatometer, pressuremeter,
and field vane shear depending on the type of project (Jamiolkowski et al., 1985).
The use of impact type hammer-driven cone penetrometers has been largely limited to drilling applications where standard drilling tools like split-spoon samplers
have been used as penetrometers (Swanson, 1950). Impact type hammer-driven
numerous sources of errors that occur during the test including equipment variability and poor correlations. Infrequent sampling in between dynamic penetrometer tests can also lead to sample disturbance.
(a) SPT (from ASTM D 1586) (b) CPT (from ASTM D 5778) Figure 2.1 Comparisons of Penetrometers (a) SPT, (b) CPT and (c) TCP
(c) TCP (from Tex-132-E)
Figure 2.1 Comparison of Penetrometers (a) SPT, (b) CPT and (c) TCP – Continued
On the other hand, static cone penetrometers provide relatively accurate test results and enhanced test repeatability. Static penetrometers provide continuous data.
However, they have been limited by their economic viability and their limitations in the
ranges of soil resistance that can be measured using them (Fritton, 1990; Vyn and
Raimbault, 1993).
2.2 Penetrometers
In the United States, the most commonly used penetration devices for soil related applications are the standard penetration test and the cone penetration test. One of the in situ tools commonly used for this process in the state of Texas by the Texas Department of Transportation is the Texas cone penetrometer.
The SPT originated in about 1927, has been in use for some 80 years. It is being used worldwide and is currently the most popular and economical means to obtain subsurface information. It is estimated that 85 to 90 % of conventional design in North
America is made using the SPT (Bowles, 2002; Marcuson, 1977; Mayne, 1984 and 1991;
and Meyerhof, 1956). The method has been standardized as an ASTM D1586 since 1958 with periodic revisions to date.
The CPT is now widely used in lieu of the SPT, particularly in soft clays, soft silts
and in fine to medium sand deposits (Jimiolkowski, 1985; Kulhawy, 1990; and Mayne,
1984). The test is not well adopted to gravel deposits or to stiff/hard cohesive deposits. This test has been standardized by ASTM as D 5778. The test consists of pushing a 35.6 mm diameter standard cone into the ground at a rate of 10 to 20 mm/s and recording the resistance. Because of the complexity of soil behavior, empirical correlations are used
extensively in evaluating soil parameters (Orchant et al., 1988; Robertson and
2.2.1 Standard Penetration Test (SPT)
The standard penetration test was developed around 1927, and is the most widely used dynamic penetration test in the United States. Since 1958, the SPT has been
standardized (ASTM method 1586 with periodic updates, Figure 2.1 (a)). SPT is an
economical means to obtain subsurface information. The test involves driving a standard split-barrel sampler into the soil and counting the number of blows (N) required for driving the sampler to a depth of 150 mm each, for a total of 300 mm. The test is stopped early in case of a refusal which may arise from the following conditions:
1. 50 blows are required for any 150 mm increment 2. 100 blows are obtained to drive 300 mm
3. 10 successive blows produce no advance in penetration
In 1996, Bowles estimated around 85-90% of conventional designs in North America were made using SPT. In 1961, Meigh and Nixon reported the results of various types of in situ tests at several sites and concluded that the SPT gave a reasonable, if not somewhat conservative, estimate of the allowable bearing capacity of fine sands. The results of the SPT can usually be correlated with the pertinent physical properties of sand
(Duderstadt, 1977). Peck, Hanson, and Thornburn (1953) reported a relationship between
the N value and the angle of shearing resistance of soil, φ′, which has been widely used
in foundation design procedures dealing with sands. Also, several researchers have reported a correlation between SPT N-values and unconfined compressive strength of
cohesive soils (Sowers and Sowers, 1951; Terzaghi and Peck, 1967; and United States
for TCP. SPT and TCP use 12 inch penetration to determine the blow count in soils. The refusal conditions used for SPT are the same as for TCP.
2.2.2 Cone Penetration Test (CPT)
The CPT was introduced in the Netherlands in 1932 and has been referred to as static penetration test, or quasi-static penetration test, or Dutch sounding test (Meigh,
1987) (Figure 2.1 (b)). The cone penetration test is used in lieu of the SPT in soft clays,
soft silts, and in fine to medium sand deposits (Kulhawy and Mayne, 1990). The test
consists of pushing a standard cone penetrometer with 60˚ apex angle into the ground at a
rate of 10 to 20 mm/s and then recording the resistances offered by the tip and cone sleeve. The test is not well adapted to gravel deposits and stiff/hard cohesive deposits
(Bowles, 1996). The CPT test has been standardized by the American Society of Testing and Materials as ASTM D 5778.
While the cone angle is 60˚ for both TCP and CPT, the diameter of the cone in
TCP was double that of CPT. Similar to CPT, no sample is recovered during the TCP test. Unlike CPT, soil sampling can be done in between TCP tests.
2.2.3 Texas Cone Penetrometer (TCP)
The Texas Cone Penetrometer is commonly used in site investigations by the
Texas Department of Transportation (Figure 2.1 (c) and Figure 2.2). The TCP test
involves driving a hardened conical point into soil and hard rock by dropping a 170 lb (77 kg) hammer a height of 2 feet (0.6 m) (Tex-132-E). From the soil test, a penetration
resistance or blow count (NTCP) is obtained which equals the number of blows of the
The relationship developed by Touma and Reese (1969) between SPT and TCP in
cohesive and cohesionless soils is summarized in Tables 2.1 and 2.2. The N values of
SPT and TCP at different soil density classifications are also summarized in these two tables.
Table 2.1 Existing Correlations between SPT and TCP for Cohesionless Soils (Touma and Reese (1969))
Table 2.2 Existing Correlations between SPT and TCP for Cohesive Soils (Touma and Reese (1969)) Soil Classification NSPT NTCP Relationship between SPT & TCP Very Loose 0 to 4 0 to 8 NSPT = 0.5 NTCP Loose 4 to 10 8 to 20 NSPT = 0.5 NTCP Medium 10 to 30 20 to 60 NSPT = 0.5 NTCP Dense 30 to 50 60 to 100 NSPT = 0.5 NTCP Very Dense > 50 > 100 NSPT = 0.5 NTCP Soil Classification NSPT NTCP Relationship between SPT & TCP Very Soft < 2 < 3 NSPT = 0.7 NTCP Soft to Medium 2 to 8 3 to 11 NSPT = 0.7 NTCP Stiff 8 to 15 11 to 21 NSPT = 0.7 NTCP Very Stiff 15 to 30 21 to 43 NSPT = 0.7 NTCP Hard > 30 > 43 NSPT = 0.7 NTCP
2.2.3.1 History and Development of TCP
According to the Geotechnical Manual (2000), TCP was developed by the bridge
foundation group in the bridge division with the help of several other divisions in TxDOT. This was an effort to bring consistency in soil testing to determine soil and rock load carrying capacity in foundation design, which was lacking prior to the 1940s. The first use of TCP dates back to 1949 and the correlation charts and test procedure was first published in the Foundation Exploration and Design Manual in the year 1956. These correlations were modified slightly in 1972 and 1982 based on accumulated load test data
for piling and drilled shafts (Geotechnical Manual, 2000).
2.2.3.2 TCP Equipment and Testing Procedure
The TCP test (Tex-132-E) is a standardized test procedure by TxDOT. The
apparatus is shown in Figures 2.1 (c) and 2.2 and the equipment needed to run the TCP
test is as follows:
a. Hammer, 170 ± 2 lb with a 24 ± 0.5 in. drop
b. Drill stem, sufficient to accomplish boring to the desired depth c. Anvil, threaded to fit the drill stem, and slotted to accept the hammer
d. TCP Cone (Conical driving point), 3 in. in diameter with a 2.50 in. long point. The driving point is to be manufactured from AISI 4142 steel. The point is to be heated in an electric oven for 1 hour at 1550 to 1600 degrees Fahrenheit. Point is plunged into approximately 25 gallons of tempering oil and moved continuously until adequately
(a) Actual view
(TxDOT Geotechnical Manual, 2000)
(b) Texas Cone Schematic
(c) Details of the Texas Cone Penetrometer (Not to Scale) Figure 2.2 Texas Cone Penetrometer (TCP)
170 lb. Hammer
Drill Stem
TCP Anvil
24 inch Hammer Drop
60˚
TCP Cone
(a) Fully Automatic (b) Automatic Trip Figure 2.3 TCP Hammers (TxDOT Geotechnical Manual, 2000)
The test consists of dropping a 170 lb hammer to drive the 3 inch diameter
penetrometer cone attached to the stem. The penetrometer cone (Figure 2.2 (b)) is first
driven for 12 inches or 12 blows, whichever comes first and is seated in soil. The test is started with a reference at this point. N-values are noted for the first and second 6 inches for a total of 12 inches for relatively soft materials and the penetration depth in inches is noted for the first and second 50 blows for a total of 100 blows in hard materials.
2.3 TCP and Shear Strength
Shear strength is one of the most important engineering properties of soils that is
needed for designs of foundation of earth structure (Schmertmann, 1975). Schmertmann
that in situ shear strength would probably be the one property that design engineers needed for design purposes.
TxDOT presently uses the triaxial test to determine the undrained shear strength of soils for its design purposes. However, during routine subsurface investigations, laboratory tests for determining soil shear strength are often omitted due to the additional expense involved. The TCP test is routinely used as the primary means for predicting the
soil shear strength at bridge sites (Geotechnical Manual, 2000).
2.4 Review of Past Research on TCP
TCP tests are routinely performed since they are required for investigation of foundation materials encountered during foundation exploration for TxDOT projects.
Limited research was done during 1974 to 1977 to correlate NTCP-values to shear strength
parameters. These studies were performed especially in the upper gulf coast region. The research objectives and results of these studies along with references are summarized in
Table 2.3.
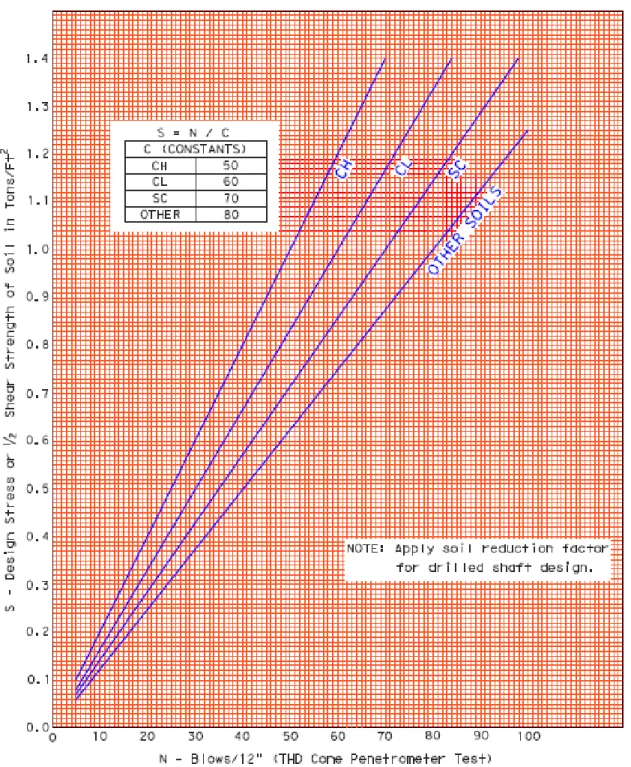
Based on past research, TxDOT presently uses the design chart shown in
Figure 2.4 and the same is summarized as equations in Table 2.4 to predict the shear
strength of soils using NTCP-values. The chart is designed to predict ½ shear strength;
hence, it has a factor of safety of 2 incorporated in it. The TCP values may be used without any correction to determine the shear strength using this chart. The TCP test does
not require consideration of groundwater (Geotechnical Manual, 2000).
As discussed earlier, the TCP test is the primary means of determining the soil shear strength by TxDOT for routine subsurface investigations. For this reason, a better
financial savings in the design and construction of earth structures built by TxDOT (Kim et al., 2007; Vipulanandan et al., 2007b). Hence, as part of this research, an attempt was made to develop new correlations between TCP parameters and shear strength and the results are presented in the latter chapters.
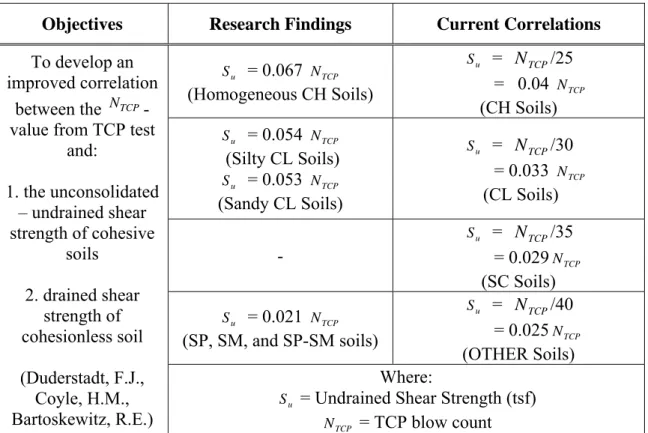
Table 2.3 Research Findings of the 1977 Research Report and Current Correlations
Table 2.4 Design Table to Predict Shear Strength for Foundation Design Using
TCP
N - values (Geotechnical Manual, 2000)
Soil Type Constants – C Design Shear Strength (0.5 × Su) = TCP N /C (tsf) Undrained Shear Strength (Su) = 2× (NTCP/C) (tsf) Undrained Shear Strength (Su) =2×(NTCP/C)×13.888 (psi) CH 50 NTCP/50 NTCP/25 0.556×NTCP CL 60 NTCP/60 NTCP/30 0.463×NTCP SC 70 NTCP/70 NTCP/35 0.397×NTCP OTHER 80 NTCP/80 NTCP/40 0.347×NTCP
Objectives Research Findings Current Correlations
u S = 0.067 NTCP (Homogeneous CH Soils) u S = NTCP/25 = 0.04 NTCP (CH Soils) u S = 0.054 NTCP (Silty CL Soils) u S = 0.053 NTCP (Sandy CL Soils) u S = NTCP/30 = 0.033 NTCP (CL Soils) - u S = NTCP/35 = 0.029NTCP (SC Soils) u S = 0.021 NTCP (SP, SM, and SP-SM soils) u S = NTCP/40 = 0.025NTCP (OTHER Soils) To develop an improved correlation between the NTCP
-value from TCP test and: 1. the unconsolidated – undrained shear strength of cohesive soils 2. drained shear strength of cohesionless soil (Duderstadt, F.J., Coyle, H.M., Bartoskewitz, R.E.) Where: u
S = Undrained Shear Strength (tsf)
TCP
Figure 2.4 Design Chart to Predict Shear Strength for Foundation Design Using - values; Presently Used by TxDOT (Geotechnical Manual, 2000)
2.5 Texas Geology
From northwest to southeast across the state of Texas, the geology varies
drastically (Figure 2.5). Predominantly, the North-West part of Texas is Quaternary and
Tertiary periods of Cenozoic era which formed ~10000 years to ~58 million years ago. The central part of Texas is more of Cretaceous period of Mesozoic era. From northwest to southeast up to the central part of Texas, the formation is mainly of Ochean Series (formed ~245 million years ago) to Missourian series (formed ~320 million years ago) of Paleozoic series (formed ~245 million years to ~570 million years ago). Few parts of Central Texas are formed during Paleozoic Undivided (~570 million years ago). From Central Texas to South East Texas toward the Gulf of Mexico, the geologic formation is mainly of Navarro Taylor groups to Fredericksburg and L. Washita Groups (~66 million years to ~144 million years ago) of Cretaceous period of Mesozoic era. The formation near the gulf coast is the most recent of all formations (~2 million years to ~58 million
years ago) (Vipulanandan et al., 2007b). The formations predominant from South East to
North West are in order of Alluvium, Quaternary undivided, Beaumont formation, Lissie formation, Willis formation, Fleming and Oakville formation, Catahoula formation and Claiborne group (or Yegua Formation) of Cenozoic era.
2.5.1 Houston-Beaumont Area
The geology of the Houston and Beaumont area is complex due to cyclic
deposition of sedimentary facies (Vipulanandan et al., 2007b). Sediments of the Gulf
Coast were mainly deposited in the coastal plains of the Gulf of Mexico Basin. These sediments were deposited under a fluvial-deltaic to shallow-marine environments during the Miocene to the Pleistocene periods. Repeated sea-level changes with mainly deltaic
deposit and natural basin subsidence produced discontinuous beds of sand, silt, clay, and gravel. Six major sediment dispersal systems that were the source of large deltas distributed sediments from erosion of the Laramide uplift along the central and southern
Rockies and Sierra Madre Oriental (Galloway et al., 2000; Galloway, 2005;
Vipulanandan et al., 2007b). The coastal plain is underlain by a massive thickness of sediments that form a homocline sloping gently towards the Gulf of Mexico. Several major rivers flow nearly perpendicular to the Gulf of Mexico. These rivers include the Sabine, Trinity, Colorado, Guadalupe, Brazos, San Antonio, and Rio Grande. The Houston-Galveston areas would have been mainly influenced by the Brazos, Trinity and
San Jacinto rivers (Chowdhury et al., 2006).
The depositional environment of the Pleistocene-aged sediments is consistent with the erosional and sedimentary cycles associated with periods of glaciations and coincident sea-level variations. Coastal terrace deposits and a fining upward sequence are
typical of glacial cycling (Hosman, 1996). The Lissie and Beaumont formations are the
two dominant subdivisions of the Pleistocene system in the Houston-Galveston area. These fluvial-deltaic sediments have been identified in the subsurface in Harris,
Galveston, Chambers, and Brazoria counties (Kreitler et al., 1977).
The Lissie Formation is unconformably contained between the Goliad Sand and the overlying Beaumont Clay. The Lissie Formation crops out in a band parallel to the coast and is about 30 miles wide from the Sabine River to the Rio Grande. The sediments of the Lissie Formation in the outcrop are partly continental deposits laid down on flood
plains and partly as delta sands, silts, and mud at the mouth of rivers (Sellards et al.,
The Beaumont clay is contained between the underlying Lissie Formation and
overlying Holocene-aged stream deposits and windblown sands (Weeks, 1937). The
Beaumont sediments were deposited largely by rivers in the form of natural levees and deltas that coalesced as river mouths shifted along the coast and, to a lesser extent, by marine and lagoonal water in the bays and embayments between stream ridges and delta
banks (Sellards et al., 1932). The Holocene-aged alluvial systems in the Texas Gulf Coast
are local in scale.
The Houston and Beaumont area geology is influenced by the Beaumont and Lissie formations with the soft soils deposited during the Pleistocene period under conditions of changing sea levels. The clay is essentially a late coastal plain formed by the deposition of sediments from the ancient rivers along the coast. As the river mouths shifted, so did the levees and deltas formed by them. These inter delta areas were then
buried beneath deltaic sediments (Vipulanandan et al. 2007b). The resulting formation is
one of deltaic deposition interbedded in places with marine and lagoon beds. The Beaumont coastal plain formation stretches from the Mississippi Delta to the Tamaulipas
Range in Northeastern Mexico (Ganstine, 1971).
The Beaumont formation itself is generally composed of clay. Although in the Central Gulf Coast the percentage of clay might be in the range of 30% to 90%. The clay is bluish gray, yellowish gray, pinkish gray, purple, and shades of red. In most places it contains calcareous nodules and some fragments of more or less decomposed wood. All of these clays are characterized by the high silica, and low lime content, and highly plastic. In general, the Beaumont clay formation consists of poorly bedded, plastic clay interbedded with silt and sand lentils, and has some more or less continuous layers of
sand. The Beaumont clays have been oxidized and desiccated during the Wisconsin glacial stage when sea levels were more than 400 feet (120 m) lower than at present. The
clay in general is an over consolidated clay (Ganstine, 1971). Finally, with the recession
of the late Wisconsin glaciers, the sea level returned to its present level, leaving both formations preconsolidated through desiccation. The rate of deposit was between
2500-30,000 mm/1000 years (Vipulanandan et al., 2007 (a) & (b)).
2.5.2 Dallas-Forth Worth Area
The formation of Dallas can be accounted to Navarro and Taylor groups which formed during Cretaceous period of Mesozoic era about 66 million years ago whereas Fort Worth was also formed during Cretaceous period of Mesozoic era but the difference is it belongs to Austin, Eagle Ford, Woodbine, and U. Washita Groups. Dallas, and its surrounding area, are mostly flat and lie at an elevation ranging from 450 to 550 feet (137 to 168 m). The western edge of the Austin chalk formation, a limestone escarpment, rises 200 feet (61 m) and runs roughly north-south through Dallas County. The uplift is particularly noticeable in the neighborhood of Oak Cliff and the adjacent cities of Cockrell Hill, Cedar Hill, Grand Prairie, and Irving. Marked variations in terrain are also found in cities immediately to the west in Tarrant County surrounding Fort Worth.
The Trinity River is a major Texas waterway that passes from the city of Irving into west Dallas, where it is paralleled by Interstate 35E along the Stemmons Corridor, then flows alongside western and southern downtown, and ultimately between south Dallas and Pleasant Grove, paralleled by Interstate 45, where it exits into unincorporated Dallas County and heads southeast to Houston. The river is flanked on both sides with a
22
2.6 Summary
Based on the literature review the following conclusions are advanced:
1. Energy per blow used in the SPT is similar to the TCP. Diameter of the TCP
Cone is double the size of the CPT Cone. Similar to the CPT, no sample is recovered during the TCP test. Unlike the CPT, soil sampling can be done in between the TCP tests.
2. Studies done on the TCP in the mid 1970s developed correlations between
TCP blow count and the undrained shear strength of soils. The data for the study were obtained from the upper Gulf Coast region.
3. The geology of Texas soils varies substantially. The soil deposits in the Gulf
Coast region are mainly deltaic and large variations in the properties are observed.
Work Group (Table1) PK Work Group ID Group Name Assigned User Phone Number Email Zip Code (TX) (Table2)
PK Zip Code City/Town State County Site (Table3) PK CSJ (Site ID)
Project Name or Number Structure Location or Address City State Zip Code (FK) County Work Group ID (FK) Data Source
Field Investigation (Table4)
PK Boring Hole ID CSJ (FK) Structure Station Offset Ground Elevation
Groundwater Table Elevation (GWT) Date
Total Borehole Depth
Driller Logger Organization Test (Table5) PK Test ID Boring Hole ID (FK) Depth First N6 Second N6
Penetration for the first 50 blows Penetration for the second 50 blows Total Unit Weight (Wet Den.(pcf)) Natural Moisture Content (MC) Pocket Penetrometer Triaxial Test Method
Cohesion
Internal Friction Angle (Phi Degrees) Specific Gravity D10 D50 Uniformity (Cu) Curvature (Cz) % Pass - 200 % Pass - 10 % Pass - 4 Liquid Limit (LL) Plastic Limit (PL) Plastic Index (PI)
Classification
Unconfined Strength Coefficient of Consolidation (Cv) Compression Index (Cc)
OCR
Date Last Updated Assessment
CHAPTER 3. DATA COLLECTION AND ANALYSIS
3.1 Database System
Data collected from various locations in Texas were digitally stored for easy processing and developing correlations for each TxDOT project with a CSJ designation.
The data were stored in five Tables as shown in Figure 3.1.
3.1.1 Soil Database Management System (SDBMS)
Microsoft’s Access® database system consists of Tables, Queries, Forms, Reports, and Data Access Pages. Tables store data in rows and columns. All databases contain one or more Tables. Queries retrieve and process data. They can combine data from different Tables, update data, and perform calculations on the data. Forms control data entry and data views. They provide visual cues that make data easier to process.
Five Tables in five different worksheets were used for storing information collected from the TxDOT districts. Each of the five Tables was assigned a Primary key (PK) such as Work Group ID (Table 1), Zip Code (Table 2), CSJ (Table 3), Boring Hole ID (Table 4) and Test ID (Table 5). This key was used to identify information carried over to the next Table. Each Primary key (PK) was converted into a Foreign key (FK) in the later Tables. For example, Boring Hole ID was the Primary key (PK) in Table 4. In Table 5, Boring Hole ID was the Foreign key (FK). Thus information corresponding to a boring hole in Table 4 was linked to the information in Table 5 by the analogous Boring Hole ID. Similarly, information from all five Tables were linked and provided easy access to review information from a particular project site or a particular boring hole. Both the Primary key (PK) and the Foreign key (FK) are clearly identified in all five Tables. The information stored in each of these five Tables and a brief explanation of each type of
data are described in Tables 3.1 through 3.5.
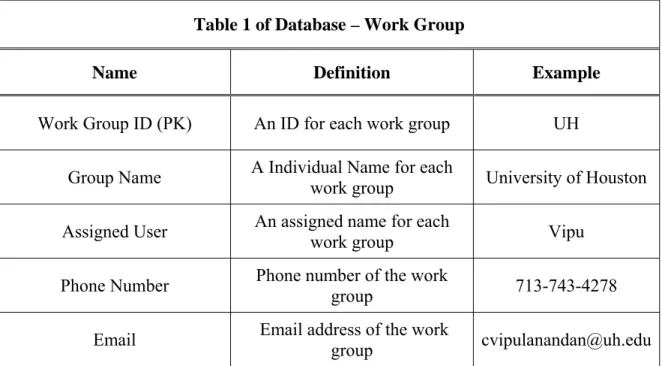
Table 3.1 Details of Table 1 of Soil Database for the Study Table 1 of Database – Work Group
Name Definition Example
Work Group ID (PK) An ID for each work group UH
Group Name A Individual Name for each work group University of Houston
Assigned User An assigned name for each work group Vipu
Phone Number Phone number of the work group 713-743-4278
Table 3.2 Details of Table 2 of Soil Database for the Study Table 2 of Database – Zip Code
Name Definition Example
Zip Code (PK) Zip Code of the work site 77024
City/Town City/Town of the work site Houston
State State of the work site TX
County County of the work site Harris
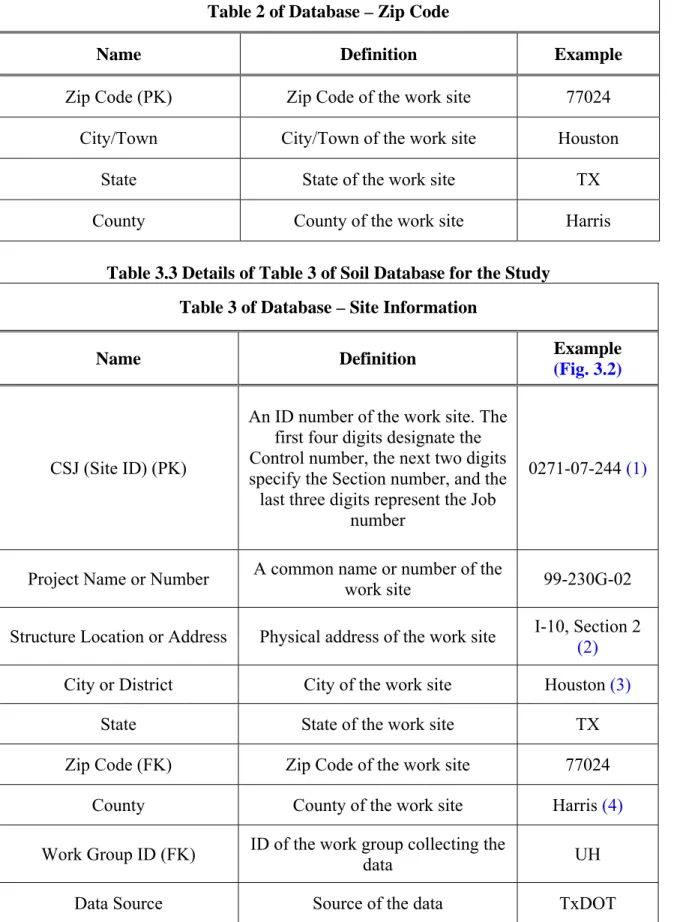
Table 3.3 Details of Table 3 of Soil Database for the Study Table 3 of Database – Site Information
Name Definition Example
(Fig. 3.2)
CSJ (Site ID) (PK)
An ID number of the work site. The first four digits designate the Control number, the next two digits specify the Section number, and the last three digits represent the Job
number
0271-07-244 (1)
Project Name or Number A common name or number of the
work site 99-230G-02
Structure Location or Address Physical address of the work site I-10, Section 2 (2)
City or District City of the work site Houston (3)
State State of the work site TX
Zip Code (FK) Zip Code of the work site 77024
County County of the work site Harris (4)
Work Group ID (FK) ID of the work group collecting the data UH
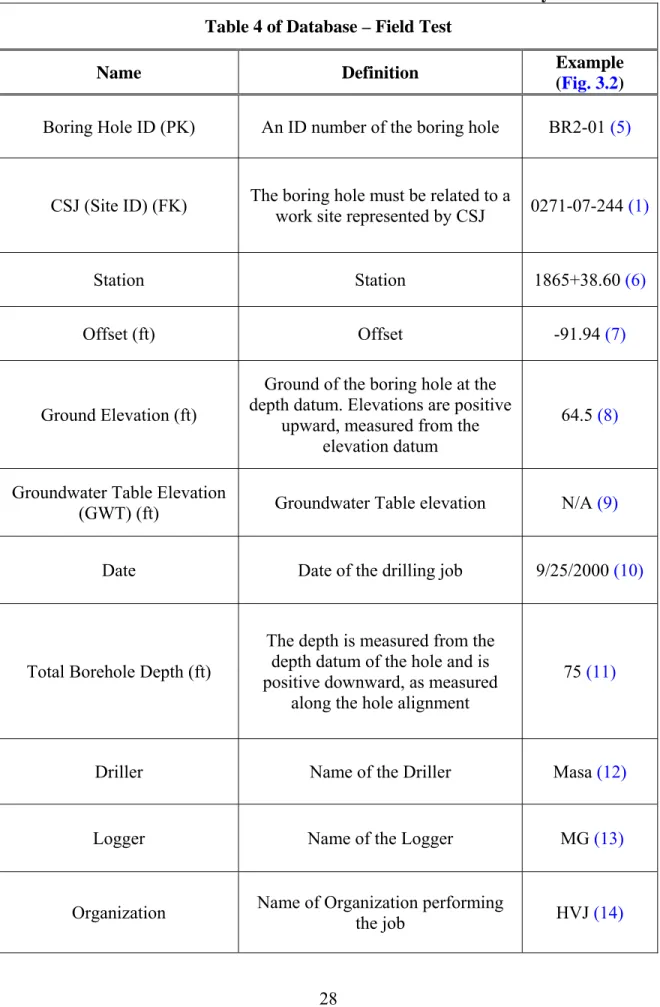
Table 3.4 Details of Table 4 of Soil Database for the Study Table 4 of Database – Field Test
Name Definition Example
(Fig. 3.2)
Boring Hole ID (PK) An ID number of the boring hole BR2-01 (5)
CSJ (Site ID) (FK) The boring hole must be related to a
work site represented by CSJ 0271-07-244 (1)
Station Station 1865+38.60 (6)
Offset (ft) Offset -91.94 (7)
Ground Elevation (ft)
Ground of the boring hole at the depth datum. Elevations are positive
upward, measured from the elevation datum
64.5 (8)
Groundwater Table Elevation
(GWT) (ft) Groundwater Table elevation N/A (9)
Date Date of the drilling job 9/25/2000 (10)
Total Borehole Depth (ft)
The depth is measured from the depth datum of the hole and is positive downward, as measured
along the hole alignment
75 (11)
Driller Name of the Driller Masa (12)
Logger Name of the Logger MG (13)
Table 3.5 Details of Table 5 of Soil Database for the Study Table 5 of Database – Test
Name Definition Example
(Fig. 3.2)
Test ID (PK) An ID number of the work group for the Test Table (Example: UTA01, UH01, LAR01)
UH000629
Boring Hole ID (FK) An ID number of the boring hole BR2-01 (5)
Depth (ft) where the test was performed at each The measured depth to the sample boring hole
5 (15)
Classification The soil classification used to describe the layer CL (16)
First N6 or N1
The number of blows required for the
TCP to penetrate the first 6 inches 17 (17)
Second N6 or N2
The number of blows required for the
TCP to penetrate the second 6 inches 17 (18)
Penetration for the first 50 blows
Penetration for the first 50 blows if the penetration is less than 6 inches for any of the 6 inch increments
4 (19)
Penetration for the second 50 blows
Penetration for the second 50 blows if the penetration is less than 6 inches
for any of the 6 inch increments
0 (20)
Pocket penetrometer Pocket penetrometer readings 4.5 (21)
Triaxial test method The type of triaxial test performed ASTM
Lateral pressure (psi) Lateral pressure from the triaxial test 0 (22)
Deviator stress (psi) Deviator stress from the triaxial test 117.2 (23)
Specific gravity Specific gravity measured N/A
D10 Grain diameter corresponding to 10 percent passing N/A
D50 Grain diameter corresponding to 50 percent passing N/A
Uniformity Coefficient (Cu)
A coefficient describing the degree of uniformity of the grain size distribution. This coefficient is
defined as (D60)/(D10)
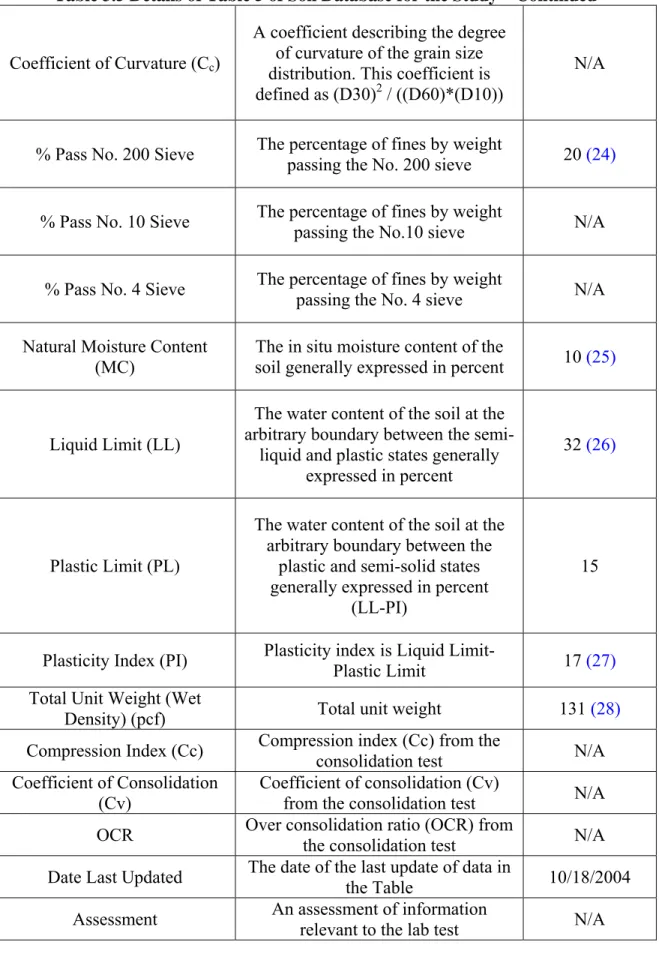
Table 3.5 Details of Table 5 of Soil Database for the Study – Continued
Coefficient of Curvature (Cc)
A coefficient describing the degree of curvature of the grain size distribution. This coefficient is
defined as (D30)2 / ((D60)*(D10))
N/A
% Pass No. 200 Sieve The percentage of fines by weight passing the No. 200 sieve 20 (24)
% Pass No. 10 Sieve The percentage of fines by weight
passing the No.10 sieve N/A
% Pass No. 4 Sieve The percentage of fines by weight passing the No. 4 sieve N/A
Natural Moisture Content (MC)
The in situ moisture content of the
soil generally expressed in percent 10 (25)
Liquid Limit (LL)
The water content of the soil at the arbitrary boundary between the
semi-liquid and plastic states generally expressed in percent
32 (26)
Plastic Limit (PL)
The water content of the soil at the arbitrary boundary between the
plastic and semi-solid states generally expressed in percent
(LL-PI)
15
Plasticity Index (PI) Plasticity index is Liquid Limit-Plastic Limit 17 (27)
Total Unit Weight (Wet
Density) (pcf) Total unit weight 131 (28)
Compression Index (Cc) Compression index (Cc) from the
consolidation test N/A
Coefficient of Consolidation (Cv)
Coefficient of consolidation (Cv)
from the consolidation test N/A
OCR Over consolidation ratio (OCR) from
the consolidation test N/A
Date Last Updated The date of the last update of data in the Table 10/18/2004
3.1.2 Data Collected
Based on the recommendations of the TxDOT project committee, data for the past
10 years starting from 1994 to 2004 were collected for this study (Figure 3.3). To
expedite the research, three universities were involved in collecting the data required for this study. The state of Texas was divided into three sectors. The following research teams were responsible for collecting data from each sector:
University of Houston (UH) team – Central and south central Texas (Contacted districts : Houston, Waco, Corpus Christi, and San Antonio Districts)
Lamar University (LU) team – East Texas (Contacted district : Beaumont District)
The University of Texas at Arlington (UTA) team – North and west Texas (Contacted districts : Dallas, Fort Worth and Austin Districts)
The data were collected on four soil types and their basic properties are
summarized in Table 3.6. The data were then manually entered into the database created
using Microsoft Access. The data available on Wincore files were extracted by the software developed by UTA during this study. Details of the data collected (TCP blow
count (NTCP) and undrained shear strength (Su) for each soil type) by University of
Houston, Lamar University, and University of Texas at Arlington are summarized in
Table 3.7.
Other than basic or simple identification of soil types, classification of soils into various Universals Soil Classification System (USCS) symbols including CL or CH required additional laboratory tests including the Atterberg limits test. An attempt was
Table 3.6 Typical Soil Properties of Clay (TxDOT Geotechnical Manual, 2000)
Category Soil Type
CH High plasticity clays, LL≥50
CL Low plasticity clays and silt clay mixtures, LL<50
SC Sand-Clay mixtures
OTHER All other soils and rocks
Table 3.7 Details on Data Collected from various Districts
Available Data Set District CH CL SC Others Total Data (ft) Total Bore Holes Total 2,100 1,852 29 42 177,298 3,987 Houston 1,726 1,762 29 42 60,029 1,070 Waco 22 13 0 0 944 24 Corpus Christi 0 0 0 0 320 4 U of Houston San Antonio 0 0 0 0 2,300 57 Lamar U Beaumont 341 26 0 0 10,997 398 Dallas 11 51 0 0 73,999 1,757
Uof Texas at Arlington Fort Worth 0 0 0 0 28,709 677
Total Soil Data Collected
Table 3.7 summarizes the total amount of data collected from various TxDOT
were collected from 3,987 bore holes. The cumulation length of the bore holes was 177,298 ft. Of the over 4,000 data sets, 2,100 data sets were identified as CH soils, 1,852 data sets were identified as CL soils, 29 data sets were identified as SC soils, and 42 data sets were identified as Other soils. The amount of data sets from the Houston District was 88 % of Total Soil Data sets.
Local Soil Data Collected by University of Houston
A total of 3,594 data sets (TCP blow count (NTCP) and undrained shear strength
(Su)) were collected from 1,155 bore holes by the University of Houston. The cumulation
length of the bore holes from the districts was 63,593 ft. Of the 3,594 data sets, 1,748 data sets were identified as CH soils, 1,775 data sets were identified as CL soils, 29 data sets were identified as SC soils, and 42 data sets were identified as Other soils.
Local Soil Data Collected from Lamar University
A total of 367 data sets (TCP blow count (NTCP) and undrained shear strength
(Su)) were collected from 398 bore holes by Lamar University. The cumulation length of
the bore holes from the districts was 10,997 ft. Of the 367 data sets, 341 data sets were identified as CH soils and 26 data sets were identified as CL soils. There were no available data sets for SC and Other soils.
Local Soil Data Collected from University of Texas at Arlington
A total of 62 data sets (TCP blow count (NTCP) and undrained shear strength (Su))
were collected from 2,437 bore holes by University of Texas at Arlington. The cumulation length of the bore holes from the districts was 102,708 ft. Of the 62 data sets,
11 data sets were identifi