M; Dutta, E; Varghese, CM; Mehrotra, R; Jambulingam, P; Kaur, T; Sharma, M; Singh, S; Arora, R; Rasaily, R; Anjana, RM; Mohan, V; Agrawal, A; Chopra, A; Mathew, AJ; Bhardwaj, D; Muraleedha-ran, P; Mutreja, P; Bienhoff, K; Glenn, S; Abdulkader, RS; Aggar-wal, AN; AggarAggar-wal, R; Albert, S; Ambekar, A; Arora, M; Bachani, D; Bavdekar, A; Beig, G; Bhansali, A; Bhargava, A; Bhatia, E; Ca-mara, B; Christopher, DJ; Das, SK; Dave, PV; Dey, S; Ghoshal, AG; Gopalakrishnan, N; Guleria, R; Gupta, R; Gupta, SS; Gupta, T; Gupte, MD; Gururaj, G; Harikrishnan, S; Iyer, V; Jain, SK; Jeemon, P; Joshua, V; Kant, R; Kar, A; Kataki, AC; Katoch, K; Khanna, T; Khera, A; Kinra, S; Koul, PA; Krishnan, A; Kumar, A; Kumar, RK; Kumar, R; Kurpad, AV; Ladusingh, L; Lodha, R; Mahesh, PA; Malhotra, R; Mathai, M; Mavalankar, D; Mohan, BVM; Mukhopad-hyay, S; Murhekar, M; Murthy, GVS; Nair, S; Nair, SA; Nanda, L; Nongmaithem, RS; Oommen, AM; Pandian, JD; Pandya, SC; Parameswaran, S; Pati, S; Prasad, K; Prasad, N; Purwar, M; Rahim, A; Raju, S; Ramji, S; Rangaswamy, T; Rath, GK; Roy, A; Sabde, Y; Sachdeva, KS; Sadhu, H; Sagar, R; Sankar, MJ; Sharma, R; Shet, A; Shirude, S; Shukla, R; Shukla, SR; Singh, G; Singh, NP; Singh, V; Sinha, A; Sinha, DN; Srivastava, RK; Srividya, A; Suri, V; Swami-nathan, R; Sylaja, PN; Tandale, B; Thakur, JS; Thankappan, KR; Thomas, N; Tripathy, S; Varghese, M; Varughese, S; Venkatesh, S; Venugopal, K; Vijayakumar, L; Xavier, D; Yajnik, CS; Zachariah, G; Zodpey, S; Rao, J; Vos, T; Reddy, KS; Murray, CJL; Swaminathan, S; India State-Level Dis, B (2017) Nations within a nation: variations in epidemiological transition across the states of India, 1990-2016 in the Global Burden of Disease Study. Lancet, 390 (10111). pp. 2437-2460. ISSN 0140-6736 DOI: https://doi.org/10.1016/S0140-6736(17)32804-0
Downloaded from: http://researchonline.lshtm.ac.uk/4646858/
Nations within a nation: variations in epidemiological
transition across the states of India, 1990–2016 in the Global
Burden of Disease Study
India State-Level Disease Burden Initiative Collaborators*
Summary
Background 18% of the world’s population lives in India, and many states of India have populations similar to those of
large countries. Action to effectively improve population health in India requires availability of reliable and comprehensive state-level estimates of disease burden and risk factors over time. Such comprehensive estimates have not been available so far for all major diseases and risk factors. Thus, we aimed to estimate the disease burden and risk factors in every state of India as part of the Global Burden of Disease (GBD) Study 2016.
Methods Using all available data sources, the India State-Level Disease Burden Initiative estimated burden (metrics were
deaths, disability-adjusted life-years [DALYs], prevalence, incidence, and life expectancy) from 333 disease conditions and injuries and 84 risk factors for each state of India from 1990 to 2016 as part of GBD 2016. We divided the states of India into four epidemiological transition level (ETL) groups on the basis of the ratio of DALYs from communicable, maternal, neonatal, and nutritional diseases (CMNNDs) to those from non-communicable diseases (NCDs) and injuries combined in 2016. We assessed variations in the burden of diseases and risk factors between ETL state groups and between states to inform a more specific health-system response in the states and for India as a whole.
Findings DALYs due to NCDs and injuries exceeded those due to CMNNDs in 2003 for India, but this transition had a
range of 24 years for the four ETL state groups. The age-standardised DALY rate dropped by 36·2% in India from 1990 to 2016. The numbers of DALYs and DALY rates dropped substantially for most CMNNDs between 1990 and 2016 across all ETL groups, but rates of reduction for CMNNDs were slowest in the low ETL state group. By contrast, numbers of DALYs increased substantially for NCDs in all ETL state groups, and increased significantly for injuries in all ETL state groups except the highest. The all-age prevalence of most leading NCDs increased substantially in India from 1990 to 2016, and a modest decrease was recorded in the age-standardised NCD DALY rates. The major risk factors for NCDs, including high systolic blood pressure, high fasting plasma glucose, high total cholesterol, and high body-mass index, increased from 1990 to 2016, with generally higher levels in higher ETL states; ambient air pollution also increased and was highest in the low ETL group. The incidence rate of the leading causes of injuries also increased from 1990 to 2016. The five leading individual causes of DALYs in India in 2016 were ischaemic heart disease, chronic obstructive pulmonary disease, diarrhoeal diseases, lower respiratory infections, and cerebrovascular disease; and the five leading risk factors for DALYs in 2016 were child and maternal malnutrition, air pollution, dietary risks, high systolic blood pressure, and high fasting plasma glucose. Behind these broad trends many variations existed between the ETL state groups and between states within the ETL groups. Of the ten leading causes of disease burden in India in 2016, five causes had at least a five-times difference between the highest and lowest state-specific DALY rates for individual causes.
Interpretation Per capita disease burden measured as DALY rate has dropped by about a third in India over the past
26 years. However, the magnitude and causes of disease burden and the risk factors vary greatly between the states. The change to dominance of NCDs and injuries over CMNNDs occurred about a quarter century apart in the four ETL state groups. Nevertheless, the burden of some of the leading CMNNDs continues to be very high, especially in the lowest ETL states. This comprehensive mapping of inequalities in disease burden and its causes across the states of India can be a crucial input for more specific health planning for each state as is envisioned by the Government of India’s premier think tank, the National Institution for Transforming India, and the National Health Policy 2017.
Funding Bill & Melinda Gates Foundation; Indian Council of Medical Research, Department of Health Research, Ministry
of Health and Family Welfare, Government of India; and World Bank
Copyright © The Author(s). Published by Elsevier Ltd. This is an Open Access article under the CC BY 4.0 license.
Introduction
India has a population of 1·34 billion spread across 29 states and seven union territories. Many of the states
have populations of similar sizes to large countries;
ten states had more than 60 million people in 2017.1 The
largest state, Uttar Pradesh, with a population of more
Lancet 2017; 390: 2437–60
Published Online
November 14, 2017 http://dx.doi.org/10.1016/ S0140-6736(17)32804-0
This online publication has been corrected. The corrected version first appeared at thelancet.com on November 30, 2017
See Perspectives page 2428 *Collaborators listed at the end of the Article
Correspondence to: Prof Lalit Dandona, Public Health Foundation of India, Gurugram 122002, National Capital Region, India
than 220 million people, ranked fifth largest among all
nations of the world.2 India has more than 2000 ethnic
groups with genetically distinct ancestry and diverse
lifestyles3 and has undergone heterogeneous economic
growth over the past few decades, which would be expected to lead to wide variations in health and disease distribution in different parts of the country. The overall economic growth rate in India has been one the fastest in
the world in the past decade.4 This growth should be used
to enhance major long-term enablers of societal development, of which population health is a crucial aspect that would further boost economic growth.
Some research has tried to understand the
epidemi-ological transition that India is undergoing,5–9 but a
comprehensive understanding of the changes in disease burden and risk factor trends with large-scale robust data for each state of India is not readily available. The social development status of the states in India varies widely. For example, the state of Kerala has been reported to have had much better health indicators than the rest of
India for the past several decades.10 The Government of
India focuses more development efforts on the Empowered Action Group (EAG) states in north India and the states of the northeast region of India, which often have poorer health indicators than the rest of
India.11 Diversity in the magnitude and causes of disease
burden, as well as the risk factors, is generally anticipated between and within the broad state groupings, but no systematic and comprehensive analysis of the state-level variations for these is available to inform specific state-level planning. Although the central government policies have significant influence on health initiatives across the country, health is a state subject in the Indian federal
structure.12 Of total government spending on health at
the state level, on average two-thirds is from the state
budget and one-third from the central budget.13 A robust
disaggregated understanding of the disease burden and risk factors trends in each state of India is essential for effective health-system and policy action to improve population health.
Research in context
Evidence before this study
Existing evidence suggests that India has been going through an epidemiological transition with an increase in the proportion of disease burden attributable to
non-communicable diseases (NCDs). Attempts have been made to understand the epidemiological transition of India as a whole for its population of 1·3 billion people. The burden from major communicable diseases such as diarrhoea, lower respiratory infections, and tuberculosis, as well as neonatal disorders, continues to be quite high in India relative to other countries. State-level estimates of key indicators such as neonatal, infant, and under-5 mortality rates are provided by the Sample Registration Survey of India annually for the states of the country. The Sample Registration Survey has also reported causes of death from verbal autopsy for aggregate causes by regions of the country. State-level estimates for HIV are produced by the National AIDS Control Organization of India. The major national surveys, the National Family Health Survey, District Level Household Survey, and the Annual Health Survey have provided valuable periodic data on key health indicators, though mostly related to child and reproductive health. Data on the prevalence of diabetes, ischaemic heart disease, and their risk factors are increasingly being generated for a number of states by several studies. However, a comprehensive assessment of all major diseases and risk factors across all states of India providing estimates over an extended period of time, which is needed for an informed health-system and policy development in each state, has not previously been published to our knowledge. Added value of this study
For the first time to our knowledge, this study provides estimates of 333 disease conditions and injuries and 84 risk factors for
every state of India from 1990 to 2016, using all available data identified through an extensive effort involving over 200 leading health scientists and policy makers in India from 103 institutions. The generation of estimates and their interpretation have benefited from the insights of domain experts through an intensive collaborative process over 2 years. The findings from this study have enabled a comprehensive mapping of the epidemiological transition in each state of India, which has revealed that grouping the states into four groups by different epidemiological transition levels is a useful intermediate step in understanding disease burden and risk factor trends across the country. The specific state-level findings presented to some extent in this paper, and in more detail with a profile of each state in the policy report being presented to the Government of India and the state governments, are crucial valuable additions to state-specific health policy making in India.
Implications of all the available evidence The evidence now explicitly describes the extent of
epidemiological transition, burden of broad disease groups and specific diseases, and risk factors in each state of India and in the four state groups by epidemiological transition level. Although the burden due to NCDs and injuries as a whole has overtaken the burden due to communicable, maternal, neonatal, and nutritional disorders (CMNNDs) in every state of the country, the extent of this varies widely. Accordingly, the enhancement of interventions to control NCDs and injuries must happen in every state of the country, but, in parallel to this, the burden of CMNNDs has to be addressed with vigour, commensurate with its magnitude in each state. This specific titration of health policy will be key to achieving an appropriate balance of interventions needed to reduce the vast inequalities in health status among the states of India.
The India State-Level Disease Burden Initiative was launched in October, 2015, to address this crucial gap that hinders informed health-system and policy develop-ment commensurate with the state-level vari ations in diseases and risk factors. This initiative is a collaboration involving 103 institutions with the aim of producing robust state-level disease burden trends from 1990 onward as part of the Global Burden of Disease Study (GBD), using all identifiable epidemiological data from India and the expertise of a large number of leading health scientists and thinkers in India. More information on this initiative is provided in the appendix (p 4). This effort is consistent with the recent inclusion of disease burden tracking using disability-adjusted life-years (DALYs) as a specific objective in the India National Health Policy 2017, and the emphasis by the National Institution for Transforming India (NITI Aayog; the premier thinktank of the Government of India) on developing robust systems for disaggregated data to inform policy, indicating high-level policy interest in using reliable disease burden estimation to guide
improvements in population health.14–17
In this paper we report findings from the first compre-hensive assessment by the India State-Level Disease Burden Initiative produced as part of GBD 2016, highlighting that the country is in different phases of epidemiological transition, which have resulted in massive variations in disease burden across the Indian states. This has fundamental implications for state-specific health-system and policy efforts to improve the health of the 18% of the world’s population that lives in India.
Methods
Overview
The network of the India State-Level Disease Burden Initiative collaborators worked closely on the data sources, analyses, and interpretation of the findings for the calculation of state-level disease burden and risk factor estimates as part of GBD 2016. This collaborative work benefitted immensely from the deliberations of the 14 expert groups formed under the India State-Level Disease Burden Initiative. The work of this initiative is approved by the Health Ministry Screening Committee of the Indian Council of Medical Research, and by the ethics committee of the Public Health Foundation of India.
A comprehensive description of data sources, data quality, statistical modelling and analyses, and metrics for
GBD 2016 have been reported elsewhere.18–22 GBD 2016
estimated disease burden due to 333 diseases and injuries (appendix pp 5–11) and 84 risk factors (appendix pp 12–13). The GBD cause list is hierarchical and includes three broad categories at the top level: communicable, maternal, neonatal, and nutritional diseases (CMNNDs);
non-communicable diseases (NCDs); and injuries.19,21
The findings in this paper are presented for 31 geographical units in India: 29 states, Union Territory of Delhi, and the union territories other than Delhi
(combining the six smaller union territories of Andaman and Nicobar Islands, Chandigarh, Dadra and Nagar Haveli, Daman and Diu, Lakshadweep, and Puducherry). The states of Chhattisgarh, Uttarakhand, and Jharkhand were created from existing larger states in 2000, and the state of Telangana was created in 2014. For trends from 1990 onward, the data for these four new states were disaggregated from their parent states on the basis of data from the districts that now constitute these states.
Mortality, causes of death, and YLLs
The estimation process of all-cause mortality includes estimation of under-5 mortality, adult mortality, age– sex mortality estimation, adjustment for HIV/AIDS mortality, and the effects of fatal discontinuities such as wars, disasters, and pandemics. Life expectancy was computed at birth and at each age category for India and for states by age, sex, and time period. The major data sources for estimation of mortality in India include sample registration system (SRS) and vital registration, censuses, and large-scale national household surveys such as the National Family Health Surveys and District Level Household Surveys (appendix pp 14–121).
Causes of death were estimated on the basis of the GBD cause list using Cause of Death Ensemble model (CODEm), negative binomial models for rare causes, natural history models, subcause proportion models, and prevalence-based models. To generate the cause-of-death estimates, the completeness of death records was assessed by dividing registered deaths in each location– year by all-age death estimates and using statistical models. We mapped revisions of the International Classification of Diseases into a consistent classification for causes of deaths, and redistributed deaths assigned to causes that were not underlying causes of death (garbage codes) to specific underlying causes proportionately or using regression models. The sum of the predicted deaths from these models in an age-sex-state-year group do not necessarily equal the number of deaths from all causes in the mortality envelopes, and hence we made these consistent with the results from all-cause mortality
estimation using the CoDCorrect algorithm.19 The data
sources used for the causes of deaths estimation in India were verbal autopsy from SRS, Medically Certified Causes of Deaths, cancer registries, and smaller verbal autopsy studies (appendix pp 14–121). We obtained the years of life lost (YLLs) because of premature death by multiplying each death by the normative standard life
expectancy at each age.19
The verbal autopsy cause of death data for 455 460 deaths covered by SRS from 2004 to 2013 across all states and union territories of India was a major additional data source for GBD 2016. The SRS in India is operated by the Office of the Registrar General of India working under the Ministry of Home Affairs, Govern ment of
India.23 Using the 2001 census, 7597 geographic units,
4433 (58·4%) of which were rural, were sampled for the
2004–13 SRS to represent the population of each state and union territory of India, ultimately with a sample of 6·7 million people that was equivalent to 0·7% of India’s population. The SRS cause-of-death data for 2004–06, 2007–09, and 2010–13 were provided for each state and union territory by the Office of the Registrar General of India for use in the state-level disease burden estimation. We used 2005, 2008, and 2012 as midpoint years for these three time periods. The inclusion of SRS 2004–13 data in this analysis offers a comprehensive picture of causes of death in India. The Office of the Registrar General of India was not involved with the production of the GBD modelled estimates, and therefore their estimates might differ from those presented here.
YLDs and DALYs
We estimated non-fatal health outcomes mostly using DisMod-MR, version 2.1, an updated Bayesian-regression analytic tool, to synthesise con sistent estimates of disease incidence, prevalence, remission, excess mortality, and cause-specific mortality rates. Details of this and other estimation methods, severity distributions and disability weights, which are used to quantify the relative severity of GBD causes, including the sources
used for India, are published elsewhere.20
The major input data sources used to quantify the non-fatal burden of disease in India were representative population-level surveys and cohort studies, pro-gramme-level data on disease burden from government agencies, surveillance system data on disease burden, administrative records of health-service encounters, disease registries, and a wide range of other studies done across India (appendix pp 14–121). These studies included published literature as well as unpublished studies that were identified and accessed through a network of expert group members and collaborators in India.
Years lived with disability (YLDs) are calculated by multiplying the prevalence of each sequela by its disability
weight, developed using population-based surveys.20 The
computation of YLDs involved the estimation of prevalence of disease, injuries, and their sequelae. To compute YLDs for the particular sequela, the prevalence of each sequela was multiplied by the disability weight for the
corresponding health state.20 The sum of all YLDs for
relevant sequelae equated to overall YLDs for each disease, because sequelae in GBD are mutually exclusive and collectively exhaustive. We computed DALYs for India and states by summing YLLs and YLDs for each cause, age, and sex. For some causes that had reduction in DALY rates over time, we also assessed the change in their prevalence or incidence rates over time to understand whether the lower DALY rates were due to improving health care or decreases in these prevalence or incidence rates.
Risk factors
A detailed description of comparative risk assessment for exposures and estimation of attributable risks and the
GBD 2016 risk factor hierarchy is available elsewhere.22
To calculate risk-attributable fractions of disease burden by cause, we modelled the effects of risk exposure levels, documented relative risks associated with risk exposure and specific health outcomes, and computed theoretical minimum risk counterfactual levels of risk exposure on estimates for India and state-level deaths, YLLs, YLDs, and DALYs.
The input data sources for the estimation of risk factors in India include large-scale national household surveys, population-level surveys provided by collaborators, programme-level data from government agencies, and systematic reviews of epidemiological studies (appendix pp 14–121). These sources provided empirical estimates of risk factor exposure with incorporation of relevant predictive covariates in statistical models to obtain a summary measure of exposure for each risk, called the summary exposure value (SEV). This metric captures risk-weighted exposure for a population, or risk-weighted prevalence of an exposure, the details of which are
described elsewhere.22 The scale for SEV spans from
0% to 100%, with an SEV of 0% reflecting no risk exposure in a population and 100% showing that an entire population is exposed to the maximum possible risk. We then combined the estimates for SEV with relative risk estimation for health outcomes with sufficient evidence of a causal relationship to provide estimates of population attributable fractions of disease caused by each risk factor.
All estimates in GBD are strengthened by using covariates that are associated with the variable being estimated. This is particularly useful when data for a variable are scarce.
Grouping of states
We grouped the states of India according to their epidemiological transition level (ETL) in 2016, which was defined as the ratio of all-age DALYs due to CMNNDs versus those due to NCDs and injuries together. A smaller ratio indicates advancing epidemiological transition—ie, higher burden of NCDs and injuries than CMNNDs. The states with ratios of 0·56–0·75 in 2016 were considered to have low ETLs (Bihar, Jharkhand, Uttar Pradesh, Rajasthan, Meghalaya, Assam, Chhattisgarh, Madhya Pradesh, and Odisha; total population 626 million in 2016), those with ratios of 0·41–0·55 had lower-middle ETLs (Arunachal Pradesh, Mizoram, Nagaland, Uttarakhand, Gujarat, Tripura, Sikkim, and Manipur; total population 92 million), those with ratios of 0·31–0·40 had higher-middle ETLs (Haryana, Delhi, Telangana, Andhra Pradesh, Jammu and Kashmir, Karnataka, West Bengal, Maharashtra, and union territories other than Delhi; total population 446 million), and those with ratios less than 0·31 had high ETLs (Himachal Pradesh, Punjab, Tamil Nadu, Goa, and Kerala; total population 152 million). Kerala had the lowest ratio of 0·16. The highest ETL group could have been split into two groups, with Kerala
and Goa in one group and the other three states in the other groups, but this would have led to very small groups. We preferred state groups with at least five states, because describing very small groups of states would not be very different from describing individual states. The ranges of ratios that we used to define the ETL groups varied, with a range of 0·2 (0·56–0·75 inclusive) for low ETL, 0·15 (0·41–0·55 inclusive) for lower-middle ETL, and 0·1 (0·31–0·40 inclusive) for higher-middle ETL. The logic for this is that as the ratio increases towards 1, a larger range captures similar levels of CMNNDs. A combination of this logic and breaks in between clusters of ratios were used to define the ETL groups.
We present in this paper trends of epidemiological transition, deaths, DALYs, YLLs, YLDs, prevalence, incidence, risk factors, and life expectancy for the Indian states from 1990 to 2016, highlighting major variations between ETL state groups and states, which are relevant to inform more nuanced health-system and policy development across the states of India.
We related the epidemiological transition ratios across the states with their Socio-Demographic Index (SDI), which is based on an equal weighting of lag-distributed income per capita, average years of education in the
population older than 15 years, and total fertility rate.19
We present results as all-age rates to show the disease or risk factor burden that the states have to deal with in reality at any given time, as well as age-standardised rates using a global population reference age structure to assess epidemiological differences after adjusting for differences in population age structure.
GBD computes 95% uncertainty intervals (UIs) around estimates. We assessed whether the DALY estimates for the causes and risk factors for each state were significantly different from the national mean, using 95% UIs based on 1000 draws.
Role of the funding source
Some staff of the Indian Council of Medical Research and the Bill & Melinda Gates Foundation are coauthors on this paper as they contributed to various aspects of this study. The other funder of this study had no role in the study design, data collection, data analysis, data interpretation, or writing of this paper. The corresponding author had full access to all the data in the study and had final responsibility for the decision to submit for publication.
Results
All states of India had epidemiological transition ratios of 0·75 or less in 2016 (figure 1). By contrast, in 1990, only Kerala (ETL 0·49) had a ratio of 0·75 or less, Goa (0·84) and the union territories other than Delhi (0·85) had ratios 0·76–1·00 and all other states had ratios of one or more, showing a major shift across all states between 1990 and 2016. The percent reduction of epidemiological transition ratios ranged from 55·2% to 75·4% across the
states of India (appendix p 122). The year in which the epidemiological transition ratio dropped to less than 1— and thus, the point at which NCDs and injuries accounted for more DALYs than CMNNDs—was 1986 for the high ETL state group, 1996 for the higher-middle ETL state group, 2000 for the lower-middle ETL state group, and 2010 for the low ETL state group, showing a 24-year variation across the groups; this epidemiological transition year for India as a whole was 2003 (figure 2). A significant inverse relationship existed between the epidemiological transition ratio and the SDI of the states, with a correlation coefficient of –5·82 in 1990 and –1·81 in 2016. This shows that the relationship between SDI and epidemiological transition ratio was stronger in 1990 than in 2016 (appendix p 130).
In 2016, deaths due to CMNNDs were 34·7% (95% UI 31·9–39·7) and those due to NCDs were 55·2% (50·6–58·1) of the total number of deaths in the low ETL group, and 15·9% (13·9–19·3) and 72·3% (68·9–74·2) in the high ETL state group (table 1). For India as a whole, 27·5% (95% UI 25·4–31·5) of deaths were due to CMNNDs, 61·8% (58·2–64·0) due to NCDs, and 10·7% (9·6–11·2) due to injuries in 2016 (table 2). For the disease categories within CMNNDs, the proportional contribution to deaths decreased from the lowest to the highest ETL groups. In the NCD categories, the proportion of deaths due to cardiovascular diseases was highest in the high ETL state group and lowest in the low ETL group, but deaths due to chronic respiratory diseases were highest in the low ETL group and lowest in the high ETL group. The proportion of total deaths in the 0–14 years age group was highest in the low ETL state group (14·2%) and lowest in the high ETL state group (4·1%). In this age group, CMNNDs were responsible for the majority of deaths, contributing to 82·5% (95% UI 80·3–84·5) in the low and 72·1% (68·2–76·6) in the high ETL state groups. The proportion of deaths due to injuries was highest in the 15–39 years age group, with 33·6% (95% UI 31·1–35·3) in the low ETL state group and 43·0% (39·6–45·1) in the high ETL state group. The proportion of deaths due to cardiovascular diseases was similar between the 40–69 years and 70 years or older age groups, but, when comparing these two age groups, the proportion of deaths due to neoplasms was higher in the 40–69 years age group, whereas the proportion of deaths due to chronic respiratory diseases was higher in the 70 years or older age group; this trend was similar across the ETL state groups.
Of the top ten individual causes of death in India in 2016, deaths due to all NCD causes increased between 1990 and 2016; the all-age death rate increased significantly for ischaemic heart disease (percentage change 54·5% [95% UI 44·1 to 66·4%]), diabetes (130·8% [111·1 to 150·4%]), and chronic kidney disease (32·7% [18·4 to 49·3%]); and the age-standardised death rate increased for ischaemic heart disease (12·0%
[4·5 to 21·3%]) and diabetes (63·7% [48·1 to 79·1%]), but decreased for chronic obstructive pulmonary disease (COPD; –40·2% [–47·4 to –28·2%]) and cerebrovascular disease (–23·7% [–31·2 to –15·3%]; appendix p 131). Of the leading injury causes, number of deaths increased from road injuries and self-harm (suicide), the all-age and age-standardised death rates increased for road injuries, and the age-standardised death rate decreased for self-harm between 1990 and 2016. The deaths and the all-age and age-standardised death rates decreased significantly for the leading CMNND causes of death such as diarrhoeal diseases, lower respiratory infections, and tuberculosis.
The all-age and age-standardised death rates reduced significantly in India from 1990 to 2016, with a greater reduction in women than that in men (appendix p 132). The reduction in all-age death rates was highest in the low ETL state group (–32·8% [95% UI –36·2 to –29·4]) and lowest in the high ETL state group (–14% [–20·6 to –6·9]), but the reduction in age-standardised death rates was similar across the ETL groups. The ratio of the highest to lowest was 1·9 for all-age death rates and 2·0 for age-standardised death rates between the states in 2016; this ratio was higher for women than for men.
The low ETL state group had 39·9% (95% UI 37·7 to 42·7) of the total DALYs from CMNNDs, 49% (46·4 to 51·0) from NCDs and 11·1% (10·2 to 11·9) from injuries in 2016, and the high ETL state group had 19·5% (18·0 to 21·3), 67·4% (65·5 to 68·9) and 13·1% (11·8 to 14·1) DALYs, respectively (appendix p 124). The number of DALYs due to NCDs increased by 36·4% (28·5 to 45·8) in the high ETL state group from 1990 to 2016, whereas the number increased by 55·0% (47·6 to 62·1) in the higher-middle ETL group, 68·5% (58·2 to 79·5) in the lower-middle group, and 64·9% (55·3 to 76·1) in the low group (appendix p 125). The all-age DALY rates due to NCDs remained almost the same across all ETL state groups over this period, but the age-standardised rates decreased significantly in all four ETL groups, with a minimum decrease of 9·4% (95% UI 14·2 to 4·0) in the low ETL state group and a maximum decrease of 17·3% (21·8 to 12·0) in the high ETL state group. The number of DALYs due to injuries increased significantly from 1990 to 2016 in the lowest (29·5% [95% UI 18·0 to 45·5]), lower-middle (36·6% [23·9 to 51·3]), and higher-middle (13·5% [4·4 to 23·8]) ETL state groups, but the change in the high ETL group was not significant –0·2 (–9·9 to 10·1). However, both the all-age and age-standardised DALY rates due to injuries significantly decreased across all
Ratio ≤0·30 0·31−0·40 0·41−0·55 0·56−0·75 0·76−1·00 1·01−1·30 1·31−1·70 >1·70 Ratio ≤0·30 0·31−0·40 0·41−0·55 0·56−0·75 0·76−1·00 1·01−1·30 1·31−1·70 >1·70 A B Andhra Pradesh (0·37) Arunachal Pradesh (0·55) Assam (0·62) Bihar (0·74) Chhattisgarh (0·60) Delhi (0·38) Goa (0·21) Gujarat (0·46) Haryana (0·40) Himachal Pradesh (0·30) Jammu and Kashmir
(0·34) (0·69) Karnataka (0·34) Kerala (0·16) Madhya Pradesh (0·60) Maharashtra (0·33) Manipur (0·42) Meghalaya (0·64) Mizoram (0·53) Nagaland (0·47) Odisha (0·58) Punjab (0·29) Rajasthan (0·66) Sikkim (0·45) Tamil Nadu (0·26) Telangana (0·38) Tripura (0·45) Uttar Pradesh (0·68) Uttarakhand (0·46) Jharkhand West Bengal (0·33) Andhra Pradesh (1·50) Arunachal Pradesh (1·96) Assam (1·66) Bihar (2·06) Chhattisgarh (1·97) Delhi (1·16) Goa (0·84) Gujarat (1·47) Haryana (1·34) Himachal Pradesh (1·14) Jammu and Kashmir
(1·14) (2·04) Karnataka (1·16) Kerala (0·49) Madhya Pradesh (2·05) Maharashtra (1·10) Manipur (1·37) Meghalaya (1·98) Mizoram (1·18) Nagaland (1·52) West Bengal (1·34) Odisha (2·00) Punjab (1·05) Rajasthan (2·05) Sikkim (1·44) Tamil Nadu (1·02) Telangana (1·33) Tripura (1·38) Uttar Pradesh (2·08) Uttarakhand (1·40) l Jharkhand
Figure 1: Epidemiological transition ratios of the states of India (A) 1990 and (B) 2016. The states of Chhattisgarh, Jharkhand, Telangana, and Uttarakhand did not exist in 1990, as they were created from existing larger states in 2000 or later. Data for these four new states were disaggregated from their parent states based on their current district composition. These states are shown in the 1990 map for comparison with 2016.
ETL state groups. The number of DALYs decreased significantly for CMNNDs from 1990 to 2016 across all ETL state groups (minimum decrease 48·6% [95% UI
53·6 to 43·5] in the lower-middle ETL group, maximum decrease 65·8% [70·5 to 60·9] in the high ETL group), as did the age-standardised rates (minimum decrease
Figure 2: DALYS for states grouped by epidemiological transition level and all of India from 1990 to 2016
(A) Total DALYs in millions. (B) All-age DALY rates per 100 000 people. (C) Age-standardised DALY rates per 100 000 people. DALY=disability-adjusted life-year. ETL=epidemiological transition level.
1990 1995 2000 2005 2010 2016 0 Number of DA LY s (millions) Year 50 100 150 200A
Low ETL group (626 million)
1990 1995 2000 2005 2010 2016 0 Year 10 20 40 50B
Low ETL group (626 million)
1990 1995 2000 2005 2010 2016 0 Year 10 20 40 30 30 50C
Low ETL group (626 million)
0 Number of DA LY s (millions) 10 30 20 40 50
Lower-middle ETL group (92 million)
0 10 20 40 50
Lower-middle ETL group (92 million)
0 10 20 40 30 30 50
Lower-middle ETL group (92 million)
0 Number of DA LY s (millions) 50 100 150
Higher-middle ETL group (446 million)
0 10 20 40 50
Higher-middle ETL group (446 million)
0 10 20 40 30 30 50
Higher-middle ETL group (446 million)
0 Number of DA LY s (millions) 10 20 30 40 50
High ETL group (152 million)
0 10 20 40 50
High ETL group (152 million)
0 10 20 40 30 30 50
High ETL group (152 million)
0 Number of DA LY s (millions) 100 200 300 India (1316 million) 0 DA LY s per 100 000 people (thousands) DA LY s per 100 000 people (thousands) DA LY s per 100 000 people (thousands) DA LY s per 100 000 people (thousands) DA LY s per 100 000 people (thousands) DA LY s per 100 000 people (thousands) DA LY s per 100 000 people (thousands) DA LY s per 100 000 people (thousands) DA LY s per 100 000 people (thousands) DA LY s per 100 000 people (thousands) 10 20 40 50 India (1316 million) 0 10 20 40 30 30 50 India (1316 million)
Communicable, maternal, neonatal,
Low ETL group (ratios 0·56–0·75)
*
Low
er
-middle ETL group (ratios 0·41–0·55)
*
Higher
-middle ETL group (ratios 0·31–0·40)
*
High ETL group (ratios ≤0·30)
*
All ages
0–14 years (14·2% of total deaths) 15–39 years (11·8% of total deaths) 40–69 years (38·6% of total deaths) ≥70 years (35·4% of total deaths) All ages 0–14 years (10·5% of total deaths) 15–39 years (12·0% of total deaths) 40–69 years (39·6% of total deaths) ≥70 years (37·9% of total deaths)
All ages
0–14 years (6·9% of total deaths) 15–39 years (11·5% of total deaths) 40–69 years (51·7% of total deaths) ≥70 years (40·0% of total deaths)
All ages
0–14 years (4·1% of total deaths) 15–39 years (9·1% of total deaths) 40–69 years (41·0% of total deaths) ≥70 years (45·8% of total deaths)
Communicable, maternal, neonatal, and nutritional diseases 34·7 (31·9– 39·7) 82·5 (80·3– 84·5) 34·6 (32·2– 38·2) 21·9 (19·7– 26·1) 29·6 (24·4– 38·0) 26·0 (23·9– 28·5) 79·3 (77·3– 81·4) 28·7 (27·0– 30·7) 17·0 (15·8– 18·9) 19·8 (16·3– 24·4) 20·9 (19·1– 24·2) 77·9 (75·5– 80·2) 23·6 (21·9– 25·8) 13·4 (12·2– 15·7) 18·2 (14·9– 23·5) 15·9 (13·9– 19·3) 72·1 (68·2– 76·6) 18·3 (16·6– 20·6) 10·9 (9·5– 13·2) 14·8 (12·1– 20·0)
HIV/AIDS and tuberculosis
6·4 (6·0– 6·8) 1·1 (0·9– 1·2) 12·7 (11·9– 13·5) 8·6 (8·0– 9·1) 4·1 (3·6– 4·6) 6·9 (6·5– 7·3) 1·4 (1·1– 1·6) 14·4 (13·2– 15·8) 8·7 (8·0– 9·3) 4·2 (3·7– 4·6) 4·2 (3·9– 4·5) 1·2 (1·1– 1·3) 10·2 (9·5– 11·1) 5·1 (4·7– 5·5) 2·1 (1·9– 2·3) 3·4 (3·2– 3·7) 0·9 (0·8– 1·1) 7·7 (6·9– 8·5) 4·1 (3·9– 4·5) 2·1 (1·9–2·3) Diarrhoea, low er respiratory , and
other common infectious diseases 19·8 (16·9– 25·3) 38·4 (35·3– 41·6) 12·5 (9·9– 17·0) 11·0 (8·7– 15·5) 24·4 (18·8– 33·4) 12·4 (10·4– 15·2) 31·0 (28·2– 33·8) 8·2 (6·8– 10·2) 6·6 (5·4– 8·5) 14·7 (11·1– 19·5) 11·7 (9·7– 15·3) 28·5 (25·7– 31·8) 7·8 (6·2– 10·3) 6·7 (5·4– 9·2) 15·2 (11·9– 20·7) 9·7 (7·8– 13·2) 27·6 (24·1– 31·5) 6·9 (5·3–9·3) 5·7 (4·4– 8·1) 12·2 (9·3– 17·5)
Neglected tropical diseases
and malaria 1·1 (0·6– 1·5) 4·0 (1·9– 6·0) 1·7 (0·9– 2·2) 0·7 (0·3– 0·8) 0·2 (0·1– 0·3) 0·9 (0·4– 1·3) 4·4 (1·9– 6·8) 1·4 (0·6– 1·9) 0·6 (0·2– 0·7) 0·2 (0·1– 0·3) 0·6 (0·3– 0·8) 2·9 (1·5– 4·0) 1·2 (0·5– 1·6) 0·5 (0·2– 0·6) 0·2 (0·1– 0·2) 0·4 (0·2– 0·5) 2·5 (1·4– 3·7) 0·8 (0·4–1·2) 0·4 (0·2– 0·5) 0·2 (0·1–0·2) Maternal disorders 0·7 (0·6– 0·8) 0·0 (0·0– 0·0) 5·1 (4·3– 5·9) 0·2 (0·1– 0·2) NA 0·3 (0·3– 0·4) 0·0 (0·0– 0·0) 2·6 (2·1– 3·1) 0·1 (0·1– 0·1) NA 0·3 (0·3– 0·3) 0·0 (0·0– 0·0) 2·3 (2·0– 2·6) 0·1 (0·1– 0·1) NA 0·2 (0·1– 0·2) 0·0 (0·0– 0·0) 1·7 (1·4–2·0) 0·0 (0·0– 0·0) NA Neonatal disorders 4·9 (4·5– 5·4) 34·7 (33·3– 36·2) NA NA NA 4·1 (3·5– 5·0) 39·5 (37·3– 42·1) NA NA NA 2·9 (2·6– 3·3) 42·2 (40·8– 43·6) NA NA NA 1·6 (1·3– 1·9) 38·8 (36·0– 42·2) NA NA NA Nutritional deficiencies 0·7 (0·6– 0·8) 2·5 (2·1– 3·0) 0·4 (0·4– 0·5) 0·4 (0·4– 0·4) 0·4 (0·3– 0·4) 0·3 (0·3– 0·4) 1·5 (1·2– 1·9) 0·2 (0·2– 0·2) 0·2 (0·2– 0·2) 0·2 (0·2– 0·2) 0·3 (0·3– 0·4) 1·6 (1·4– 1·9) 0·3 (0·2– 0·3) 0·3 (0·2– 0·3) 0·2 (0·2– 0·3) 0·2 (0·1– 0·2) 1·0 (0·8– 1·3) 0·1 (0·1–0·2) 0·1 (0·1– 0·1) 0·1 (0·1–0·1)
Other communicable, maternal, neonatal, and nutritional diseases
1·1 (1·0– 1·2) 1·8 (1·4– 2·2) 2·3 (2·0– 2·4) 1·0 (0·9– 1·1) 0·5 (0·4– 0·5) 0·9 (0·9– 1·0) 1·5 (1·2– 2·0) 1·9 (1·7– 2·1) 0·9 (0·8– 1·0) 0·5 (0·4– 0·5) 0·8 (0·8– 0·9) 1·6 (1·3– 1·9) 1·8 (1·7– 1·9) 0·8 (0·8– 0·9) 0·4 (0·4– 0·5) 0·5 (0·4– 0·5) 1·3 (1·0– 1·8) 1·0 (0·9–1·2) 0·5 (0·4– 0·5) 0·3 (0·2– 0·3)
Non- communicable diseases 55·2 (50·6– 58·1) 10·8 (9·2– 12·5) 31·9 (30·3– 33·5) 69·1 (65·3– 71·4) 65·5 (57·7– 70·8) 63·3 (60·8– 65·4) 13·3 (11·9– 14·8) 35·3 (33·8– 37·5) 74·1 (72·2– 75·5) 74·8 (70·4– 78·1) 67·9 (64·9– 69·8) 13·9 (12·4– 15·5) 37·0 (35·7– 39·4) 77·2 (75·0– 78·5) 76·5 (71·3– 79·5) 72·3 (68·9– 74·2) 18·5 (14·9– 21·7) 38·7 (37·1– 41·6) 78·3 (76·0– 79·9) 78·3 (73·2– 81·0) Neoplasms 7·9 (7·3– 8·3) 0·8 (0·6– 0·9) 6·0 (5·6– 6·4) 12·6 (11·9– 13·1) 6·2 (5·5– 6·7) 8·4 (8·0– 8·8) 1·2 (1·0– 1·4) 5·8 (5·5– 6·2) 13·1 (12·5– 13·7) 6·2 (5·8– 6·7) 8·7 (8·3– 9·0) 1·4 (1·2– 1·6) 6·3 (6·0– 6·6) 12·8 (12·3– 13·2) 6·4 (6·0– 6·7) 9·0 (8·5– 9·3) 1·7 (1·4– 2·0) 5·8 (5·5–6·2) 13·4 (12·8– 14·0) 6·3 (5·8– 6·5) Cardio vascular diseases 21·9 (20·1– 23·1) 0·4 (0·4– 0·5) 10·5 (9·9– 11·1) 28·2 (26·5– 29·3) 27·4 (24·3– 29·5) 28·9 (27·6– 30·1) 0·6 (0·5– 0·7) 13·6 (12·8– 14·5) 34·7 (33·4– 35·8) 35·5 (33·5– 37·4) 34·1 (32·5– 35·1) 0·7 (0·6– 0·8) 14·6 (14·0– 15·4) 39·3 (38·0– 40·3) 40·0 (37·4– 41·6) 37·4 (35·6– 38·7) 0·8 (0·7– 1·0) 17·4 (16·3– 18·4) 40·3 (38·8– 41·4) 42·1 (39·3– 44·0)
Chronic respiratory diseases 12·2 (10·9– 13·5) 0·3 (0·2– 0·5) 2·3 (2·1– 2·8) 14·2 (13·0– 15·4) 18·1 (15·7– 20·3) 11·8 (10·9– 12·6) 0·4 (0·3– 0·5) 2·5 (2·3– 2·8) 12·1 (11·1– 13·0) 17·5 (16·2– 18·8) 10·0 (9·3– 11·0) 0·3 (0·2– 0·4) 1·9 (1·8– 2·3) 9·8 (9·2– 10·7) 14·3 (13·1– 15·9) 7·4 (6·7– 9·1) 0·3 (0·2– 0·5) 1·6 (1·5–2·1) 6·8 (6·2– 8·2) 9·6 (8·6– 12·2) Cirrhosis and other chronic liv er diseases 1·8 (1·6– 2·4) 0·2 (0·2– 0·4) 2·9 (2·6– 3·7) 2·8 (2·6– 3·8) 0·9 (0·7– 1·2) 2·1 (1·9– 2·5) 0·2 (0·2– 0·5) 3·5 (3·1– 4·1) 3·2 (2·9– 3·9) 1·0 (0·9– 1·2) 2·7 (2·4– 2·9) 0·3 (0·2– 0·5) 4·4 (3·8– 5·0) 4·0 (3·5– 4·5) 1·1 (1·0– 1·3) 1·8 (1·6– 2·7) 0·3 (0·2– 0·6) 2·9 (2·5–4·4) 2·8 (2·5– 4·2) 0·9 (0·8– 1·2) Digestiv e diseases 2·6 (2·3– 2·8) 0·8 (0·6– 1·1) 3·2 (2·7– 3·4) 3·4 (2·9– 3·7) 2·3 (2·0– 2·6) 1·8 (1·6– 2·3) 0·6 (0·4– 0·7) 2·0 (1·8– 2·6) 2·2 (2·0– 2·9) 1·7 (1·5– 2·1) 1·7 (1·5– 2·4) 0·6 (0·5– 0·7) 1·9 (1·7– 2·7) 2·0 (1·7– 2·9) 1·5 (1·3– 2·0) 1·5 (1·3– 2·2) 0·5 (0·4– 0·7) 1·7 (1·4–2·5) 1·8 (1·5– 2·7) 1·3 (1·1–1·9) (T able 1 continues on next page)
Low ETL group (ratios 0·56–0·75)
*
Low
er
-middle ETL group (ratios 0·41–0·55)
*
Higher
-middle ETL group (ratios 0·31–0·40)
*
High ETL group (ratios ≤0·30)
*
All ages
0–14 years (14·2% of total deaths) 15–39 years (11·8% of total deaths) 40–69 years (38·6% of total deaths) ≥70 years (35·4% of total deaths) All ages 0–14 years (10·5% of total deaths) 15–39 years (12·0% of total deaths) 40–69 years (39·6% of total deaths) ≥70 years (37·9% of total deaths)
All ages
0–14 years (6·9% of total deaths) 15–39 years (11·5% of total deaths) 40–69 years (51·7% of total deaths) ≥70 years (40·0% of total deaths)
All ages
0–14 years (4·1% of total deaths) 15–39 years (9·1% of total deaths) 40–69 years (41·0% of total deaths) ≥70 years (45·8% of total deaths)
(Continued from previous page) Neurological disorders 1·8 (1·5– 2·1) 0·5 (0·4– 0·6) 1·3 (1·2–1·5) 0·8 (0·7– 0·9) 3·6 (2·9– 4·5) 2·3 (2·0– 2·7) 0·8 (0·7– 0·9) 1·7 (1·5– 1·9) 1·0 (0·9– 1·1) 4·4 (3·7– 5·3) 2·2 (2·0– 2·6) 0·7 (0·6– 0·9) 1·4 (1·4– 1·6) 0·9 (0·8– 1·0) 4·1 (3·4– 5·0) 2·9 (2·5– 3·4) 0·9 (0·7– 1·2) 1·5 (1·4–1·7) 1·0 (0·9– 1·1) 4·9 (4·1– 6·0)
Mental and substance use disorders 0·4 (0·3– 0·4) 0·0 (0·0– 0·0) 1·0 (0·8– 1·2) 0·6 (0·4– 0·6) 0·1 (0·1– 0·1) 0·4 (0·3– 0·5) 0·0 (0·0– 0·0) 1·2 (0·9– 1·4) 0·6 (0·4– 0·7) 0·1 (0·1– 0·1) 0·4 (0·3– 0·5) 0·0 (0·0– 0·0) 1·1 (0·9– 1·3) 0·5 (0·4– 0·6) 0·1 (0·1– 0·1) 0·4 (0·3– 0·4) 0·0 (0·0– 0·0) 1·2 (0·9– 1· 4) 0·5 (0·4– 0·6) 0·1 (0·1–0·1)
Diabetes, urogenital, blood, and endocrine diseases 5·2 (4·7– 6·0) 0·7 (0·6– 0·8) 3·7 (3·5– 4·5) 6·1 (5·7– 7·0) 6·5 (5·7– 7·4) 6·4 (6·0– 6·8) 0·9 (0·8– 1·0) 4·2 (3·7– 4·8) 6·9 (6·5– 7·3) 8·1 (7·5– 8·7) 7·0 (6·7– 7·3) 0·9 (0·8– 1·0) 4·4 (4·2– 4·9) 7·4 (7·0– 7·7) 8·5 (7·9– 9·0) 11·0 (9·9– 11·6) 1·1 (0·9– 1·2) 5·5 (5·1–5·9) 11·2 (9·9– 11·8) 12·9 (11·6– 13·7) Musculosk eletal disorders 0·1 (0·1– 0·1) 0·0 (0·0– 0·0) 0·1 (0·1– 0·1) 0·1 (0·1– 0·1) 0·1 (0·1– 0·1) 0·1 (0·1– 0·1) 0·0 (0·0– 0·0) 0·1 (0·1– 0·1) 0·1 (0·1– 0·1) 0·1 (0·1– 0·1) 0·1 (0·1– 0·1) 0·0 (0·0– 0·0) 0·1 (0·1– 0·1) 0·1 (0·1– 0·1) 0·1 (0·1– 0·1) 0·1 (0·1– 0·1) 0·0 (0·0– 0·0) 0·1 (0·1–0·1) 0·1 (0·1– 0·1) 0·1 (0·1–0·1)
Other non- communicable diseases 1·3 (1·0– 1·6) 7·1 (5·6– 8·7) 0·8 (0·6– 1·0) 0·3 (0·2– 0·4) 0·2 (0·1– 0·3) 1·2 (1·0– 1·4) 8·7 (7·1– 10·0) 0·7 (0·6– 0·8) 0·3 (0·2– 0·4) 0·2 (0·1– 0·3) 0·9 (0·8– 1·1) 9·0 (7·6– 10·4) 0·8 (0·7– 0·9) 0·3 (0·2– 0·4) 0·2 (0·1– 0·3) 0·8 (0·6– 1·0) 13·0 (8·8– 16·0) 1·0 (0·7–1·1) 0·3 (0·3– 0·4) 0·2 (0·1–0·3) Injuries 10·1 (9·1– 10·7) 6·7 (5·6– 7·7) 33·6 (31·1– 35·3) 9·0 (7·9– 9·6) 4·9 (4·2– 5·4) 10·7 (9·9– 11·2) 7·4 (6·4– 8·3) 36·0 (33·9– 37·7) 8·9 (8·2– 9·4) 5·4 (4·8– 6·0) 11·2 (10·0– 11·7) 8·2 (7·0– 9·4) 39·5 (36·4– 41·3) 9·4 (8·2– 9·9) 5·4 (4·6– 5·9) 11·9 (9·9– 12·6) 9·3 (7·9– 10·7) 43·0 (39·6– 45·1) 10·8 (8·9– 11·5) 6·8 (4·9– 7·6) Transport injuries 2·9 (2·7– 3·0) 1·1 (0·9– 1·3) 11·2 (10·4– 12·1) 2·9 (2·7– 3·1) 0·7 (0·6– 0·8) 2·9 (2·7– 3·1) 1·3 (1·1– 1·6) 11·3 (10·3– 12·4) 2·8 (2·6– 3·0) 0·7 (0·7– 0·8) 2·9 (2·8– 3·1) 1·5 (1·3– 1·7) 11·7 (11·0– 12·6) 2·9 (2·7– 3·0) 0·7 (0·7– 0·8) 3·2 (3·0– 3·4) 1·9 (1·5– 2·3) 13·8 (12·7– 15·2) 3·5 (3·2– 3·8) 0·9 (0·8– 1·0) Unintentional injuries 5·0 (4·1– 5·4) 5·2 (4·1– 6·0) 9·9 (8·0– 10·9) 4·4 (3·5– 4·8) 3·9 (3·3– 4·3) 4·9 (4·3– 5·3) 5·5 (4·7– 6·3) 9·3 (7·6– 10·2) 4·0 (3·5– 4·3) 4·3 (3·7– 4·8) 4·8 (4·1– 5·1) 6·0 (4·8– 6·8) 9·2 (7·8– 9·9) 3·9 (3·4– 4·2) 4·1 (3·5– 4·6) 5·2 (3·9– 5·7) 6·4 (5·1– 7·5) 8·6 (7·2–9·2) 4·3 (3·3– 4·7) 5·3 (3·5– 6·0)
Self-harm and interpersonal violence 2·3 (2·1– 2·5) 0·4 (0·3– 0·5) 12·4 (11·4– 13·5) 1·7 (1·5– 1·9) 0·3 (0·3– 0·4) 2·8 (2·6– 3·1) 0·5 (0·4– 0·6) 15·3 (14·1– 16·7) 2·0 (1·8– 2·3) 0·4 (0·3– 0·4) 3·5 (2·8– 3·8) 0·7 (0·6– 0·9) 18·5 (15·8– 20·2) 2·6 (1·9– 2·9) 0·5 (0·4– 0·6) 3·4 (2·6– 3·8) 1·0 (0·8– 1·2) 20·6 (17·1– 22·8) 3·0 (2·0– 3·4) 0·6 (0·4– 0·7) Forces of nature,
conflict and terrorism, and executions and police conflict 0·0 (0·0– 0·0) 0·0 (0·0– 0·0) 0·0 (0·0– 0·1) 0·0 (0·0– 0·0) 0·0 (0·0– 0·0) 0·0 (0·0– 0·0) 0·0 (0·0– 0·0) 0·0 (0·0– 0·1) 0·0 (0·0– 0·0) 0·0 (0·0– 0·0) 0·0 (0·0– 0·0) 0·0 (0·0– 0·1) 0·0 (0·0– 0·1) 0·0 (0·0– 0·0) 0·0 (0·0– 0·0) 0·0 (0·0– 0·0) 0·1 (0·0– 0·1) 0·1 (0·0–0·1) 0·0 (0·0– 0·0) 0·0 (0·0– 0·0) Data are % (95%
uncertainty interval). ETL=epidemiological
transition lev
el. NA=not applicable. *Epidemiological
transition ratios for ETL group.
Table 1: P ercentage contribution of disease categories to total deaths b
y age groups in states grouped b
y ETL
56·2% [60·1 to 51·9] in the lower-middle ETL group, maximum decrease 62·1% [66·7 to 57·2] in the high ETL group).
The disease categories causing 5% or more of total DALYs in India in 2016 were cardiovascular diseases (14·1% [95% UI 12·9–15·3]), diarrhoea, lower respiratory and other common infectious diseases (12·7% [11·1–15·0]), neonatal disorders (7·9% [7·2–8·8]), chronic respiratory diseases (6·4% [5·8–7·0)), diabetes, uro-genital, and endocrine diseases (5·6% [5·2–6·0]), mental and substance abuse disorders (5·6% [4·5–6·7]), unintentional injuries (5·4% [4·7–5·8]), and neoplasms (5% [4·6–5·5]; appendix p 124). The contribution of most CMNNDs to the proportion of DALYs decreased, and that of most NCDs and injuries increased from 1990 to 2016 across all ETL state groups.
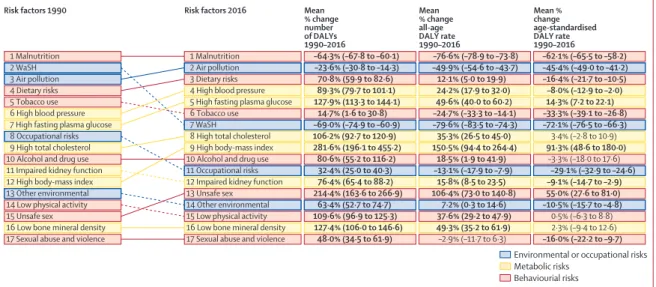
The top five individual causes of disease burden in India in 1990 were CMNNDs, whereas in 2016, three of the top five causes were NCDs, showing a shift toward NCDs (figure 3). The number of DALYs due to most NCDs increased from 1990 to 2016. Of the individual NCDs that are in the top 30 leading causes of DALYs in 2016, the increase in all-age DALY rate between 1990 and 2016 was highest for diabetes (80·0% [95% UI 71·6–88·5]), ischaemic heart disease (33·9% [24·7–43·6]), and sense organ diseases (mainly vision and hearing loss disorders; 21·7% [20·1–23·3]); the rates for low back and neck pain, migraine, other musculoskeletal disorders, chronic kidney disease, depressive disorders, and anxiety disorders were also significantly increased (figure 3). The age-standardised DALY rate increased significantly only for diabetes (39·6% [95% UI 32·1–46·7]) and skin diseases (5·3% [2·1–8·6]). Number of DALYs for COPD increased significantly by 36·3% (95% UI 21·1–56·8) and cerebrovascular disease by 52·9% (40·4–66·7); however, their all-age DALY rates did not change significantly and their age-standardised DALY rates decreased significantly. DALYs due to each of the three leading causes of injury in India increased from 1990 to 2016 (road injuries 65·1% [95% UI 53·4 to 76·6], falls 41·3% [17·4 to 59·5], and self-harm 29·8% [15·2 to 52·4]), the all-age DALY rate increased sig-nificantly for road injuries (8·3% [0·7 to 15·9]), and the age-standardised DALY rates decreased significantly for self-harm (–19·5% [–28·2 to –5·7) and falls (–12·6% [–25·1 to –4·2]). The number, all-age rates, and age-standardised rates of all CMNNDs in the leading 30 causes in 1990 decreased substantially by 2016, except for iron-deficiency anaemia, for which the number of DALYs increased by 41·8% (95% UI 39·9–43·8), and the all-age DALY rate decreased by 6·9% with no significant change in age-standardised rate. In 2016, road injuries and self-harm were among the top ten causes of DALYs for men, whereas no injury cause was in the top ten for women (appendix pp 132–133). Iron-deficiency anaemia, migraine, and low back and neck pain were among the top ten causes of DALYs for women, but not for men.
All ages 0–14 years (10·4% of total deaths) 15–39 years (11·4% of total deaths) 40–69 years (39·9% of total deaths) ≥70 years (38·2% of total deaths) Communicable, maternal,
neonatal, and nutritional diseases
27·5
(25·4–31·5) (78·7–82·8)80·8 (27·2–31·9)29·1 (15·8–20·5)17·4 (19·3–29·4)23·0 HIV/AIDS and tuberculosis 5·4
(5·1–5·6) (1·0–1·2)1·1 (11·0–12·1)11·5 (6·5–7·2)6·9 (2·8–3·4)3·1 Diarrhoea, lower
respiratory, and other common infectious diseases
15·5
(13·3–19·9) (32·4–38·4)35·3 (8·1–13·6)10·1 (7·0–12·1)8·7 (14·9–25·6)19·0
Neglected tropical diseases
and malaria (0·4–1·1)0·8 (1·8–5·3)3·7 (0·7–1·8)1·4 (0·3–0·7)0·6 (0·1–0·3)0·2 Maternal disorders 0·5 (0·4–0·5) (0·0–0·0)0·0 (3·3–4·1)3·7 (0·1–0·1)0·1 NA Neonatal disorders 3·8 (3·6–4·1) (35·7–38·2)36·9 NA NA NA Nutritional deficiencies 0·5 (0·4–0·5) (1·9–2·5)2·2 (0·3–0·4)0·3 (0·3–0·3)0·3 (0·2–0·3)0·3 Other communicable,
maternal, neonatal, and nutritional diseases 0·9 (0·9–1·0) (1·4–2·0)1·7 (1·8–2·1)2·0 (0·8–0·9)0·9 (0·4–0·5)0·4 Non-communicable diseases (58·2–64·0)61·8 (10·6–13·5)12·0 (33·1–36·4)34·4 (70·4–74·9)73·2 (65·5–75·4)71·6 Neoplasms 8·3 (7·9–8·6) (0·8–1·1)1·0 (5·8–6·3)6·1 (12·2–13·2)12·8 (5·8–6·6)6·3 Cardiovascular diseases 28·1 (26·5–29·1) (0·4–0·6)0·5 (12·1–13·3)12·7 (32·4–34·7)33·8 (31·5–35·8)34·3 Chronic respiratory diseases 10·9
(9·9–12·0) (0·2–0·5)0·3 (1·9–2·6)2·1 (10·9–12·7)11·7 (13·9–17·4)15·6 Cirrhosis and other chronic
liver diseases (1·9–2·5)2·1 (0·2–0·4)0·2 (3·1–4·0)3·4 (3·0–3·9)3·3 (0·9–1·2)1·0 Digestive diseases 2·2
(2·0–2·4) (0·6–0·9)0·7 (2·4–2·8)2·5 (2·5–3·1)2·7 (1·7–2·2)1·9 Neurological disorders 2·1
(1·8–2·5) (0·5–0·7)0·6 (1·3–1·5)1·4 (0·8–1·0)0·9 (3·3–4·9)4·0 Mental and substance use
disorders (0·3–0·4)0·4 (0·0–0·0)0·0 (0·8–1·2)1·1 (0·4–0·6)0·5 (0·1–0·1)0·1 Diabetes, urogenital, blood,
and endocrine diseases (6·2–6·9)6·5 (0·7–0·9)0·8 (3·9–4·7)4·2 (6·9–7·6)7·2 (7·5–8·7)8·2 Musculoskeletal disorders 0·1 (0·1–0·1) (0·0–0·0)0·0 (0·1–0·1)0·1 (0·1–0·1)0·1 (0·1–0·1)0·1 Other non-communicable diseases (0·9–1·3)1·1 (6·7–9·2)7·9 (0·7–1·0)0·8 (0·2–0·4)0·3 (0·1–0·3)0·2 Injuries 10·7 (9·6–11·2) (6·1–8·2)7·2 (34·0–38·1)36·5 (8·2–9·8)9·4 (4·5–5·9)5·4 Transport injuries 2·9 (2·8–3·1) (1·1–1·4)1·2 (11·0–12·4)11·6 (2·8–3·1)3·0 (0·7–0·8)0·8 Unintentional injuries 4·9 (4·1–5·3) (4·4–6·2)5·4 (7·8–10·3)9·5 (3·4–4·5)4·2 (3·4–4·6)4·2 Self-harm and interpersonal
violence (2·4–3·1)2·8 (0·4–0·6)0·5 (13·8–16·5)15·4 (1·7–2·4)2·2 (0·3–0·5)0·4 Forces of nature, conflict
and terrorism, and executions and police conflict
0·0
(0·0–0·0) (0·0–0·0)0·0 (0·0–0·1)0·0 (0·0–0·0)0·0 (0·0–0·0)0·0
Data are % (95% uncertainty interval). NA=not applicable.
The all-age prevalence increased from 1990 to 2016 for most of the leading NCD causes of DALYs, but the age-standardised prevalence increased only for ischaemic heart disease, cerebrovascular disease, diabetes and skin diseases, whereas all other causes remained unchanged or had minor decreases (appendix p 126). The percent increase in prevalence was more than or similar to the percent change in the DALY rates for most of the leading NCDs. Similarly, among the leading causes of injuries, the percent increases in the incidence rate of road injuries were much higher than the percent increase in DALY rates; for self-harm and falls the DALY rates decreased whereas the incidence did not change markedly.
The DALY rates were not consistent across the state ETL groups for individual NCDs and injuries (figure 4; appendix p 134). Compared with the other ETL state groups, the all-age DALY rates for ischaemic heart disease, diabetes, sense organ disease, self-harm, low back and neck pain, migraine, falls, other musculo-skeletal disorders, chronic kidney disease, depressive disorders, and anxiety disorders were highest in the high ETL state group; and the rates for COPD, asthma,
congenital defects, rheumatic heart disease, and
drowning were higher in the low ETL state group. The
ETL group with the highest DALY rate for cerebrovascular disease was the higher-middle ETL group, but the individual states with the highest DALY rates were spread over the low, lower-middle, and higher-middle ETL groups (figure 4). Some variations were recorded within the ETL state groups: within the high ETL state group, all-age DALY rates were about two-times higher for ischaemic heart disease in Punjab and Tamil Nadu than in Himachal Pradesh, and within the low ETL state group, rates of COPD were markedly higher in Rajasthan and Uttar Pradesh than other states. The all-age DALY rates for the leading CMNNDs were generally highest in the low ETL state group, with substantial variations between individual states within ETL groups. For example, in the low ETL state group, Odisha and Jharkhand had the highest DALY rates for diarrhoeal diseases but had some of the lowest rates for lower respiratory infections. The range of all-age DALY rates across the states was wide for many of the leading causes, and the highest state-specific rate was more than five times the lowest state-specific rate for five of the top ten causes in 2016 (appendix p 135).
The ratio of the observed versus expected DALY rate based on SDI were assessed (appendix p 127). The highest ratios for ischaemic heart disease, diabetes, and
Figure 3: Change in DALY number and percent change in rates for the leading 30 causes 1990–2016, India
Causes are connected by lines between time periods. Three measures of change are shown: percent change in the number of DALYs, percent change in all-age DALY rate and percent change in age-standardised DALY rate. COPD=chronic obstructive pulmonary disease. DALY=disability-adjusted life-year.
Leading causes 1990 Leading causes 2016 Mean % change number of DALYs 1990–2016 Mean % change all-age DALY rate 1990–2016 Mean % change age-standardised DALY rate 1990–2016
2 Lower respiratory infectionsp y 2 COPD
9 Neonatal encephalopathyp p y 19 Asthma 33 Malaria 32 Other musculoskeletal 38 Neonatal sepsis 35 Diabetes 59 Measles 37 Rheumatic heart disease
66 Neonatal haemolytic 41 Anxiety disorders 109 Tetanus 102 HIV/AIDS –71·3% (–75·9 to –65·1) –59·1% (–64·9 to –51·2) –40·4% (–50·1 to –30·5) –69·2% (–73·0 to –66·2) –41·5% (–54·0 to –25·8) –49·2% (–59·5 to –37·1) –49·5% (–58·0 to –42·1) 568·5% (517·2 to 620·8) –54·4% (–65·2 to –26·6) –40·3% (–53·4 to –24·3) –48·2% (–56·3 to –33·9)
Communicable, maternal, neonatal,
chronic kidney disease were in the high ETL state group, and the highest ratios for COPD and asthma were in the low ETL state group, similar to the trends of DALY rates of these diseases across the ETL groups (figure 4). By contrast, the highest ratio of the observed versus expected DALY rate for diarrhoeal diseases and iron-deficiency anaemia was in the high ETL state group, whereas the DALY rates for these were the lowest in the high ETL state group. For India as a whole, the ratios of the observed versus expected DALY rates were 2·10–3·00 for COPD, diarrhoeal diseases, iron-deficiency anaemia, other neonatal disorders and rheumatic heart disease; 3·61 for tuberculosis and 4·19 for HIV/AIDS; and 61·75 for intestinal infectious diseases (mainly typhoid and paratyphoid fevers; appendix p 127).
DALY rates reduced significantly in India by 43·1% (95% UI 45·9–40·3; all-age rate) and 36·2% (38·6–33·8; age-standardised rate) from 1990 to 2016 (appendix p 128). The reductions were slightly greater for women than for men. The ratio of the all-age DALY rate in the
low ETL to the high ETL state group dropped from 1·48 in 1990 to 1·20 in 2016, but this ratio did not change much for age-standardised DALY rates. The highest age-standardised DALY rate of an individual state in 2016 was 1·8 times the lowest.
We assessed DALY burden in India in 2016 by age group, taking into account the proportion of the total population that each age group contributes. The age groups of younger than 5 years and 45 years or older all had a higher proportion of the total DALY burden relative to their proportion of the population (ratio >1; figure 5). The younger than 5 years group had 17·6% of the DALYs and constituted 8·5% of the population, a ratio of 2·1, which was an improvement from a ratio of 3·6 in 1990 (appendix p 136). This ratio of DALYs to population in 2016 increased from 1·1 in the 45–49 years group to 2·1 in the 60–64 years group, and further to 4·5 in the 85 years and older group. The highest proportion of DALYs attributed to CMNNDs were in children younger than 5 years (83·4%), and the lowest
Figure 4: All-age DALY rates of the leading 30 causes of DALYs in the states of India, 2016
Green shows values lower than the national mean all-age DALY rate for that cause, yellow shows values indistinguishable from the national mean, and red shows value higher than the national mean. COPD=chronic obstructive pulmonary disease. DALY=disability-adjusted life-year. ETL=epidemiological transition level.
Ischaemic heart disease COPD Diarrhoeal diseases Lower respiratory infections Cerebrovascular disease Iron-deficiency anaemia Neonatal preterm birth Tuberculosis Sense organ diseases Road injuries Self-harm Low back and neck pain Diabetes Other neonatal Migraine Skin diseases Falls Congenital defects Other musculoskeletal Chronic kidney disease Depressive disorders Neonatal encephalopathy Asthma Intestinal infections HIV/AIDS Anxiety disorders Meningitis Rheumatic heart disease Protein-energy malnutrition Drowning
India 3062 1700 1642 1537 1243 1235 1195 1126 1023 1009 884 806 792 736 733 684 652 638 584 583 581 532 450 417 375 310 288 286 265 262
Low ETL group 2327 1894 2365 2185 1130 1387 1423 1498 970 1023 701 724 647 1095 693 697 633 782 539 462 490 654 529 602 332 292 351 328 368 299
Bihar 2431 1452 2827 2378 1032 1610 1287 871 947 773 369 695 611 1150 659 661 576 1205 509 446 424 972 423 402 432 290 311 385 292 345 Jharkhand 2313 1146 3420 1577 932 1471 1147 1322 925 1018 467 720 632 801 680 686 538 571 526 492 486 607 343 357 432 321 256 296 315 391 Uttar Pradesh 2313 2402 2380 2240 734 1319 1458 1991 955 1170 788 719 651 1144 682 714 721 841 523 402 462 592 665 720 188 292 447 313 449 210 Rajasthan 2343 2570 1490 2706 775 1397 1640 1400 970 1171 614 663 443 1159 710 687 506 524 544 359 474 528 679 846 288 328 326 261 344 313 Meghalaya 957 767 1344 1500 791 1218 960 1255 769 579 429 658 468 430 693 714 433 523 506 437 581 646 284 637 193 301 299 207 223 174 Assam 1638 1653 2309 2018 2229 1472 1534 1531 923 911 859 678 787 955 727 698 473 642 590 625 571 824 493 371 365 311 249 355 257 486 Chhattisgarh 2347 1219 2193 1933 2142 1196 1624 1362 1086 920 999 797 776 1109 731 712 646 515 576 537 468 660 339 523 406 250 246 351 396 330 Madhya Pradesh 2883 1599 1835 2090 1293 1335 1582 1294 985 997 903 764 741 1212 707 700 601 707 551 441 496 428 448 714 381 243 358 320 415 354 Odisha 1766 1177 2978 1555 2259 1246 989 1382 1082 913 765 847 730 780 739 710 810 488 612 792 739 689 329 338 625 316 236 380 241 263
Lower-middle ETL group 3302 1704 1001 1364 919 1141 1299 1326 980 982 844 818 729 631 742 683 658 644 581 537 533 600 443 352 475 300 314 251 234 241
Arunachal Pradesh 957 786 1204 1210 739 887 1023 888 758 717 819 671 527 531 699 713 469 469 502 412 608 448 251 249 592 303 232 150 197 247 Mizoram 663 1624 919 1306 455 678 933 639 885 903 335 763 513 622 733 689 547 492 554 473 467 476 383 780 609 312 261 91 112 162 Nagaland 1167 648 526 1087 993 537 746 762 763 722 254 689 440 263 723 728 458 325 514 438 503 350 257 527 793 313 181 188 82 243 Uttarakhand 2773 2410 1059 1962 793 1008 1056 1284 996 1481 654 814 795 619 734 747 698 554 569 517 505 462 552 620 413 317 369 266 309 280 Gujarat 3736 1694 959 1257 830 1228 1390 1453 994 927 867 830 729 669 744 671 700 705 587 537 536 661 444 306 459 290 328 254 243 236 Tripura 2330 1676 1464 1847 2259 1197 1411 545 1004 816 1547 811 734 574 748 672 387 490 600 644 513 455 518 185 291 319 201 310 198 239 Sikkim 1526 961 606 1527 488 954 893 644 808 712 629 713 549 494 707 677 684 364 517 444 500 311 303 398 213 303 214 158 141 150 Manipur 1568 1021 1364 1159 1488 463 827 1024 947 1125 657 797 947 324 752 678 320 341 582 632 610 366 240 400 1010 415 178 232 68 272
Higher-middle ETL group 3560 1566 1052 957 1555 1126 1034 742 1053 977 1086 865 808 433 767 676 637 495 628 648 669 425 391 247 441 328 231 262 178 240
Haryana 4244 2091 1109 1311 814 1293 950 1157 951 1473 796 805 817 748 734 693 582 511 580 584 703 432 485 522 317 315 292 246 309 207 Delhi 2569 921 485 799 561 925 900 850 834 826 403 722 869 696 763 691 519 438 580 536 475 451 192 423 238 322 233 247 159 95 Telangana 3257 1442 1391 780 1051 1055 1142 585 1068 930 1113 877 733 286 769 660 723 473 598 492 786 439 381 292 706 326 202 243 148 173 Andhra Pradesh 4023 1585 1292 951 1214 1294 1150 611 1065 1066 1246 878 841 320 768 655 753 572 615 580 790 559 434 354 570 325 236 292 136 218 Jammu and Kashmir 3256 1976 821 1268 906 953 814 583 950 1614 464 779 586 489 728 670 528 513 556 683 490 302 403 147 167 315 215 238 122 204 Karnataka 3892 1726 1228 777 1349 1106 1210 746 1123 950 1522 876 1202 451 785 670 689 696 618 677 619 614 445 167 471 325 267 295 217 257 West Bengal 3203 1377 993 1074 2821 1157 894 669 1067 857 1207 871 600 420 774 685 498 395 624 715 570 309 376 139 433 341 215 290 157 307 Maharashtra 3658 1638 927 937 1341 1077 1044 808 1071 916 920 892 788 414 763 679 687 448 680 679 734 369 376 242 387 326 218 222 184 243 Union territories other than Delhi 2321 818 443 608 629 990 876 691 890 862 899 825 784 225 774 682 773 468 563 708 633 363 228 147 372 326 245 244 78 166
High ETL group 4487 1292 781 671 986 987 665 598 1181 1066 1075 960 1377 209 789 659 775 461 641 922 729 301 299 193 296 337 183 210 110 185
Himachal Pradesh 2463 2176 749 825 656 813 710 673 1103 912 630 915 512 391 777 675 807 389 607 515 593 377 442 256 332 331 163 179 69 118 Punjab 5758 1335 881 887 979 1093 650 656 1082 1425 481 902 1314 422 768 672 588 457 636 850 505 368 293 434 376 298 220 237 118 140 Tamil Nadu 4788 1246 920 714 938 1199 727 754 1184 1121 1435 949 1628 165 790 655 921 474 638 1026 857 348 296 183 271 314 196 229 125 218 Goa 2933 1089 402 614 1058 645 542 351 1098 758 559 976 1090 297 794 660 718 385 632 613 613 230 249 21 414 271 114 99 130 192 Kerala 3309 1187 438 380 1153 515 548 228 1273 706 928 1039 1094 87 807 653 624 454 658 858 679 138 284 14 270 420 133 161 80 167
Lower than national mean Indistinguishable from national mean Higher than national mean Communicable, maternal, neonatal, and nutritional diseases
Non-communicable diseases Injuries
was in the 50–54 year age group (14·7%). The proportion of DALYs due to NCDs exceeded 50% in the 30–34 years group and was highest at 78·8% in the 65–69 years group. The proportion of total DALYs due to injuries was highest in the age groups from 15 years to 39 years (range 18·3–28·1%).
Of the total DALYs in India, 67·2% were YLLs and 32·8% were YLDs in 2016, whereas 82·5% were YLLs and 17·5% were YLDs in 1990 (appendix p 137). In 2016, the YLD proportion increased with ETL, from 29·6% in the low group to 39·1% in the high ETL state group. Among the leading 30 disease burden causes in India in 2016, sense organ diseases, low back and neck pain, migraine, depressive disorders, and anxiety disorders contributed only YLDs; and iron-deficiency anaemia, skin diseases, musculoskeletal disorders, and protein-energy malnutrition contributed more YLDs than YLLs (appendix p 138). The leading causes of YLDs were quite different from the leading causes of YLLs. Low back and neck pain, migraine, skin diseases, depressive disorders, other musculoskeletal disorders, diabetes, and anxiety disorders featured in the top ten causes of YLDs, but not in the top ten causes of DALYs. Migraine, depressive disorders, and anxiety disorders had a higher YLD ranking among women than men (data not shown).
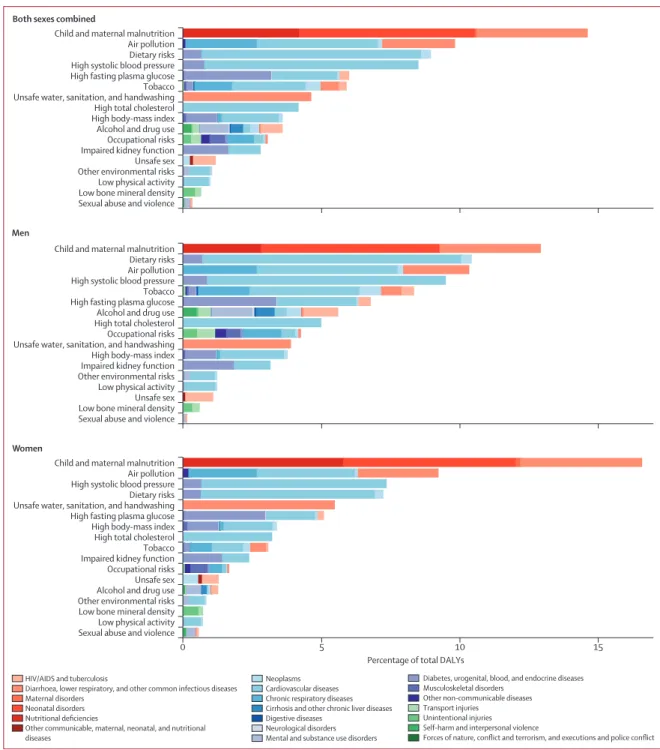
The leading risk factors in India in 2016 responsible for more than 5% of the total DALYs each were child and maternal malnutrition (undernutrition; 14·6%), air pollution (9·8%), dietary risks (unhealthy diet; 8·9%), high systolic blood pressure (8·5%), high
fasting plasma glucose (6%), and tobacco use (includes smoking, second-hand smoke, and smokeless tobacco; 5·9%; figure 6). Child and maternal malnutrition consisted of child growth failure (underweight, wasting, and stunting), low birthweight and short gestation, suboptimal breastfeeding, iron-deficiency anaemia, vitamin A deficiency, and zinc deficiency. Dietary risks comprised of ten components that are protective such as low fruit, low vegetables, low whole grains, and low nuts and seeds, and five components that are harmful such as high sodium, high trans-fats and high red meat. Dietary risks, systolic blood pressure, high total cholesterol, tobacco, and alcohol and drug use contributed more to the DALYs in men than in women, whereas child and maternal malnutrition and unsafe water, sanitation, and handwashing contributed more in women than in men. The proportion of total DALYs due to child and maternal malnutrition and unsafe water sanitation and handwashing were much higher in the low than in the high ETL state group (appendix p 139). The proportion for air pollution was also higher in the low than in the high ETL state group. Conversely, the proportion of total DALYs due to dietary risks, high systolic blood pressure, high fasting plasma glucose, high cholesterol, and high body-mass index were highest in the high ETL state group.
The all-age DALY rate due to child and maternal malnutrition increased with decreasing ETL, with a rate three-times higher in the low ETL group than in the high ETL state group (figure 7). The DALY rate due to unsafe water sanitation and handwashing was 3·4-times higher
Figure 5: Percent of total DALYs by age groups in India, 2016
The number on top of each vertical bar is the ratio of percent DALYs to population for that age group. DALY=disability-adjusted life-year.
(2·1) (0·3) (0·3) (0·5) (0·6) (0·6) (0·7) (0·8) (0·9) (1·1) (1·4) (1·7) (2·1) (2·6) (3·1) (3·6) (4·1) (4·5) 0 Percent of total DA LY s
Age group, years (% of total population) 5 10 15 10–14 (9·7%) (9·4%)15–19 <5 (8·5%) (9·6%)5–9 (9·0%)20–24 (8·7%)25–29 30–34(8·1%) 35–39(7·1%) (6·3%)40–44 (5·5%)45–49 (4·8%)50–54 (4·1%)55–59 60–64(3·4%) 65–69(2·3%) (1·6%)70–74 (1·0%)75–79 80–84(0·6%) (0·3%)≥85 Communicable, maternal, neonatal, and nutritional diseases Non-communicable diseases