Universität Bielefeld
Technische Fakultät
Center for Biotechnology (CeBiTec)
EMMA2
A MAGE-Compliant System for the Analysis of
Microarray Data in Integrated Functional Genomics
Zur Erlangung des akademischen Grades eines Doktors der
Naturwissenschaften an der Technischen Fakult¨
at der
Universit¨
at Bielefeld vorgelegte Dissertation
von
Michael Dondrup
29. Januar 2007
iii Michael Dondrup
Rubensweg 2 33613 Bielefeld
Supervisors: Prof. Dr. Robert Giegerich Prof. Dr. Alfred P¨uhler
v
Summary
Since the acquisition of the first complete genomic sequences, many advances have been made in the field of functional genomics. High-throughput methods have been developed to study gene-expression and metabolic pathways.
Microarrays have become a highly popular method to measure the transcriptional regulation in functional genomics. Microarrays allow to measure the expression levels of thousands of genes in parallel, but the measured datasets contain a certain level of technical and biological variation.
Many methods for the analysis of large datasets from error-prone mircorarray experiments have been developed, including normalization, statistical inference, and machine learning. Attempts to standardize the annotation of microarray data, such as Minimum Information About a Microarray Experiment (MIAME), the MAGE-ML format for data interchange, and ontologies, have been made.
The existing software systems for microarray data analysis have only rudimentary implementations of the mentioned standards and are hard to extend.
The EMMA2 software has been designed to resolve these shortcomings. Its spec-ification includes full support of MIAME and MAGE-ML as well as the support of ontologies. Integration of genomic annotation data and other internal and external data-sources has been an important requirement.
The specification, design, and implementation of EMMA2 follows an object-oriented development paradigm. This is reflected in the use of object-object-oriented modeling tools such as the Unified Modeling Language (UML).
During the design phase, the MAGE object-model was taken as the core of the application to model microarray data and their annotations. Additional models were needed to complement MAGE by classes for access control and data analysis. The software has been implemented using a code-generation approach. The back-end code and database definitions have been derived from the joint object model defined in UML. EMMA2 can be used via a web-interface and contains a Laboratory Information Management System (LIMS) component.
A flexible PlugIn system for data analysis, which includes methods for pre-processing, normalization, statistical tests, cluster analysis, and visualization, has been added. Integration of other functional genomics data sources has been imple-mented by using the integration layer BRIDGE and also by the use of web-services. Data integration allows for several new visualization components using metabolic pathway data and functional categories.
The system is successfully applied in eight national and international projects. More that 2700 microarrays have been processed using EMMA2. Furthermore, an evaluation study has been carried out to compare the performance of inference tests for microarrays. As a result of this study, two methods (SAM an CyberT) can be recommended for experiments with very few replicates, while for larger numbers of replicates the t-test performs comparable.
Contents
List of Figures xi
List of Tables xvii
1 Motivation and Overview 1
2 Introduction 5
2.1 Information Flow and Regulation in the Cell . . . 6
2.2 The New ’Omics Approaches . . . 10
2.3 Analysis of Transcriptional Regulation – Goals and Visions . . . 11
2.4 Open Source Software in ’Omics Research . . . 12
3 Analysis of Gene-Expression 15 3.1 Microarray Technology . . . 15
3.1.1 Spotted Two-Color Microarrays . . . 16
3.1.2 In-Situ Synthesized Microarrays . . . 19
3.1.3 Applications of Microarrays for Genomic DNA Hybridizations 20 3.1.4 Tiling Arrays . . . 20
3.1.5 Protein Arrays . . . 21
3.2 A Sample Analysis Pipeline . . . 21
3.3 Properties Of Microarray Data . . . 23
3.3.1 Variation and Replication . . . 23
3.3.2 Preprocessing and Normalization . . . 26
3.4 Inferring Significant Changes . . . 34
3.4.1 Statistical tests . . . 34
3.4.2 Student’s T-Test . . . 35
3.4.4 Bayesian Testing – CyberT . . . 36
3.4.5 Linear Models and Empirical Bayes Methods – LIMMA . . 37
3.4.6 Permutation Testing – SAM . . . 38
3.4.7 Rank Products . . . 38
3.4.8 The VarMixt Approach . . . 39
3.4.9 Tests for More than Two Groups . . . 40
3.4.10 Multiple Testing . . . 40
3.5 Machine Learning Approaches . . . 41
3.5.1 Cluster Analysis . . . 41
3.5.2 Supervised Machine Learning . . . 46
3.5.3 Towards Systems Biology . . . 47
4 State of the Art in Systems and Standards 49 4.1 Standardization and Specification . . . 49
4.1.1 MIAME . . . 51
4.1.2 MAGE . . . 54
4.1.3 Ontologies . . . 57
4.1.4 Other Standardization Approaches . . . 59
4.2 Categorization of Microarray Software . . . 60
4.3 Scanner and Image Analysis Software . . . 61
4.4 Pure Data Analysis Software . . . 62
4.4.1 Eisen’s Cluster and TreeView . . . 62
4.4.2 J-Express . . . 62
4.5 Public Repositories and Databases . . . 62
4.5.1 ArrayExpress . . . 63
4.5.2 Stanford Microarray Database . . . 65
4.5.3 CIBEX . . . 66
4.5.4 NCBI GEO . . . 68
4.6 LIMS Software . . . 68
4.7 General Purpose Analysis and Storage Systems . . . 69
4.7.1 TIGR TM4 . . . 69
4.7.2 BASE . . . 71
4.7.3 MARS . . . 72
4.7.4 Rosetta Biosoftware Resolver . . . 73
4.8 Extensions to Existing Programming Environments . . . 74
4.8.1 Bioconductor and R . . . 74
5 Requirements and Specification 77 5.1 Use Cases . . . 77
5.2 User Interface . . . 79
5.3 Technical Requirements and Preconditions . . . 81
5.3.1 Data Handling . . . 81
5.3.2 Data Analysis Capabilities . . . 82
Contents ix
5.4 Existing Systems Revisited . . . 84
6 Object-Oriented System Design 87 6.1 Architecture . . . 87
6.2 Object Model . . . 89
6.2.1 MAGE-OM Classes as Core Persistence Model . . . 91
6.2.2 Access Control Model . . . 91
6.2.3 Data-Analysis Model for PlugIns . . . 94
7 Implementation 99 7.1 Choice of Core Development Tools . . . 99
7.1.1 Database Backend . . . 99
7.1.2 Programming Languages and Tools . . . 100
7.1.3 Object-Relational Mapping With O2DBI . . . 101
7.1.4 Mapping of MAGE-OM Classes on O2DBI Classes using XML Transformations . . . 101
7.2 Web-Interface . . . 104
7.2.1 The Web-Interface . . . 104
7.2.2 The ArrayLIMS Interface . . . 107
7.2.3 Access Control . . . 109
7.2.4 Ontology Integration . . . 111
7.3 Data Integration and Interoperability . . . 112
7.3.1 BRIDGE . . . 112
7.3.2 Web-Services and BioMoby . . . 112
7.3.3 EMMA2 as a Web-Service Provider . . . 115
7.3.4 EMMA2 as a Web-Service Client . . . 116
7.4 Implementation of Data Analysis . . . 118
7.4.1 Function Definition . . . 118
7.4.2 The Pipeline API . . . 122
7.4.3 Normalization and Preprocessing . . . 123
7.4.4 Statistical Tests . . . 124
7.4.5 Cluster-Analysis . . . 124
7.4.6 Visualization Methods . . . 124
7.4.7 Scatterplots and MA-plots . . . 125
7.4.8 KEGG-Mapping . . . 125
7.4.9 Categorial PCA-plots . . . 126
7.4.10 Cluster Visualization . . . 127
7.4.11 3D-SOM Viewer . . . 130
8 Applications and their Results 133 8.1 Overview of the Various EMMA2 Projects . . . 133
8.2 The GenoMik Microarray Database . . . 134
8.2.1 Project Specific Requirements and Results . . . 136
8.3.1 Materials and Methods . . . 141
8.3.2 Results . . . 150
8.4 Stress Response Analysis of S. meliloti . . . 152
8.4.1 Project Setup . . . 154
8.4.2 Experiment Design . . . 155
8.4.3 Management of Experimental Protocols and Data . . . 155
8.4.4 Identification of Significant Functional Categories . . . 155
8.5 The Plant Microarray Databases . . . 159
8.5.1 Project Specific Requirements . . . 162
8.5.2 Project Setup . . . 162
8.5.3 Results . . . 163
8.6 The Mamma Carcinoma Microarray Database . . . 165
8.6.1 Project Specific Requirements and Results . . . 165
List of Figures
2.1 A computer scientist’s view on the regulation of protein biosyn-thesis. In the top row, the key molecules involved in gene expres-sion are depicted (molecule images are taken from the Protein Data Bank (http://www.pdb.org), entries 1bna: Drewet al.(1981), 1i6h: Gnatt et al.(2001), 1ffk: Ban et al. (2000), 1ytb: Kimet al. (1993)). 7 3.1 Robotic microarray spotter (Microgrid II) used at the CeBiTec
(left), an enlarged view of the print head with 48 print-tips (cen-ter) and a print-tip (right). . . 16 3.2 Simplified overview of a two color microarray experiment. . . 18 3.3 Enlarged false-color image of a spotted oligonucleotide microarray.
In the center of the image, two enlarged views of a single grid are depicted. The right one depicts circles representing the results of an image segmentation (image provided by Helge K¨uster). . . 18 3.4 Idealized consecutive analysis steps in a microarray experiment as
an activity diagram. The left part of the workflow represents the planning and preparation of the experiment, the central part depicts the actual conduction of the experiment, whereas the right part con-stitutes the analysis an interpretation of the measured data. . . 23 3.5 A test microarray hybridized with a solution of short labeled random
sequences, which can be expected to almost equally bind to each reporter molecule on the surface, yielding a constant signal for each feature. Here, the variation in spot size and concentration is clearly visible (image provided by Helge K¨uster). . . 28
3.6 Two types of MA scatterplot depicting the global lowess normalized log-ratios of a single two-color microarray. This is a self-self hy-bridization experiment using the same RNA for both channels (data provided by Andrea H¨user), which should not exhibit differential ex-pression. All variation in the images is a result of technical variation. The red line at the center is a lowess scatterplot smoothing line, the dashed line pairs denote the regions that contain 50% (inner pair), 95% (middle), and 99% (outer pair) of all data. Technical varia-tion can be minimal in a well conducted setting, as 99% of the data is contained within M ∈ [−0.61,0.39]. Plot (a) is a standard plot showing a black dot for each individual measurement, type (b) is a density scatterplot, depicting each region by a color proportional to the density of spots in the region. Regions of higher density are denoted by darker shades of blue. . . 29 3.7 Systematic but non-linear bias(a)in an MA-scatterplot and its
cor-rection by using lowess-normalization (b). The bias in (a) is made visible by the blue central lowess curve. . . 31 4.1 Overview of the three base classes of the MAGE-OM hierarchy and
all packages. All other classes are derived from one of Extendable,
Describable or Identifiable. The folder icons denote the 15
pack-ages into which all classes except the base classes are divided. Dia-gram taken from http://www.ebi.ac.uk/arrayexpress/Schema/-MAGE/MAGE.htm . . . 55 4.2 Screenshot of the MGED ontology web pages. On the left, the page
shows a list of all available classes in the ontology. In the main frame, detailed information of a class (in this case ExperimentDesignType which is referenced in the corresponding MAGE-OM entry to anno-tate an Experiment) is displayed. The class hierarchy is depicted as a tree list. The subclasses which contain further sub-classes of the ExperimentDesignType class are depicted at the bottom under the caption ’Usage’. . . 59 4.3 Screenshot of an ArrayExpress query for all experiments using
Med-icago truncatula and the query result. The list consists of seven
supplementary datasets belonging to experiments carried out at the Lehrstuhl Genetik, Bielefeld University. . . 64 4.4 Screenshots of the query interface of the SMD database (top) and
the resulting list of experiments for the category stress (bottom). . . 67 5.1 Use-case for the annotation and data acquisition process of the LIMS
List of Figures xiii
5.2 Another more complex use-case for the management of experiments and data. Several steps in the life-cycle of an experiment depend on each other. For example, the curation of and experiment by an ad-ministrator depends on the preceding finalization of the experiment (depicted by dashed arrows). . . 80 6.1 Proposed multi-tier architecture for the specified system. RDBS
denotes the relational database backend; it is presented to the mid-dle tier by its object-oriented API. The midmid-dle tier is split into the application layer which provides core functionality and the commu-nication layer, which is used for interchanging data with other ap-plications. The topmost tier consist of the facade and a collection of presentation modules. Client 1 . . . Client n denote different types of clients (e.g. web-interface, command-line-interfaces etc.). . . 90 6.2 Simplified UML-model of the database classes representing the
ac-cess control system. The user and group ACL classes represent the access control lists for users and groups of users and are both derived from the ACL superclass. The ACL class can control access to any object within the MAGE-OM. . . 93 6.3 Simplified UML diagram of the supplementary persistence classes of
the analysis model. The diagram depicts the core classes Job, Tool, and Function together with derived classes. The observation class is introduced to store all resulting data that do not fit in MAGE-OM. The diagram is simplified for clarity and readability: only the most important subclasses are depicted, and not all associations are named and show their cardinalities. . . 96 7.1 The component model of EMMA2. An UML component graph
pro-vides an overview of functional subsystems and their communication by using defined interfaces. . . 100 7.2 Overview on the code generation process of the EMMA2-API. . . . 103 7.3 Structure of the implementation of the web-interface of EMMA2.
The implementation consists of a single multiplexer script, presenta-tion modules (Experiment.pm, Array.pm) which use adaptor mod-ules (ExperimentDB.pm, ArrayDB.pm) to access the EMMA2 API. 105 7.4 Annotated screenshot of the EMMA2 web-interface. . . 106 7.5 Screenshot of the ArrayLIMS web-interface. The ArrayLIMS
pro-vides a linear workflow of web-forms to enter information about each step of the experiment (top). The report page provides an overview of all arrays in the repository and their annotations (the colored por-tion is enlarged for readability). The arrays are represented by the columns of the table. . . 108
7.6 Access control in the EMMA2 web-interface. The individual ACLs of users are listed in the top box. The experiment has ACLs for two human users and is readable by the WebService user. In the group permissions box, a new group ACL for the group ’MTUB’ is about to be assigned. A user can set all options for each object and dependent objects included in this experiment (bottom box). . . 110 7.7 Screenshot of the OntoDB ontology browser. It displays all
sub-classes of ExperimentDesignType which is used to annotate the type of experiment performed. A sub-tree is opened and the description for an item is displayed. Multiple entries can be marked to add the values into the corresponding fields in EMMA2. . . 111 7.8 Example for data-integration using BRIDGE. The gene-expression
data in EMMA is projected on a KEGG-pathway map. The expres-sion values for a time-course experiment are depicted as bars next to their enzymes. The task to create this graphic is to retrieve to which pathway a given BioSequence object in EMMA belongs. The BioSe-quence is linked to a CodingSeBioSe-quence (CDS) in GenDB, with each coding sequence having an Annotation. The Annotation can, if that information is provided, contain information about the pathways in which the EC-number of a gene occurs. . . 113 7.9 Configuration interface to use EMMA2 as a web-service client. The
configuration wizard allows to connect to a remote service providing a WSDL-service description. In this case, the CoryneRegNet Service is contacted, which is a database of regulatory networks (Baumbach
et al., 2006). All functions the service provides are listed and function call parameters can be assigned to MAGE-OM information and to BRIDGE features. . . 117 7.10 The ‘Pipeline Creator’ wizard. In the left column, all analysis
meth-ods, enabled in this project are depicted as blocks. The blocks at the top depict computational functions; dark blocks at the bottom depict writer and importer functions. On the right, the sequential analysis pipeline is depicted consisting of a list consecutive functions. In this case, the pipeline consist of normalization, filtering and clus-tering, a writer function to store the results in the database, and an email notify function. In the central window, the paramters of the normalization function are beeing adjusted. . . 119 7.11 Automated data-analysis wizard. The first step allows to choose
an analysis method (a). The datasets that fit with the type of the pipeline are automatically selected. Buttons on the right allow to set further configuration options (b). The method can directly be
started by clicking the ‘Compute’ button(c). The list of all jobs for an experiment, their results and messages are recorded in the job-list
List of Figures xv
7.12 Overview on the components necessary to add an new analysis func-tion to EMMA. For most funcfunc-tions, only the funcfunc-tion code itself and a Tools-ML document are required. . . 121 7.13 The ‘KEGG chamber orchestra’. This plot is an example of the
violin plots, generated by EMMA2, using the R function advanced vioplot. For each of the 91 KEGG-pathways (only the second half is depicted) found inS. meliloti in the example experiment, the data are projected on the first principle component and the density of the sample distribution is plotted in combination with a box plot. The width of the boxes of the boxplot depends on the number of mem-bers within the pathway. The bivariate nature of the distribution of the expression profiles in the group ‘Oxidative Phosphoralation’ is directly visible, while the median, spread, group size, and outliers are depicted by the boxplot. . . 128 7.14 Two screenshots of the EMMA2 cluster viewer. The cluster viewer
is a Java that allows easy and detailed navigation of the hierarchical clustering trees (top). The tree can be cut into at an individual hight, yielding individual clusters that can be further analyzed in the cluster panel (bottom). The ordered expression matrix is depicted as a heatmap with adjustable color coding (for example to provide a blue-yellow contrast instead of a standard red-green contrast.) The cluster panel can also be used for non hierarchical methods and provides multiple cluster plots, like bar-plots (bottom center), web-graphs (not-shown), line-graphs(left), and boxplots(at the bottom of the window). . . 129 8.1 Density scatterplot of the raw and background subtracted intensities
of one of the multireplicate microarrays. The plot exposed the tri-partide nature of the data distribution, which is due to the fact that the array represents over-expressed (upper partition), repressed (lower partition) and unchanged genes (smaller central partition). The yellow line represents the main diagonal. . . 143 8.2 A ‘topographic’-density scatterplot of the channel raw intensities of
the yellow experiment microarrays altogether. This plot is a den-sity scatterplot using colors similar to a topographic map. Dark blue shades (the ‘deep-sea level’) denote data density close to zero, brighter shades to white denote high density. Most of the data-points clutter around channel intensities of 1000. Variation is very low as Pearson correlation coefficient of channel intensities is greater than 0.97. . . 143 8.3 False color image of both channels of a multireplicate array stored
8.4 Rank comparison plot of all methods included in the generation of the SoT dataset for the DMR data. Each point depicts the rank of a p-value for gene computed by the test method. It is clearly visible, that the methods t-test, Limma, Wilcoxon, and CyberT produce rather similar rankings. Some methods like Wilcoxon and CyberT produce a large number of equal p-values, visible as straight lines. SAM, VarMixt and RankProd conform much less with the other test procedures. . . 147 8.5 Correlation plot as a comparison of the rank concordance between
methods in the DMR datasets. White depicts high correlation (≈1) and darker shades depict lower rank correlation. Very high correla-tion can be observed between all t-statistic methods (t-test, CyberT, Limma, partially SAM) and also Wilcoxon’s test. Self-consistency for VarMixt has been tested by repeating it ten times. The cor-relation between individual runs is not much better than between VarMixt and the t-test. . . 148 8.6 Correlation plot to compare rank concordance of all methods on
the JMR dataset, consisting of 87 genes with a maximum of 400 replicates. . . 149 8.7 Barplots of an estimated empirical type I error rate(four replicates).
The proportion of genes with p-values below 0.05 (upper) and 0.01 (lower) is depicted as a bar for each method. 10 repetitions of the VarMixt method and three additional passes with different settings for the number of variance classes are depicted in yellow. With respect to the type I error, t-test and SAM perform preferable, while sample size is too small for Wilcoxon’s test. . . 151 8.8 Plot of the empirical rank-concordance on the DMR and JMR
datasets over the number of replicates. The t-test like methods exhibit a similar behavior of converging to 1. It is clearly visible, that on small sample sizes most methods perform better than the t-test, whereas for large sample sizes all t-test like methods perform comparable. . . 153 8.9 Boxplot of the data projected on first principle component for each
KEGG-pathway. . . 158 8.10 The Datamining Wizard of EMMA2. It allows to search for
expres-sion data by a boolean full-text search. The search can be restricted to experiments and conditions. Below the search mask a table con-taining the results of the search is depicted. . . 164 9.1 The CeBiTec ’Omics software family based on BRIDGE. Unified
ac-cess to all software is provided by the BRF portal; user management is provided by GPMS. . . 172
List of Tables
8.1 Overview of national and international projects which use EMMA2 as their central transcriptomics platform (figures as of January 2007). 134 8.2 Overview of the two mutations of Corynebacterium glutamicum
ATCC 13032 strain used in this study. The exact names of the con-structs areCg∆SsuR ∆McbRPneo CysR (304) andCg∆ SsuR∆
CysRPneo McbR (306). – denotes a gene deletion of the HTH motif,
to prevent binding to the DNA and thus loss of regulatory function of the transcription factor. ++ denotes a mutant having its native promoter sequence replaced by a strong constitutive promoter. . . . 141 8.3 Statistical figures (rounded) on the raw data of the validation
datasets. MR denotes the six multi-replicate arrays. Yellow rep-resents a self-self hybridization experiment using four Cg3kOligo mi-croarrays containing all 3000 coding sequences. . . 145 8.4 Expression profiling tools generated in the MolMyk, MEDICAGO,
laboriously and imperfectly, and then, when these were finished, wrought other things more difficult with less labour and greater perfection; and so gradually mounted from the simplest operations to the making of tools. . . , to the making of more complex tools. . . , till they arrived at making with small expenditure of labour, the vast number of complicated mechanisms which they now possess.
So, in like manner, the intellect, by its native strength, makes for itself intellectual instruments, whereby it ac-quires strength for performing other intellectual oper-ations, and from these operations gets again fresh instru-ments, or the power of pushing its investigations further, and thus gradually proceeds till it reaches the summit of wisdom.
Benedict de Spinoza (1632–1677), De intellectus emendatione. (On the Improvement of the Understanding, cited from the Unabridged El-wes Translation, Dover Publications, New York)
CHAPTER
1
Motivation and Overview
The introduction of microarray technology has marked a paradigm shift in ge-nomics. Thus far, research was mainly focused on single or small sets of genes of interest. These genes were analyzed closely to reveal their function. For the first time, the introduction of microarrays provides a holistic view on the expression of the whole genome of an organism. While whole genome expression analyses offers fascinating new insights into the molecular machinery of the cell, there are also new challenges for data handling and analysis: The massive amount of data whole genome studies create.
In spite of the fact that there were already lots of well established methods for multivariate analysis, management and data-mining of large data sets, it took some time to adapt them to this new area of research. The adoption of known methods and the invention of new specialized methods proceeds concurrently with the intro-duction of microarray technology. The research community has experienced a vast trend of growth in the application of high-throughput methods, and in particular microarrays, over the last decade. Microarray studies have given rise to interest-ing publications and successive research projects. Despite their apparent success, microarrays suffer from influences of variation. This is of course true for any mea-surement technology, especially in biology, where the variation of the subject of measurement can be high. Nevertheless, the technology needs to be constantly improved.
The number of methods for microarray analysis is increasing, as well. Some of the authors of new methods claim to have them designed with a focus on noisy microarray data. There is still no clear guidance on the merits of all the new methods. Thus, comparative studies of methods are required but there are only very few independent evaluations.
if they are well planned and conducted. Cost efficiency is a major goal in many studies, and this means to study a maximum of interesting variables with a min-imum of experiments and repetitions. These goals seem contradictory, but with good preparation, planning, and thorough knowledge of applicable methods, they are achievable. As the resulting data are costly, we need good tools to record the complete experimental process and also the analysis methods applied. This is so im-portant because the results cannot be evaluated without knowing the experimental conditions under which they were obtained. There are now some evolving standards about which information to record and which formats to use for data-interchange. Regarding the recent advances in the technology, its opportunities, the possible pit-falls, and the number of methods for data analysis, a system is needed to help the users to reliably store and process their data.
Standardization is required for storage and the most important process of data analysis. We need a certain level of guidance on the applicable methods, in partic-ular for users without deep knowledge in statistics. This includes to evaluate the flood of new methods developed and to give recommendations on which method to use. It is truly a broad vision, hardly feasible to accomplish in an isolated environ-ment, without close cooperation between the computer-science side and the users, the experimenters.
The Center for Biotechnology (CeBiTec) was established at Bielefeld University in 1998 as an interdisciplinary institution. Intended as a joint effort to couple research groups, it serves as a platform for cooperation and knowledge transfer between biology, computer-science, chemistry and physics. The relevance of com-putational methods and infrastructure was recognized early on within the CeBiTec. It was therefore equiped with a large service unit of computer-scientists providing central computer hardware, software, and support. This unit was termed Bioinfor-matics Resource Facility (BRF).
Within this environment, a computational infrastructure could be developed to utilize microarray technology. A novel standards-compliant system, baptized EMMA2, was developed. For the development process of EMMA2, close cooper-ation between users and developers was found to be very beneficial. With having all the data from a large microarray core-facility at hands, and especially with the input of a large community of users from all over the world, EMMA2 has undergone an evolutionary development process.
All steps in the workflow of an experiment are now standardized, ranging from acquisition of experimental protocols and annotations to handling of raw and trans-formed data. Further progress towards standardization of the whole analysis steps and evaluation of methods, for example normalization and statistical tests, have been made. The availability of the EMMA2 system, has contributed to many fields of reasearch.
Anyway, the system would not be complete, without a close integration of other data-sources such as genome annotations, metabolic pathways and proteome mea-surements. To provide a system to the international research community, which would allow for terse integration of these sources was another aim of this project. For integration, naive hyperlinking every gene to a data-base was simply not
3 enough. Instead, a complete bi-directional implementation to include all sorts of external annotations into computational methods was imagined.
In the following Chapters, design, development, implementation, and application of EMMA2 is described. Chapter 2 begins with a brief overview on the biological foundation of gene-expression and regulation. Furthermore, the vast new field of functional genomics is introduced.
Chapter 3 introduces the reader to the fundamentals of microarray technology. Also, there is a focus on possible problems and pit-falls one might encounter while working with microarrays; some methods to overcome these influences, including normalization and statistical inference will be presented that allow to make sense out of noisy data.
Chapter 4 is dedicated to all of the most progressive methods of standardization and software systems in the field of microarrays. Standardization is introduced as a complex process that involves defining the content of communication, machine-readable formats and vocabularies, and finally, pieces of software implementing them.
Modern software development can be described as an evolutionary cycle; as the first step it is necessary to obtain a sound impression of what the software should do and how it should look like. There are many aspects to requirement analysis. They come from very different motivations, not to forget the challenge of the author to deliver a refined piece of software with previously unseen features. Requirements may pile up and so they have to be collected, ranked and condensed into a half-formal specification described in Chapter 5.
Chapter 6 deals with the more formal aspects of designing a system. It is almost infeasible to build a complex application as a monolithic piece of source-code. One should rather use a modular approach and decompose the whole system into smaller reusable and manageable portions communicating with each other via well defined interfaces.
Now, it is time to fill the components with source code and finally bring to life the working application. Chapter 7 describes in detail the implementation of EMMA2, which other software and programming languages were applied, and how their employment results in an extensible database system with a highly versatile interface.
After having built a system, it is most important to test the applicability of EMMA2 in real-world projects. There are currently many projects which apply EMMA2. Some are internal evaluation projects, dealing with assessment of new methods of statistics and visualization. By far the largest range of projects is dedicated to microarray research in a diverse range of organisms and environments. How much EMMA2 can contribute to academic research can be figured out by reading Chapter 8 on “Results and Applications”. Finally, a discussion of the system, its implementation, and new insights gained is given in Chapter 9. An outlook on the perspectives of EMMA2 in microarray research and its integration with other systems at the CeBiTec concludes the work.
CHAPTER
2
Introduction
At which point in the development of a method, technology or tool, is it justified to call it a well-established one? Is it the point in time where it is so popular that everyone in the field knows the method exists and attributes high expectation to it? In biotechnology, this could be the case when major (non-scientific) media report on the method as a candidate to help to find the ultimate cure for cancer. Or is it at a later stage, when the initial sensational promotion is replaced by a more down-to-earth view on the capabilities and deficiencies of the tool? Hopefully and finally, a tool or method can reach a state where it is so ubiquitous that its presence is hardly taken notice of – except in the case of failure or malfunction.
For microarrays, we have, almost certainly, overcome the state of euphoria, reach-ing a turnreach-ing point at which we gain a better perspective on the benefits this tool has to offer as well as the problems it poses for the researcher. Since their in-troduction, in a first study in 1995, they have played a key role in the functional analysis of genomes. Although, there have been other techniques to measure gene expression in cells, such as Northern blots and targeted macroarrays, microarrays allowed the measurement of RNA abundance for thousands of genes in parallel for the first time.
Many expectations have been raised by this new ability, especially for biomedical research. Although, some of the most high-flying hopes have not been fulfilled up to now, microarrays provide an excellent measurement technology for gene-expression analysis. This is especially the case when used in combination with other laboratory techniques.
Cost efficiency is one of the major arguments for the introduction of microarrays. Its relevance can also be deduced from the large and growing amount of microarray experiments submitted to public repositories. As of July 2006 the public
microar-ray repository Armicroar-rayExpress located at the European Bioinformatics Institute con-tained more than 1500 experiments consisting of a total of over 45000 microarrays. As of December 2006 these figures have increased to more than 1700 experiments and 52000 arrays.
The biological object of study – from the genes of an organism to the development of cell and their observable phenotype – and the primary process which microarrays target is a complex one. ‘Regulation’ is used as a short term to summarize the constant adaptation of an organism to its environment. Many entry points for regulation have evolved during evolution of life. Improved regulation allows an organism to better adapt to changes in its environment providing an advantage over other competitors. Regulation of gene expression is an important mechanism among other mechanisms of adaptation such as metabolic regulation, motility or intercellular signalling, and only the first step of gene regulation are covered by microarray analyses.
2.1 Information Flow and Regulation in the Cell
The central dogma of molecular biology describes protein expression as a directed flow of information: from DNA over intermediate messenger RNA (mRNA) towards the end product, a protein. The nucleotide sequence of DNA encodes the amino acids sequence of final proteins. DNA carries the inheritable traits of an organ-ism. The resulting proteins perform primary roles in the metabolism and serve as structural elements of all organisms. Figure 2.1 on the facing page summarizes the central dogma and the molecular machinery involved (Lewin, 2004).
Not all genes are equally expressed under any given condition. The biological process of gene expression is a multi-step process including several stages of reg-ulation. The molecular mechanisms of gene expression and its regulation vary in essential details between the domains of life: eukarya, bacteria, and archea (and also for plastid genomes of eukaryotes and for viruses). These differences affect the molecular equipment of the cell and further processing steps at the mRNA level as eukaryote cells have a far more complex structure than a bacterial or archeal cell and the mRNA has to be transported between cell compartments. On the opposite, in bacteria, there is fewer room for modifications of the mRNA, as the translation into protein is performed directly on the transcribed mRNA strand in proximity to the replicon. Despite this, the central dogma of molecular biology is common to all domains of life.
At the first stage, regulation can occur on DNA-level, for example by methylation of nucleotides of the DNA strand. The most well-studied regulatory mechanisms exist on the transcription level, the synthesis of a complementary strand of mRNA from the chromosomal DNA. This process is carried out by the enzyme RNA poly-merase (RNApol).
The process of transcription is divided into three phases: During the initiation
2.1. Information Flow and Regulation in the Cell 7
Figure 2.1: A computer scientist’s view on the regulation of protein biosynthesis. In the top row, the key molecules involved in gene expression are depicted (molecule images are taken from the Protein Data Bank (http://www.pdb.org), entries 1bna: Drewet al.(1981), 1i6h: Gnattet al.(2001), 1ffk: Banet al.(2000), 1ytb: Kimet al.
(1993)).
the promoter, and forms the closed complex. The double-stranded DNA is opened. After the open complex is formed, the RNA polymerase starts transcription of the template strand at the transcription start site. Transcription occurs in a small open region (of ≈12 basepairs), the transcription bubble. In the consecutive elongation
phase, the RNA polymerase moves forward on the DNA strand and opens it while
elongating the RNA strand. The produced RNA sequence is complementary to the template strand. After passing of the RNA polymerase, the transcription bubble is closed again and the DNA forms a duble-strand. The termination phase is entered when the RNA polymerase encounters a termination signal. It detaches from the DNA and the RNA transcript is released.
Global transcriptional programs can be activated by alterations of RNA poly-merase, which is a complex molecule consiting of multiple subunits. In bacte-ria, the core enzyme consists of five sub-units and has unspecific affinity to DNA. Another co-factor is required for the RNA polymerase to specifically detect pro-moter sequences, the σ-subunit (also calledσ factor). The core enzyme andσ form the holo-enzyme, which has a specific affinity to the bacterial promoter sequences. There are multiple σ-factors in the genome of bacteria that detect different pro-moter sequences. Global transcriptional programs can be observed by exchanging
σ-factors in reaction of bacteria to global changes in their environment, for example an increase of temperature.
In eukaryotes and archea RNApol consists of ≥10 subunits and cannot initiate transcription directly. Transcription factors are required to place the RNA poly-merase in the exact position and assist the formation of the open complex.
Tran-scription factors are by definition those molecules that are not part of RNApol but are required for the initiation of transcription. In eukaryotes and archea, the tran-scription factors bind specific AT-rich consensus sequences and often form larger complexes of transcription factors and co-factors. An essential molecule is the TATA binding protein (TBP, a drawing is shown in Figure 2.1 on the previous page). It is a sub-unit of the transcription factor TFIID which recruits other factor necessary to initiate transcription. In addition, eukaryotes (but neither bacteria or archea) possess three specialized RNA-polymerases: (RNApol I for ribosomal RNA, RNApol II for protein coding mRNA, and RNApol III for other RNA genes).
Binding efficiency and transcription is further modulated by regulatory proteins and their binding to the DNA-strand. They are also called trans-acting regulatory elements, because the genomic sequence coding for them is often far away from the target of regulation. The binding site of regulatory genes is called cis-acting site and is often in the vicinity of the promoter. In bacteria, there exist regulatory sites of positive and negative control.
Regulatory proteins of positive control enable the RNA-polymerase to bind the DNA-strand more efficiently, while regulatory proteins of negative control inhibit transcription. Activators are examples trans-acting elements of positive control in bacteria. Repressors have the opposite regulatory effect. The actual regulatory influence depends on the combination of trans and cis elements. There can be combinations of proteins and binding sites that reverse the regulatory effect.
The activity of regulatory proteins is often further modulated by other molecules, so called effectors. In one of the most well studied examples for regulation of bacterial gene expression, the Lac-operon1 in Escherichia coli, the presence of the
molecule allolactose, an isoform of the sugar lactose, modifies the repressor of this operon. While the repressor binds to the operator sequence in the absence of allolactose (and thereby lactose) inhibiting the expression of genes of the lactose metabolism, in presence of allolactose the repressor changes its conformation and detaches from the operator, hence allowing the transcription of the genes in the operon.
In eukarya and archea, there exist enhancers as additional cis-regulatory ele-ments. They can sometimes be relatively distant from the promoter sequence, but still influence the rate of transcription by enabling trans-acting factors to bind to them.
In prokaryotes, the nascent mRNA is translated by ribosomes which directly attach to it before transcription is complete. In eukaryotes, the pre-mRNA is further processed. A capping is added to the 5’-end of the pre-mRNA; after the transcript is released, a poly-A tail is added to the 3’-end. Furthermore, non-coding sections (introns) are removed from the transcript in a process of splicing. The mature mRNA is afterwards transported to the cytoplasm through a pore of the nucleus. As a result of the processing, eukaryotic mRNA has a much longer
1
An operon is a transcription unit in prokaryotes which consists of possibly many genes which are transcribed into a singlepolycistronic mRNA.
2.1. Information Flow and Regulation in the Cell 9
half-life than prokaryotic mRNA.
Variable decay-rates of different mRNA transcripts can also be encountered and seem to play a role in regulation. Other regulatory elements have been discovered, some of which are themselves RNA namely micro RNA (miRNA). These molecules function in combination with protein complexes, modify the mRNA, or interfere with the initiation or termination of the translation process. This can lead to complete inhibition of the translation of transcripts. This mechanism is also known as RNA interference (RNAi).
Control of the translation process can be seen as a further means for the cell to regulate its gene expression profile. In addition, post-translational modification of proteins includes changes in the conformation of the 3-dimensional structure of proteins. The process of protein-folding, namely the process of the formation of a 3-dimensional structure, is even more complex and only partially understood.
Despite these problems, knowledge about protein structure is important for the study of transcriptional regulation to automatically detect trans-acting elements. Regulatory proteins often exhibit specific amino-acid sequences, so called DNA binding domains. These domains are of particular interest to predict candidates for regulatory proteins and can be predicted using computer programs to search against databases of protein domains (for example PFAM (Sonnhammer et al., 1998) using the hmmer tools). The TRANSFAC database contains a large number of transcription factors, regulated genes and corresponding binding sites for eukaryotes (Matys et al., 2006).
The problem of predicting binding sites from the databases and the matching of DNA sequence and its protein domain counterpart, would be an interesting next step. It remains unsolved by direct inference from the sequence or with search patterns or weight matrices for binding sites (Rahmannet al., 2003).
Signals, which influence transcription and translation, are emitted by an only fragmentally understood cellular signalling network. Resulting from these insights, information flow is not simply linear from DNA to protein, but is seen as a complex network of regulatory processes between DNA, RNA, proteins, metabolites, and en-vironmental conditions. It appears that RNA, and thus its measurement, plays a key role in this regulatory network, apart from the RNA being reduced to an inter-mediate product of protein-expression. In fact, RNA is the only bio-molecule, that has the ability to encompass many roles. RNA can serve as a means of inheritance, a regulatory molecule, and also have an enzymatic activity.
Many bioinformatics methods have been developed to predict the secondary structure of RNA, that is formed by self-hybridization of a single strand. It is believed that these secondary structures play an important role in regulation of expression as well.
In summary, from the role that is attributed to RNA in modern functional ge-nomics, it appears that we are experiencing the formation of an ‘RNA world’2,
2
This term is otherwise used for the hypothesis stating that RNA was the first stable bio-polymer in the origin of evolution of life.
where the measurement of the transcriptional state of an organism is one of the most prominent techniques in biological research.
2.2 The New ’Omics Approaches
It is often said that biological science has reached the ‘post-genomics era’. The acquisition of the complete genomic sequence of an organism has become an almost routine task by the development of ever faster DNA-sequencing techniques. In fact, DNA-sequencing landmarks the introduction of the first so called high-throughput method into modern genomics.
Other ground-breaking technological advances are the introduction of de-novo
protein-sequencing, metabolic analysis, sequencing of ESTs and last but not least several tools, made to study transcription such as Serial Analysis of Gene Ex-pression (SAGE Velculescu et al., 1995) or microarrays. Other high-throughput methods were developed which allow the creation of genome-wide deletion mutants for microorganisms.
The availability of the first complete genomic sequences has created the need to determine which part of the sequence represents genes in the sense of classical genetics and thereafter to determine the function of these genes.
All newly developed technologies yield high-volume data, which has led to an increased necessity for application of computers and algorithms formerly unseen in biology. The emerging field of bioinformatics arose simultaneously with the new functional genomics methods and soon gained an irrevocable stance within genomics.
Algorithms and computational infrastructure have been developed to analyze and store large genomic datasets. A good example is the BLAST heuristic for sequence alignment, presumably up to now the most widely used bioinformatics method. The development of BLAST was fostered by the need to analyze the large amount of newly obtained genomic sequences more efficiently.
The term ‘functional genomics’, despite its vague use in literature, is often used to describe the effort of going beyond the mere genetics and DNA-sequence acqui-sition, to make use of all kinds of different sources of data, and to use them in combination with classical and newly developed laboratory techniques. Combining many applicable laboratory techniques and data processing methods, it seems feasi-ble to describe the functional elements of the cell on all stages from geneexpression, over metabolic pathways to cellular signalling.
Another example are microarrays which allow the parallel measurement of ten-thousand of transcripts of an organism. Microarray analysis results in large nu-merical datasets, which are completely different from the string-type data DNA-sequencing produces. Bioinformatics algorithms are required to handle such large datasets, while dealing with the high level of uncertainty exhibited by the new type of measurement .
2.3. Analysis of Transcriptional Regulation – Goals and Visions 11
number of novel insights into the molecular machinery of life. As a consequence, there is also increasing commercial potential for the new techniques. For medical reasearch, many of the functional genomics methods are regarded to hold a high potential. The new sector of life-science companies has fostered the development of out-of-the-box methods for large scale screening and data analysis.
Functional genomics methods could be able to shed new light on questions of genetics, for example the essential definition of what is a gene. It is amazing that, though the term is of such primary importance, no uniformly accepted definition could be found. In fact, the question of “what is a gene” is very closely related to the origin of the intermediate product, mRNA, which can measured by microarrays.
2.3 Analysis of Transcriptional Regulation – Goals
and Visions
The upcoming high-throughput methods to study the transcriptome (a term which, parallel to the term genome, denotes the entirety of transcripts of an organism) have raised high expectations, similar to the expectations that were raised by the human genome project. Most hopes are directed towards medical applications of microarrays, for example studying cancer and other diseases to improve therapeutic treatment.
One of the simplest questions which can be answered by any method for studying transcription is, whether a set of genes is expressed under the conditions studied. Some methods such as quantitative RT-PCR (Wong and Medrano, 2005) allow to assess the actual number of transcripts on a quantitative level, while others, for example EST-sequencing, allow to determine the exact sequence of the transcripts
de-novo.
Another approach, which is followed by a vast number of researchers, is to de-termine gene-function by patterns of common regulation between genes. Often, genes which function in a similar metabolic pathway or share another common function, show similar patterns of gene-expression in transcription profiling exper-iments. This approach has been termed ‘guilt-by-association’ in an editorial by Quackenbush (2003).
Inference of function based on ‘guilt-by-association’ has often been criticized for its vagueness of definition and lack of stringency. If ‘guilt-by-association’ is over-interpreted, one could get the impression that the function of the genes is encoded in their expression profile, which is dubious at best. Despite possible misconceptions, the approach provides a useful source of new hypotheses about co-regulated genes. Especially, when the expression of conserved genes can be compared over multiple species, for instance in the study of Stuart et al. (2003).
The molecular machinery of the regulation of gene expression is controlled by a multitude of cellular players, for example effectors and transcription factors. It is often described in terms of a complex network structure. Measurement of
tran-scription under different conditions using mutants created by functional genomics laboratory methods can help to elucidate the structure of these regulatory networks and to identify the role of the involved molecules.
By elucidating the underlying mechanism of transcriptional networks, researchers hope to gain more effective therapies for diseases, to optimize food production, or to better understand pathogenic and non-pathogenic microorganisms. Far reaching applications of the array technology are prospected for the future. Schena (2003) prospects a wide range of clinical applications mainly related to civilisatory related health care issues, from the measurement of physical fitness, over predisposition for alcohol or drug abuse, to diagnostic tools for depression and schizophrenia. These are quite reasonable fields of application, but it does not seem too daring to presume that there is still a long way to go for the technology to become a standard tool of clinical diagnosis.
2.4 The Role of Free Open Source Software in
’Omics Research
The introduction of high-throughput techniques into biology has marked the be-ginning of the new disciplines of structural and functional genomics. Genome-wide analyses produce such large amounts of data that the use of computers and spe-cialized software for storage and further analysis of the ‘data flood’ is mandatory. The more data sets exist, the larger the need for specialized applications for search-ing and comparsearch-ing them. The task to find regularities and structure is known as data-mining.
Due to the sheer volume of the resulting data the experimenting biologists re-quire strong support with respect to bioinformatics and also knowledge about the applicable algorithms and statistical methods of inference. This need has recently been pointed out by Miron and Nadon (2006); they have used the term ‘inferential literacy’ for this ability.
The algorithms and database systems needed to store, retrieve, and comprehen-sively analyze genome-wide datasets have to be provided in the form of software. This can be either proprietary commercial software or free open-source software. It is often hard to discriminate these forms of software exactly. In general, proprietary software applications require payment to acquire a, sometimes temporary, license to use the product, while free open-source software (FOSS) is provided, often by a large community of contributors, with an open license and with full access to the source code.
As many of the proprietary applications are tailored for the field of life-science, where possibly high revenues are to be expected from pharmaceutical or agricul-tural research, these software products are often priced as other business related software systems. The pricing and licensing policy often renders these applications unaffordable for academic institutions. On the other hand, concerns about a lack
2.4. Open Source Software in ’Omics Research 13
of quality, reliability, and economic advantages have often been raised as a counter-argument against FOSS, in particular by vendors of proprietary systems. But Wong and Sayo (2004) and a large EU study on open source software, published recently,3
demonstrate that FOSS is generally a powerful concept with a relevant economic impact.
An advantage of free open-source software is in particular the availability of the source code, which enables the user to inspect the source code and to become aware of the exact implementation of the algorithms used in a software package. Knowledge of the exact algorithm is a key feature for academic research and the publication of results based thereon.
The availability of the source code makes it possible to fix software errors or add new functionality. While this might not be applicable to the individual lab-researcher, the availability of the source code can create a large community of con-tributors, which share new or optimized source code. That way, software projects of no direct commercial interest or merchantability can be realized; as for exam-ple, public data repositories for gene-expression data are implemented as free open source solutions. Often, such free open-source projects are also supported by large companies.
3
CHAPTER
3
Analysis of Gene-Expression – A Brief
Introduction
Microarray technology has undergone a fast evolution during the late 1990’s. Mi-croarrays allow the parallel measurement of transcriptional regulation of thousands of genes (Schena et al., 1995; Lipshutz et al., 1995). Therefore, microarrays are often called a high-throughput technique (Lipshutz et al., 1999; MacBeath and Schreiber, 2000; Miron and Nadon, 2006; K¨uster et al., 2006). Microarrays have marked a turning point in functional genomics due to their wide range of applica-tions and relative cost-efficiency. Since then, a variety of protocols for producing and applying microarrays in the life-sciences have been developed.
3.1 Microarray Technology
Despite all technological differences, the common principle of all microarray plat-forms is rather straight-forward. DNA molecules having defined nucleotide se-quences are attached to the surface of a solid support, mostly coated glass. They are named reporter molecules or simply reporters (originally they were termed
probes in the pioneering publication of Schena et al.) and share a small area of the surface. These regions are called features or spots and are arranged in a regular pattern. Current technology reaches a density of up to 10,000 features per cm2.
To measure messenger RNA, it is extracted and optionally converted into copy DNA (cDNA) by reverse transcription using reverse transcriptase, an enzyme dis-covered in RNA-viruses. The RNA or cDNA is labeled with a marker substance allowing for approximate quantification of the number of DNA copies. The solution
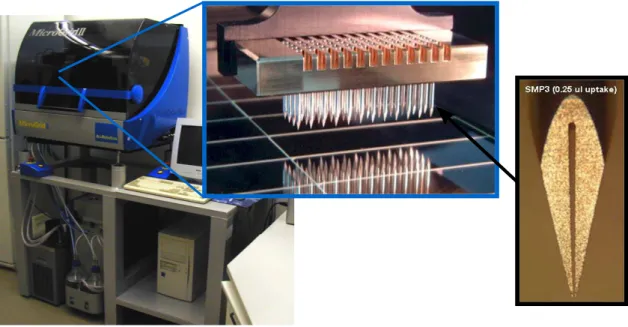
Figure 3.1: Robotic microarray spotter (Microgrid II) used at the CeBiTec (left), an enlarged view of the print head with 48 print-tips (center) and a print-tip (right).
of labeled molecules (also called targets) is then put on the surface of the microar-ray containing the reporters. In a process of parallel hybridization, the labeled single-stranded RNA or cDNA molecules (secondary structures of RNA and cDNA are resolved) hybridize with their single-stranded counterparts, representing the nucleotide sequence of the complementary strand on the surface of the microarray. The approximate number of bound target molecules in a given feature is measured by a detection device, often a scanner producing images.
Despite the large variety of techniques for microarray production, two main tech-nological platforms can be differentiated: spotted two-color microarrays andin-situ
synthesized microarrays (often referred to as ‘DNA-chips’).
3.1.1 Spotted Two-Color Microarrays
On spotted microarrays the reporter molecules are attached to a coated glass or plastic substrate (Schena et al., 1995). A robotic spotting device (also often called spotter or arrayer, see Figure 3.1) is used to deposit a small volume (typical: v <
1nl ) of a solution of defined DNA molecules onto the surface of the substrate. The approximate DNA concentration of the spotted solution is typically ≤ 20µM, whereas a typical feature has a diameter of 100µm≥d ≥50µm.
The molecules are attached to the surface by covalent binding to molecules of the surface coating. The reporter molecules can be either generated by polymerase chain reactions (PCR), a standard technique to produce many copies of DNA frag-ments using the enzyme DNA polymerase, or they can be synthesized oligonu-cleotides. Typical lengths of PCR fragments for spotted microarrays range from approximately 150 to 300 base pairs. Oligonucleotides for spotted microarrays are
3.1. Microarray Technology 17
normally produced with fixed lengths between 10 and 80 base pairs, depending on the field of application. Advantages of oligonucleotides over PCR fragments are cost efficiency and well-defined sequence features, for example the melting-point and the ability to control design features to reduce cross-hybridization with other genes of the organism. In contrast to oligonucleotides, which can be designed to bind to short and highly unique parts of a transcript with respect to genome, PCR frag-ments have an increased cross-hybridization probability due to their greater length. Also, PCR reactions may fail and yield no or reporter molecules with unexpected sequences for a small number of genes.
Novel reporters consisting of modified nucleotide molecules. Locked Nucleic Acids (LNA) or a mixture of DNA and synthetic molecules have been introduced by commercial vendors. These molecules are designed to hybridize cDNA like DNA reporters, but are build up from chemical compounds providing an increased sta-bility and binding affinity (Braasch and Corey, 2001; Liu et al., 2006). Synthetic oligomers have to be synthesized as they cannot be produced in PCR reactions with conventional DNA polymerase. As a consequence, synthetic modified oligomers can at present be produced only by commercial vendors. Despite their technical ad-vantages, a wide-range application of synthetic oligomers in academic institutions is impeded by the resulting high costs.
Each spotted microarray can be used to compare gene expression between two different labeled extracts. The labelled extracts can stem from different environ-mental conditions or be derived from a comparison of different time points in the developmental process of the cell. Spellman et al. (1998), for example, have com-pared the different time-points in the cell cycle of the budding yeastSaccharomyces
cerevisiae using spotted microarrays, Laub et al. (2000) compared several stages
during the cell-cycle of the bacterium Caulobacter crescentus. Other applications include the comparison of different cell lines, mutants, or various tissue types such as cancer cell lines (Ho and Lau, 2002; Ramaswamy and Golub, 2002). mRNA is extracted from the cell cultures to be compared, reverse transcribed into cDNA and labeled with two different marker substances (see Figure 3.2 on the next page). The marker substances are attached to modified nucleotides used to synthesize the cDNA. These marker substances are mostly fluorophores such as Cyanine fluors (e.g. Cy3 and Cy5) and Alexa fluors (e.g. Alexa647 and Alexa555). Fluorophores absorb and emit light in a small range of the electromagnetic spectrum. Novel marker substances include nano particles and so called quantum dots (Huber et al., 2004; Pedroso and Guillen, 2006).
The amount of marker substances bound within the feature area is evaluated using image scanners which produce a digital image. For fluorescent markers, a laser is used causing a fluorescent emission of light from the fluorophores. For two-color microarrays, these scanners produce two images, one for each emission wavelength. Currently, there are ongoing attempts to use more than two different dyes to increase the number of concurrent conditions that can be tested on one microarray. Many microarray scanners can be equipped with up to four detection channels.
Figure 3.2: Simplified overview of a two color microarray experiment.
Figure 3.3: Enlarged false-color image of a spotted oligonucleotide microarray. In the center of the image, two enlarged views of a single grid are depicted. The right one depicts circles representing the results of an image segmentation (image provided by Helge K¨uster).
3.1. Microarray Technology 19
3.1.2 In-Situ Synthesized Microarrays
A photolithographic process has been developed by Fodoret al.(1993) which allows to synthesize oligonucleotides directly on a solid substrate. A first application of a microarray produced with in-situ synthesized oligonucleotides was presented by Lipshutz et al. (1995). The process has been made commercially available by Affymetrix Inc. under the trade mark ‘GeneChip’ for a variety of model organisms includingHomo sapiens,Rattus norvegicus,Mus musculus,Caenorhabditis elegans,
Saccharomyces cerevisiae, Escherichia coli, Arabidopsis thaliana and Oryza sativa. The production of GeneChips is very different from spotted microarrays. While both share the use of glass as the solid substrate, the synthesis of oligonucleotides with typical lengths of 25 base pairs is performed in a light-directed process consist-ing of multiple repetitive steps. The substrate material of the chip is coated with covalent linker molecules, which a covered by photo-labile molecules. UV light is directed to specified locations on the array by a specific mask and the photo-labile molecules are removed. The linker molecules exposed to light emission are thereby activated. Nucleotides of the same type are then added and bind to the activated linker molecules. This step is repeated with another nucleotide and a further mask until all oligonucleotides have been synthesized with the desired sequences.
The production process requires the design of appropriate short oligonucleotide sequences to represent a gene or other target sequences and the respective masks to direct the synthesis.
NimbleGen Systems Inc. have developed the proprietary ‘Maskless Array Syn-thesis’ technology, as a light-directed synthesis that replaces the photolithographic masks by miniaturized mirrors which they call Digital Micromirror Device (DMD). This allows to produce customized microarrays which are also commercially sold by Affymetrix
Single short oligonucleotides might not always be very specific for a single gene and thus they are susceptible to cross-hybridization; a target sequence is repre-sented by a set of different short oligonucleotides on an Affymetrix array. In ad-dition to the oligonucleotides perfectly matching the target sequence (called PM probes), oligonucleotides with a missmatch base at the central position (called MM probes) are added. They allow to compare signal intensity derived from unspe-cific hybridization events, which are assumed to occur randomly, with the speunspe-cific hybridization signal of a perfectly paired sequence.
The labeling and hybridization process is similar to the processes for spotted microarrays, except that GeneChips are used as a single-channel platform. Hy-bridizations and the image read out can be performed by using proprietary equip-ment only.
3.1.3 Applications of Microarrays for Genomic DNA
Hybridizations
While microarrays have originally been developed to measure the abundance of mRNA, the microarrays contain mostly DNA nucleotides. It is therefore possible to hybridize DNA microarrays with genomic DNA instead of cDNA.
Applications of DNA hybridizations to microarrays include the detection of mu-tants or strains of an organism as well as the differentiation of species. The dif-ferentiation of microbial species is of special clinical interest. A recent example is given by Masson et al. (2006), who have employed spotted arrays printed on a plastic substrate to differentiate several species of Helicobacter andCampylobacter. Another interesting aspect of this approach is the use of a non-fluorescent detection system.
Detection methods for the DNA of pathogenic viruses in host cells is another application of the DNA hybridization method with clinical relevance. Long et al.
(2004) have developed a microarray design for genotyping several point-mutations in the SARS coronavirus. The authors note that this array can also be used for detection and genotyping of the virus. Other applications of DNA hybridizations include the exploration of genetic diversity in a population (see for example Kidgell and Winzeler, 2005).
Moreover, DNA microarrays have a particular potential in the evolving field of metagenomics (Sebat et al., 2003; Handelsman, 2004), aiming at the direct ap-plication of genomic analysis to environmental samples and environmental species communities (Gentryet al., 2006). Applications include whole-genome microarrays developed for detection and identification of bacterial species from environmental samples. Such microarrays contain the whole genomic DNA of one species per spot.
3.1.4 Tiling Arrays
Conventional expression analysis microarrays contain sequences representing mostly predicted protein coding sequences. These predictions are based on algorithms that use intrinsic features of the DNA sequence, such as nucleotide frequency, and extrinsic features, for example sequence similarity with known coding sequences of other organisms.
Predictions of coding sequences are not completely reliable, in particular for eukaryotic genomes. Locating the exact position of the transcription start site and intron-exon boundaries is a not fully solved task. Hence, it can be concluded that conventional gene expression microarray designs are biased towards the results of gene prediction methods, since other transcribed regions which have been regarded as intergenic might exist.
To be able to detect transcripts from the whole genomic sequence of an organism, tiling microarrays have been developed (Bertone et al., 2004). They cover a whole genome or parts of a genome using oligonucleotides of a fixed length having constant length gaps between them. Previously unknown transcripts, transcription start
3.2. A Sample Analysis Pipeline 21
sites and intron-exon boundaries can thereby be detected with a precision up to the length of a single oligonucleotide. Tiling microarrays are produced using in-situ synthesized oligos due to the higher density this technique allows.
Oligonucleotides for tiling arrays need to cover the complete genomic sequence; therefore they cannot be optimized with respect to low cross-hybridization and equal melting temperature. As a result a higher variation of signal intensity between oligonucleotides is likely to occur. This problem has to be dealt with in subsequent data analysis steps.
3.1.5 Protein Arrays
Microarray production technology, originally developed to deposit DNA reporters, has been further adopted to small peptides, proteins, and antibodies. Protein microarrays can be produced by either spotting purified solutions of molecules or alternatively by light-directed synthesis of short peptides on the surface.
Spotted antibody arrays are mainly used for the detection and quantification of proteins and protein abundance in a complex mixture. New approaches allow the deposition of full-length functional proteins. This type of arrays is used to study protein–protein, protein–DNA and protein–small molecule interactions (Bertone and M, 2005; Doi et al., 2002; Zhu et al., 2001). Protein microarray experiments currently use single dye techniques.
3.2 A Sample Analysis Pipeline
Although there can be many different ways in which to perform an actual microarray experiment, on a more abstract level, several steps of analysis are common to every such experiment. A fixed series of operations or experimental steps has to be followed, which is imposed by the technological requirements. Some steps are not specific to microarrays but to biological experiments in general.
A rough categorization is sometimes based on laboratory versus computer based analysis task; but it does not seem too helpful because it is an artificial separations by the location where the analysis steps are performed. It is better to devide experiments into three logical stages:
A planing and design phase during which the experimenter defines initial hy-pothesis, consults the literature, defines which effects to study, which variables or quantities to measure, and which instruments to use.
The experiment conduction wherein the object of study is eventually exposed to experimental conditions and quantities of interest are measured.
The analysis phase in the course of which measurement results are evaluated and interpreted to achieve results.