Master’s Programme in Human Computer Interaction and Design
Karishma Jain
Visualizing the data flow in virtual
re-ality for training developers
Master’s Thesis Espoo, April 8, 2019
Supervisors: Professor Marko Nieminen, Aalto University Advisor: Kaushik Eshwar Sriraman, Ericsson
Master’s Programme in Human Computer Interaction and Design
ABSTRACT OF MASTER’S THESIS Author: Karishma Jain
Title:
Visualizing the data flow in virtual reality for training developers
Date: April 8, 2019 Pages: 93
Major: Computer Science Code: SCI3042 Supervisors: Professor Marko Nieminen
Advisor: Kaushik Eshwar Sriraman, Ericsson
The visual aids are powerful tools in learning, understanding, and retaining data, especially in the industrial sector. However, visualizing data for complex systems is an essential challenge as they need to address a discrete and large amount of data. When novice programmers develop these complex systems, they typically require further training on the data flow in order to understand the hidden mean-ingful patterns. The visualization of invisible data in virtual reality (VR) helps to explore these patterns and direct new avenues to develop a system in the real world. Thus, the presentation of complex data in a 3D visual form is crucial and effective.
To accomplish this, this research study considers a case scenario of Indoor Air Quality (IAQ) system based on Internet of Things (IoT). By definition, IoT is a multifarious connection of devices and data over internet and thus, needs vi-sualization. A better understanding of how visualization in 3D space can assist programmers to learn IoT concepts. In turn, this poses profound questions in the areas of virtual reality and human-computer interaction. Consequently, the aim of this study was to visualize IoT sensor data in a virtual environment and produce guidelines for programmers in order to help them better comprehend the data flow. Subsequent to this, the level of immersion required for an effective VR experience was also investigated.
Overall, this study involved background research and an empirical study. The semi-structured interviews were conducted with the programmers and was han-dled as an empirical evidence. This evidence was further analyzed qualitatively. As a result, the static visuals of IoT sensor data values helped the users to un-derstand its flow. The visual clues both from abstract and skeuomorphic designs furthered the users understanding of the concepts. Accompanied by the text, nec-essary information about the concept was revealed to the end user. The analysis clearly highlights that visualizing in virtual reality enhances the experience by improving user awareness and user engagement level. In addition, this provides a more intuitive understanding of data flow and better recall of the observed relationships.
Keywords: Internet of Things, visualization, virtual reality Language: English
Firstly, I would like to thank my supervisor Professor Marko Nieminen for sharing his valuable advice and guidance throughout the process. All my academic and UX dilemmas were solved with your support.
Secondly, I wish to express my gratitude to my advisor Kaushik Eshwar Sriraman who was always ready for discussion, encouraged me to explore technical conferences and gave me the freedom to solve the problems myself. Ericsson has provided a motivating and flexible working environment, where I had the opportunity to utilize the in-house network and resources.
I am grateful to my instructors Jani Holopainen and Osmo Mattila -University of Helsinki for guiding, uplifting and providing me the tools and space to build the VR prototype. Your constant support and positive team spirit helped me complete the prototype within the time frame.
My greatest thanks to Arttu Aho - Telia company for sharing his knowl-edge, past experience and list of challenges that exist in IoT development process. Also, to all the interviewees for taking their time and sharing their views on the discussed topic. I acknowledge the related courses and the amazing learning space provided by Aalto University.
Finally, for unconditional support, I thank my team at home, mom, dad, and siblings. Also, my friends in Finland, who supported me through this time and proofread the text.
Espoo, April 8, 2019 Karishma Jain
3D Three Dimensional
2D Two Dimensional
API Application Programming Interface ERP Enterprise resource planning
FIOH Finnish Institute of Occupational Health
FOV Field of view
Hi-Fi High Fidelity
IAQS Indoor Air Quality System
IoT Internet of Things
JSON JavaScript Object Notation
Lo-Fi Low Fidelity
PM (2.5, 10) Particulate Matter
RFID Radio Frequency Identification Sci-Fi Science Fiction
SLR Systematic Literature Review
UI User Interface
VEoT Virtual Environment of Things
VR Virtual Reality
VOC Volatile Organic Compounds
WAN Wide-Area Network
Abbreviations and Acronyms 4 1 Introduction 9 2 Conceptual Background 14 2.1 User experience . . . 14 2.1.1 Definition . . . 14 2.1.2 Related concepts . . . 15
2.2 Internet of Things - (IoT) . . . 17
2.2.1 IoT data . . . 20
2.2.2 Design issues of IoT . . . 22
2.3 Immersive technology . . . 25
2.3.1 Existing applications . . . 25
2.3.2 Benefits of immersion . . . 26
2.4 Positioning of thesis . . . 28
3 Methods 29 3.1 Data gathering requirements . . . 29
3.1.1 Theoretical overview of the methods . . . 30
3.1.2 Best practice evaluation . . . 31
3.1.3 Interview with stakeholders . . . 31
3.1.4 Preliminary analysis . . . 34
3.2 Prototype implementation . . . 35
3.2.1 Concept creation . . . 36
3.2.2 Sketch . . . 38
3.2.3 3D meshes and environment . . . 40
3.2.4 Interaction . . . 42
3.2.5 Movement and orientation . . . 43
3.3 Experiment setup . . . 45
3.3.1 Participants . . . 45
3.3.2 Procedure . . . 48 5
4.2 Summary of findings . . . 50
5 Discussion 62 5.1 3D visualization helps understanding of data . . . 62
5.2 Required level of immersion . . . 65
5.3 Advantages and disadvantages . . . 66
5.4 Personal learning . . . 70
5.5 Limitations and future research . . . 72
6 Conclusions 74 References 76 A Appendices 85 A.1 Interview questions . . . 85
A.2 Interview insights . . . 89
Glossary 92
2.1 User experience and usability goals . . . 16
2.2 IoT touchpoints . . . 19
2.3 IoT enhanced user experience model . . . 23
2.4 Positioning of thesis . . . 28
3.1 Advantage and disadvantage of immersive technologies . . . . 32
3.2 Overview of the method applied for interviews- Adpated from Bergman and Johansson (2017) . . . 33
3.3 Snapshot of interview planning . . . 33
3.4 Snapshot of analysis of stakeholder interview . . . 35
3.5 Flow of IoT context . . . 37
3.6 Basic level of data flow in the respective IoT system . . . 37
3.7 Requirement list for the prototype content . . . 38
3.8 VR sketch sheets . . . 39
3.9 Visual : Sensor hub section . . . 40
3.10 Visual : Cloud structure . . . 41
3.11 3D Meshes : Sensor data values . . . 41
3.12 Virtual brush in VR space . . . 42
3.13 Test environment . . . 45
3.14 Participants profile : part 1 . . . 46
3.15 Participants profile : part 2 . . . 47
3.16 Rough sketch of the plan . . . 48
4.1 User-1 performing task-3 . . . 53
4.2 User-2 performing task-2 . . . 54
4.3 User-3 performing task-3 . . . 56
4.4 User-4 performing task-3 . . . 57
4.5 User-5 performing task-2 . . . 58
4.6 Participants knowledge on IoT concept . . . 59
4.7 Positive impact of visualization . . . 60
4.8 Spatial section : Significant vs Insignificant . . . 60
4.11 Spatial understanding helps to retain data . . . 61 5.1 Abstract visual : Graph . . . 68
Introduction
In the past decade, the need for visualizing data in a comprehensive style has significantly increased. The need arises with the tremendous efforts taken in the data industry to unfold the complexity of the existing load of information. The well-depicted visualization plays a crucial role to quickly process the data. In addition, this provides clear understanding to the user, which is very well elaborated in the research - Ward (2015). The author believes that properly depicted visuals can provide better avenues to solve problem and effectively analyze data. Likewise, according to Brunhart-Lupo et al. (2016), visualizations present the raw data into more human understandable information. This further enables user to make productive decisions based on recognized patterns.
Although there are many kind of technologies to enable and provide visu-alizations in an appropriate format. One of the emerging technology is virtual reality (VR) which can amplify the benefits of visualization as it provides a simulated environment that might reflect similarities to the real world. For example, the user can travel from one part of the world to another from the convenience of one's home or visualize the timeline of stock market in a form of ladder. The former example renders the real world image with motion inside VR. Whereas, the latter example allows the user to walk down or up the ladder based on his/her actions. Thus, a simulated environment, that is, VR can provide visual abstracts and clear statistics.
In addition, immersion provides a better perception of a datascape ge-ometry, more intuitive data understanding, and a better retention of the perceived relationships in the data as per the theory stated in Donalek et al. (2014). The immersive VR places the user in the virtual environment (VE), a virtual scenario, and detaches them from the real world interaction. this is further proved by Teasley and Wolinsky (2001). In regard to provide an immersive experience, the purpose of VR application defines the level of
mersion - low level or high level. Since it provides a new reality experience, the user might fear the technology. This fear might also lead to usability issues and thus, complicate the experience.
Several examples are available where VR can enhance one's experience
and help to deal with various problems. In the beginning, VR provided ap-plications in the entertainment, gaming, and medical industries. However, later on, the experience was shared beyond fantasy and into the corporate life. One of the proven domains is enabling organizations train novice employees in safety-critical situations. The challenge arose due to the risks involved in the actual environment. For instance, training programs in a military, construction, and aviation requires real life work scenarios. Thus, VR ap-plications simulating actual work environment are implemented to enable trainees to practice in life-critical tasks.
Similarly, there has been explorations of many other domains which are applicable for VR as technology and one of them is Internet of things (IoT). This is a popular domain where VR collaborates with products connected over the internet. It shares a basic philosophy with IoT. In relation to the outcome of both the technologies, the fundamental basis of virtual reality is to portray the digital world as real. Whereas in IoT, the devices from the real-world are manipulated in such a way that they are flexible in the digital world. Currently, real-world objects operates with different interfaces. This provides different visualizations and thus, different experiences for the end-user. Thereafter, creating challenges for the end user to analyze and understand the data.
Consequently, numerous studies share that there is a potential use of im-mersive technology in IoT field. For example, the possibility of virtual sen-sors, immersive 3D environment known as Prototypical virtual environment of things (VEoT) - Alessi et al. (2016), virtual reality utilized as a visualiza-tion platform, and VR binoculars, which is a digital visualizavisualiza-tion framework that operates in real time, as proposed by Toumpalidis et al. (2018).
A classic IoT solution consists of a complex mix of IoT endpoints, plat-forms, back-end systems and data (For example, sensors, actuators, proces-sors, embedded software, local and long range connectivity, middle ware, apps, analytic, and machine learning) that flows seamlessly across interfaces, as shared by Mendix (2017). Once these multiple data types from several devices are together, the end user needs to access a simple yet informative visualization. The end user can access the data on any interface they want, such as a phone, laptop, or big screens in a workplace. Different users, such as an owner, financier, and technician, should have access to their own infor-mation. With such diversity at many levels, the interaction between a user and the product becomes difficult. There are different factors in parallel to
interaction, such as usability, accessibility, and fun which effects the overall satisfaction level of the user. The process to identify and work on these im-provements is known as User experience (UX) design. Since IoT solutions are complex, the UX design becomes complex too.
In order to better understand with a real time example, consider a typi-cal IoT solution in a smart home scenario. This includes smart devices and electronic gadgets connected over the internet. Here, the data is exchanged, analyzed, and presented on the user dashboard using IoT technology. The correct operation of the development and maintenance stages involve a stack-ful of layers. This in return reflect on different interfaces and visuals - thus, creating inconsistent user experience problems on broad areas.
Likewise, a narrow focus on interactive products might not help because they do not capture the incongruent aspects emerged from the smart tech-nology. The practitioners and researchers, together seem to encircle the UX approach instead of Human-Computer Interaction (HCI). Moreover, Miner-aud et al. (2016) studied the loopholes of current IoT platforms. This analysis signifies the need to improve visualization, cross-platform interaction, data management, privacy, and views from all stakeholders. In the direction of improving visualization, understanding the visual content is important. This is followed by, enhancing the user awareness and user engagement level. The consumers are not familiar with the technology around them in public loca-tions. These highly sophisticated machinery might capture physical analytics within the environment in which they inhabit. Later, these analytical data is leveraged to companies so as to provide new knowledge about the consumers. Finally, this could affect people's lives in uncertain terms. This leads to
un-satisfied user experience, frustration, mistrust, and poor levels of adoption as a result of an inability to capitalize on benefits, as per Mikusz et al. (2018). In a nutshell, visualization in VE provides an effective environment where one can learn the concepts by performing the required actions within the VR space. This is supported by Kreis et al. (2018) who trace the benefits of VR applications, especially, in an area on how to spread knowledge. As VEs provide the possibility to interact with the information. The translation of training experiences into real world skills might also be possible. Moreover, this opens up the route to research more in the field of immersive visualiza-tions. Henceforth, studies of visualization in 3D environment might improve the learning process in an effective way. Correspondingly, the hypothesis for this study are the positive impact of learning through the aids of visuals in 3D environments. Since the 3D environment demands immersion, it is noticed that a certain level of immersion is suitable for certain applications. This principle might not only help in improving one's grasping power but also in
RQ1 How visualization in virtual reality help to understand the flow of (IoT sensor) data?
A What is the level of immersion required to understand (IoT sensor) data?
B What are the advantages and disadvantages of VR based visualization? Table 1.1: Research questions
scope of this prototype, only the data flow of an IoT system was visualized in virtual reality.
This thesis aims to address how IoT data is depicted in a virtual environ-ment and how users comprehend the visuals in order to determine appropri-ate guidelines for optimizing the user experience. The focus is also to enable the user to have an enhanced experience in an engaged form. Finding the right level of immersion will help achieve the goal. In addition, the findings from several studies, such as Kaasinen et al. (2015) are also collated together to identify the issues derived from certain technology, especially in terms of UX. Applying a similar approach, this study consists of two parts : prototype implementation and empirical study. After studying the latest materials on related topics, a possible approach of constructing a high fidelity prototype was chosen and implemented. Further on, interviews with five users took place before and after interacting with the prototype. In pursuance of learn-ing the IoT technology and virtual reality, experts from the correspondlearn-ing industry were interviewed, and the insights were noted.
The insights were constructed during the research phase. Research ques-tions were formulated, as shown in Table 1.1. The primary research question RQ1 is divided into two main sub questions A and B.
The remainder of the thesis continue as follows : “Chapter 1” unfolds the research question by introducing the various concepts and terms required to obtain an overview of the thesis title, followed by “Chapter 2” that describes the academic background required to understand the concepts related to the thesis topic. This chapter starts with an overview of three different topics: UX, IoT, and VR and it ends with an explanation of the core focus of the thesis title. In order to implement these theoretical concepts into practical procedure, “Chapter 3” describes the scientific method applied to gather the requirements, trace the design and prototyping process. In addition, this chapter addresses the important points to consider while preparing for inter-views, and analyzing qualitative data. Further on, “Chapter 4” summarizes all the results obtained from prototype test, user interviews, and analysis
of the findings. The aim to include the analysis in this chapter is to pro-vide epro-vident reasons for all the three research questions. Similarly, “Chapter 5” discusses the outcomes from the previous chapter so as to answer the research questions in an appropriate method. This chapter also acknowl-edges the findings from the other research studies that were observed in the previous chapters. It reflects on the positive and negative impacts of the visualizing in VR. However, there were few restrictions noticed during this research along with the possible future recommendations and thus, they are all mentioned in “Chapter 5”. Finally, “Chapter 6”concludes that visualiza-tion in VR helps to understand the flow of data, if implemented properly with appropriate immersion level.
Conceptual Background
This section illustrates the previous research conducted on the user experi-ence perspective of IoT ecosystem. This section also addresses its relation to virtual reality. The concepts emerging from the research questions, as stated in table 1.1 are explicitly defined and discussed in this chapter.
2.1
User experience
2.1.1
Definition
Over the years, the word “user experience” (UX) has evolved through experts opinion and still misses a formal proper definition. In business world, different definitions of UX may perplex consumers of a product or service. This might also mislead them and weaken the active efforts taken by researchers and academicians. The term User experience was described as all aspects of the end-user's interaction with the company, its services and its products
combined together by Don Norman and Jakob Nielsen, in Walton (2015). The UX field is multifaceted, incorporating different aspects on knowledge and techniques from a range of academic and commercial areas. Numerous attempts have been practiced to promote a common protocol on the nature and scope of UX. Due to the recentness and novelty of the concept, it is hard to come to an agreement.
However, theinternational standard ISO 9241-210, Ergonomics of human-system interaction, defined UX as a “persons perceptions and responses that result from the use or anticipated use of a product, system or service”, ISO (2010). Based on Hassenzahl and Tractinsky (2011) thoughts, UX is influenced by “user's internal state (predispositions, expectations, needs, motivation, mood, etc.), the characteristics of the designed system
ple, complexity, purpose, usability, functionality) and the context (or the environment) within which the interaction occurs (For example, organiza-tional/social setting, meaningfulness of the activity, voluntariness of use)”
Initially, user experience was mainly about providing features checklist or fulfilling users' wants. At present, true user experience is considered when user needs are met along with seamless integration of different services from different disciplines, including engineering, interface design, business man-agement, and industrial design. The UX design process encloses every touch point of the user while interacting with the system, virtual or physical. The overall aim is to create meaningful and relevant experience for the user. Re-cently, a thorough study was carried out by Bakioglu (2018), to measure the return on investment (ROI) for UX in enterprise organizations.
Traditional HCI focuses on achieving behavioural goals during the usabil-ity test of the system. The user experience has evolved from HCI focusing on positive outcomes and developing quality experiences instead of resolv-ing usability problems. This is further accomplished by considerresolv-ing wider boundaries of user satisfaction and competitive differentiation. Hassenzahl (2018) consider designing for pleasure rather thanabsence of pain theory as a part of future UX design.
According to Hashim et al. (2018), UX is considered as a subjective in-tellectual in universal concept that strongly touch the usability aspects of the user, the value sensitive design, social and cultural communication, and emotional including experience such as fascination, joy, excitement, and aes-thetics. As a result, similar concepts revolving around the various aspects of UX were considered to bring forth the core concept that best suits this research.
2.1.2
Related concepts
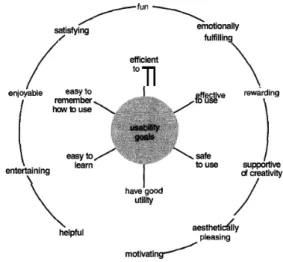
Over the years, many attributes and terms are created around user expe-rience. These components vary based on end-purpose, context, and scale. Here, scale is referred to the specific and/or general level of analysis during the interaction between the user and the system. For instance, according to Hassenzahl (2018), usability belongs to more formal evaluative category than UX which is a combination of multiple values. UX provides an overall view concerning the quality of the system and its impact on an end-user. The figure 2.1 narrates detail aspects of UX and usability goals. The goal of designing interactive systems primarily concerns with creating the systems that are fun, aesthetically pleasing, satisfying, enjoyable, helpful, motivating, and so on as explained in the figure 2.1. These goals improve the quality of user experience whereas usability goals are more focused on efficiency of the
product, utility, and safety of the product allowing the user to learn well and optimize the overall interaction with the system, as mentioned in Preece (2002). The usability goals plays a central role in the interaction design cy-cle and are rationalized through a specific criteria. Subsequently, the user experience goals are less clearly defined and embraces every aspect as shown in the outer circle in the figure 2.1.
Figure 2.1: User experience and usability goals
The user emotion plays a central role in user-experience. It describes the bond formed between an individual (consumer or end user) and product or service. Designers usually focus on achieving positive emotional outcome in a form of experience as proposed by Hassenzahl (2018). However,the user awareness and user engagement from Hartson and Pyla (2012) research study are a few main attributes of UX that will be discussed further in the study. The Curry et al. (2018a) study explains the importance of having an effec-tive user experience within a smart environment for its success. Here, smart environment means smart buildings, smart cities, smart energy management system and the list goes on. The author investigated user awareness and user engagement attributes from human-computing interaction phase. Their assessment helped to find the users' actual needs. Consequently, user
inter-action, as referred in Hartson and Pyla (2012), must be considered within a context or environment shared between the system and the user. The in-put actions can be controlled by user or system and it will still be called as user-system interaction. For example, a smart wall, a wall with ambient intelligence, can proactively extract inputs it needs from a user by sensing user's presence and identifying the user with something like radio-frequency
as shared in Hartson and Pyla (2012).
The UX design process, as referred from Bergman and Johansson (2017) academic paper, is divided into four phases : analyze, design, prototype, and evaluate. This is an iterative cycle along with multiple repetition of each phase. Additionally, Preece et al. from Preece (2002), Arvola (2014), and Hartson and Pyla (2012) briefly described each of these phases in their respective studies.
A qualitative data representation guide user to understand data in an effective and easy manner. Moreover, to view a problem in a structured format, the availability of sources to visualize these format plays an important role. A clever visual representation will help to communicate a complex message to a diverse crowd. Once we understand how our eyes processes these complex visuals, we will find our-self at better position to arrange elements more effectively. The authors from Dalton (2016), and Donalek et al. (2014) proves that once our brain understands the method of processing visual elements, it becomes easier to arrange these elements in an effective way.
This thesis will consider the holistic approach of understanding UX issues of the user during the review. In regards to aggregated view, Owen (2007) in-troduced a few capabilities that designers should adopt, including a perspec-tive focusing on humans and surrounding environment, a tendency toward versatility, a subjective use of language, a friendly bond for good teamwork, a combination of potential components instead of making a decision among the imperfect and inflexible answers, and communicability through visual-ization Dalton (2016), Donalek et al. (2014). Although, constraining to the scope of thesis, user engagement and user awareness were main focus of this study. The underlying facts and reasons for the same are explained clearly in the section 2.2. This section also explains the need of IoT context combined with user engagement and user awareness subjects.
2.2
Internet of Things - (IoT)
IoT is a growing technology due to the accessibility and availability of in-ternet and connected devices. This technology enables us to interconnect the physical world with digital using devices, sensors, and actuators. The data is accumulated using devices and it's sensors. This data is processed
and translated into commands which are further executed using actuators. The International Telecommunication Union (ITU) defines IoT as “a global infrastructure for the information society, enabling advanced services by terconnecting physical and virtual things based on existing and evolving
in-teroperable information and communication technologies.” as clearly stated in paper written by Bergman and Johansson (2017) and ITU-T (2016).The Cluster of European Research Projects on the Internet of Things (CERP-IoT) defines it as “a dynamic global network infrastructure with self configuring capabilities based on standard and interoperable communication protocols where physical and virtual things have identities, physical attributes, and virtual personalities and use intelligent interfaces, and are seamlessly inte-grated into the information network” as referred in Bergman and Johansson (2017) and Harald Sundmaeker et al. (2010).
In 2020, 20.8 billion devices are estimated that to be connected via the internet according to Gartner, Inc Fraifer et al. (2017). The IoT based com-panies are trying to integrate machine learning technologies in their platforms to provide intelligent, personalized, and engaging user experience. These IoT solutions are built by a combination of different types of developers provid-ing their expertise across edge computprovid-ing, platforms, web-services, mobile applications, data analysis distributed in multiple tiers. The edge tier cov-ers both gathering of data and end-to-end point communication of real-time data between sensors, actuators, and devices.
Three decades ago, Mark Weiser proposed a vision ofubiquitous comput-ing in his journal Weiser (1991). This term was carried ahead by science fiction author Sterling and Wild (2005) who envisioned its usage in Shaping things. Mobile to mobile communication has evolved from communication protocols to sensory hardware, mobile, and pervasive device, alongside social and cyber-physical networks, resulting in an interesting concept combined with inherent complexities known as Internet of things (IoT), as mentioned by Ahsan (2015). In ideal scenario, IoT will enable users to connect to any
things placed at any place running over any network/path providing any ser-vice, as proved by Chuang et al. (2018). The Radio Frequency Identification (RFID) tags are one of the early examples. The active participation of the users in IoT is highly supported by the widespread distribution of intercon-nected devices and sensors. According to Munjin (2013) paper, consumers started producing information, data and software to increase business bene-fits, along with being passive users. A considerable amount of research has been carried out to implement smart applications, such as smart homes as described in Luigi De (2015) study which is based on trigger-action (If This Then That) principle.
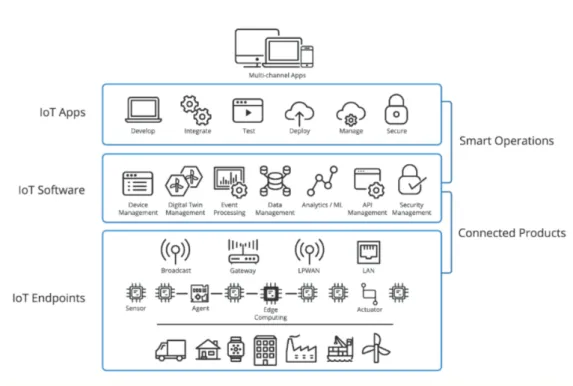
The IoT ecosystem provide different touch-points for the end user to par-ticipate. These end points communicate with the help of variety of software's to manage device, security, digital twin functionality, API and so on. The developers create and adopt IoT-related applications to perform the corre-sponding operations. The IoT ecosystem model layer frames IoT devices
and services on the basis of their categories (For instance, lighting systems, user devices, smart appliances) and their final capabilities, such as switching, sensing, actuating, and communication. In addition, to consider a real time scenario indoor air quality monitoring (IAQ) system is a good example that as it runs on IoT technology. In addition, there are IAQ sensors which mea-sure the air quality within and around the buildings. They are important and handle air quality systems in an efficient way. Overall, these IoT devices provide functions for sensing and actuating in the physical world. The local and wide area networking provides these with the necessary infrastructure to connect to services, adopting wireless sensor networks to form multi-hop architectures with gateway sensor nodes that provides WAN connectivity towards the back haul network. The IoT ecosystem on high-level are
re-Figure 2.2: IoT touchpoints
ferred on Mendix (2017) and also adapted in this thesis as illustrated in the figure 2.2. The data management handles essential functions such as data acquisition, validation and storage, and makes sure that critical information is available at the right point in a timely manner, and in the right form. Business processes refers to the series of steps to perform management, op-erational, and supporting activities for achieving specific mission objectives, as referred in Holler (2014). A few academic studies have been focusing on
exploring types of IoT applications suitable for enterprise solutions as shown in the research conducted by In Lee Kyoochun Lee (2015). These real-world IoT applications are developed considering its impact on customer value. Enterprise applications are categorized as:
• Monitoring and control
• Big data and business analytic
• Information sharing and collaboration
2.2.1
IoT data
In general, data are raw values or symbols that are untranslated into any meaningful form. They describe a sequence of events without any relation to each other. This raw data is connected together to form a meaning based on the purpose and context, which results as Information. Further analysis of information helps to articulate answers for questions like “why, when, what or where”. However, knowledge reflects the cognitive processing of information and its match with the existing human knowledge structure, according to Keller and Tergan (2005) research. In IoT, data is produced from the connected objects and their sensors. This data offers the promise of new services, improved efficiency, and possibly more competitive business models.
The data produced by IoT devices provide enormous value only when utilized after it's analysis. Both knowledge and data are the wealth of IoT
industry. Invariably, tremendous amount of data is generated from the de-vices and its sensors which is further sent to a common location-say gateway or the cloud. Here, the data is processed and sent back to the sensors of the devices. Henceforth, the process is imperative to have an efficient way of collecting small amounts of data and processing it to the centralized loca-tion, and again sending it back to the sensors - all in real time. The immense explosion in numbers and capabilities of these devices and sensors result in large data size. It's processing can be extremely large (volume), fast
(veloc-ity), and diverse (variety)- all the characteristics associated with big data. The role of big data on IoT is massive, but the most visible applications will be in analytic section, data security, and data storage fronts.
Though the value of data in IoT is high, there are problems understanding this data. Especially, when the data is streaming and extracting valuable information from sensors, as also explained in Teachey (2018). Though, there are still issues with stored data that needs to be addressed. From IoT user experience perspective, one of the biggest challenge is unifying all the
interfaces communicating across different applications. The IoT product as a whole is a combination of number of visible layers overlaid on invisible layers. Due to the existence of hidden layers, it is difficult to synchronize the interfaces and give a good experience to the user in a single app, as highlighted by Fraifer et al. (2017) research. Moreover, data is represented in different formats and models. Handling raw data offered by sensors without well-structured knowledge model is difficult. It becomes more complicated when new data are generated rapidly both in amount and types. This also explodes the number of ways required to filter, analyze, compare, contrast, interpolate, and extrapolate produced data.
The different varieties utilized to operate with data will affect the whole IoT ecosystem if changed in an inconvenient way. Especially, designers should consider to design for the whole ecosystem and not only a mobile application complied with IoT backend. As IoT is growing on large scale connecting many devices and its sensors, the data provide more opportunities for further applications, and business models. Yet another challenge will be with the companies who want to implement IoT in their current business. They need more skilled business analysts who can use the semi-structured, structured, and raw sensor data into valuable business insights as recently published in Ranjan Pattnaik et al. (2018) report. More IoT-specific skills are required to help companies realize the possible IoT applications for existing products and services. Ranjan also addressed a few other issues like infrastructure, quality of data, choosing software stack, analyzing data and skilled manpower.
There are a few problems faced by the developers of IoT industry. These developers who want to practice IoT products need to negotiate access in-dividually and adapt to the platform-specific API and information models. Having to perform these actions for each platform often outweighs the possi-ble gains from adapting applications to multiple platforms. This fragmenta-tion of the IoT and the missing interoperability result in high entry barriers for developers and prevent the emergence of broadly accepted IoT ecosys-tems, which can be reviewed in Broring et al. (2017) research study. In design perspective, these dis-connected interfaces add complexity for future IoT based product and service design. To tackle this complexity, UX can be used as a tool in holistic approach. Traditionally, multiple data points are generated on different devices consisting of different interfaces. A single platform gathers all these data points from different sources. For example, an IoT solution at a oil refinery industry might aggregate data from the oil ma-chine, petrol, and workshop. The end-user expects a simple yet informative visualization on their dashboard which may be accessed via phone, tablet or computer system. In the oil refinery case, the product manager who moni-tors the factory would like to see working speed of oil machine. IoT solution
should be capable enough to handle the diverse and distinct layers. Hence, the UX design becomes more complex when addressing all the hidden and visible factors available in an IoT ecosystem.
One of the methods to solve the previously stated challenges is to provide clear visualization of sensor data and processed information. According to Ware in Keller and Tergan (2005), the “power of a visualization comes from the fact that it is possible to have a far more complex concept structure rep-resented externally in a visual and verbal working memories”. Furthermore, the cognitive load used by the human brain to understand the textual or verbal information could be reduced. Visualizations enhance the processing ability of human brain by depicting abstract relationships between visualized elements and may serve as a basis for externalized cognition, as implemented by Keller and Tergan (2005). However, computer scientists referred infor-mation visualization as “the use of computer-supported, interactive, visual representation of abstract non-physically based data to amplify cognition” from Sears and Jacko (2009).
2.2.2
Design issues of IoT
The chapter : Real world design constraints from Holler (2014) book briefly describes the design challenges in IoT ecosystem. They are broadly divided into three sections, namely technical design constraints, data representation and visualization, and interaction and remote control. The derived insights were related to data representation, such as unavailability of standard forms to represent data, demand of homogeneous visual interfaces, and inefficient storage methods. The practitioners and researchers from Krco et al. (2014) research have put an effort to ensure a common understanding of the IoT architecture design by assigning a common framework. This solution was proposed to comply the different requirements of different application do-mains belonging to a single IoT system. This limited interoperability issue further impeded the development of IoT system.
Different use cases were discussed by Montori et al. (2017), Ratan Vatsa and Singh (2015) showing a wide range of possibilities and complexity of IoT. To name a few, smart cities and smart environments include applications to monitor air quality, watering, and easy navigation. Further on, smart grid monitors the water networks and the usage of electricity. However, traffic monitoring is covered in smart transportation and logistics. All these smart projects are interconnected to each other and thus, sharing data across all the platforms. The efficiency and reliability of IoT technologies can be im-proved by creating better awareness of the systems. For example, Curry et al. (2018b), has narrated the impact of IoT data and its analysis on user
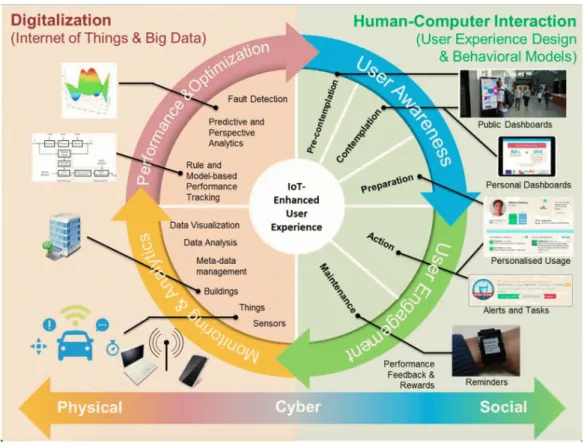
behaviour model. The figure 2.3 ( adapted from the same paper) also ex-plains the improvement in user awareness level based on targeted information delivery. The paper further talked about the importance of engaging users by delivering actionable information. A similar approach was followed in the thesis during concept creation and analysis phase. Recent studies
in-Figure 2.3: IoT enhanced user experience model
cluding Laha and Bowman (2012b) research have shown value of immersive virtual reality in the visualization of scientific and volumetric data. More-over, Patrick Milliais, Simon, and Ryan kelly in Millais et al. (2018) study found that there is no overall task-workload difference between traditional visualization and immersive visualization, but there are differences in the ac-curacy and depth of insights that users gain. The study further investigated the influence of virtual reality on users'method of exploring data and gaining
insights. The impact on users' experience and understanding of data inside
the unreal world as compared to 2D visualization was also considered. As a result, participants who used virtual reality as a visualization tool rated their performance workload as lower (corresponding to increased feelings of success and satisfaction), compared with participants in 2D conditions, as
also explained in Millais et al. (2018) study.
Primarily, researchers started using visualization as a supportive tool to explore large data set. Though the effectiveness of desktop visualization can be enhanced by providing facility and freedom to explore multi-dimensional data. This also relates to the two main attributes of big data which are ab-straction and high dimensional data. The visualization is a bridge between the quantitative content of the data and human intuition, and this is an es-sential component of the scientific path from data into knowledge and under-standing, as referred in Sharma et al. (2015) paper. A powerful visualization help to find attributes that would have not been found otherwise. Moreover, it allows understanding of both low-scale features and large-scale data, and learn how the data was gathered. A very famous Visual Information-seeking mantra from Shneiderman (1996) goes like “Overview first, zoom and filter, then details on demand”. With the change of speed in every technology, the users are no longer satisfied with static visualization. They are inclined more towards finding new ways of interacting with the data and gaining more in-sights. Immersive data visualization is one of the new and effective ways to analyze data. Donalek (2017) and Kabil et al. (2018), are a few examples showcasing the possibility of effective data representation in 3D environment as compared to 2D.
A more natural and quicker method of exploring large data sets could be VR's wider field of view and increased spatial dimension as suggested by a
few data visualization researchers. It could also add value to the gathered analysis of scientific data. However, as an exceptional case study, Lange et al. (2006) tried to drill down different concerns related to the visual data dis-played in different environments and focused on how humans perceived more information in virtual reality environment as compared to 2D flat screen. The research examined how VR performs vs 2D when it comes to pointing out relative positions of objects. As a result of this study, participants were comfortable in completing their tasks using virtual reality as compared to 2D desktop. According to the author from Ware (2012) research, it is still an open question if VR has the potential to improve data visualization, es-pecially in air traffic control situation. However, the main difference between 2D and 3D visualization is that 3D suggests a range of depth cues and per-spective in the user interface as proposed by the same study. In addition, Graˇcanin (2018) stated that VR based user interface and visualization are used to evaluate IoT computing applications and further helps to test various IoT configurations while interacting with the VR space.
2.3
Immersive technology
An immersive virtual reality environment gives one a sense of being physically present in a non-physical world. The term virtual reality (VR) is defined as a medium composed of interactive computer simulations that sense the par-ticipants position and actions providing synthetic feedback to one or more senses, giving the feeling of immersed or being present in the simulation, as per Craig et al. (2009) study. Tools like Head Mounted Display (HMD) and a few other alternatives are used to create the illusion of being present in an unreal world. Beyond entertainment, VR has successfully deployed in vari-ous industries and used for applications like oil and gas exploration, scientific visualization, architecture, flight simulation, therapy, military training, engi-neering analysis, and design review as highlighted in Jerald and Jason (2015). Instead of creating an immersive environment, interacting with the system that involves real world image is also possible, this falls into the category of augmented reality. This technology can be applied in similar industries but for specific tasks like maintenance of complex systems, and visualizing data on top of real object. The mixed reality is where the virtual and real world fuses together seamlessly. Though immersive feeling can be provided by 360 photography and video, it still lacks the good experience which is otherwise offered by VR. Their development and outcome experience differs fundamentally.
2.3.1
Existing applications
Total immersive virtual reality is appropriate for applications like phobia therapy, medical or military training, and entertainment industry as proved in the study written by Doug A.Bowman (2007). Specifically for these types of applications, user requires high sense of fidelity - visual, auditory, and other sensory cues that matches closely to the real world experience. The creators of VR experience aim to provide realistic experience to the user by duplicating similar features inside VR world. This is achieved by focus-ing on two main attributes, namely Presence and Immersion. Mel slater in Doug A.Bowman (2007) research study defines immersion as the objective level of sensory fidelity a VR system provides whereas presence refers to a user's subjective psychological response to a VR system. Immersion is
objec-tive in nature, different systems can have different levels of immersion based on their purpose to fulfill. The level of immersion can be measured whereas presence is context-dependent. The sense of being there is dependent on the users'response and is related to the experience of the individual. Mel slater
also proved that high-fidelity sensory stimuli helps to offer immersive VR by placing the user in the simulated environment and giving them realis-tic experience. There are also applications that does not make the user feel present but provide a simulated view of the real world without presence. The task efficiency might not depend on feeling of being there. In addition, the visualization might even be purposefully abstract, or unrealistic, to help the user understand the critical features of the space.
2.3.2
Benefits of immersion
The potential benefits of higher level of immersion other than providing a realistic experience are : spatial understanding and depth cues. The former aligns to be one of the most intuitive benefit and the latter means higher level of immersion. This impacts positively on applications such as design review, prototyping in virtual space, and digital data visualization. In addi-tion, it decreases information clutter and thus, removes unwanted data. Two dimensional (2D) computer desktops are filled with overlapped icons, win-dows, controls and notifications. There have been several attempts to solve this issue by placing multiple monitors or virtual desktop. However, higher level of immersion might be able to decrease this information clutter with the combination of wide field of view (FOV) and high resolution, hence more comprehensible virtual environment which is suggested by Doug A.Bowman (2007). The higher level of immersion contribute to improved interaction task performance but lower level of immersion can also be helpful when the visualizations are less complex and more regular to interpret. The present use case of virtual reality in the society is briefly discussed by Kreis et al. (2018) which also helps to understand its role in the society. They also describe how the functionality and effectiveness has improved and will have an impact in future. Presently, practitioners in medical field use virtual reality to tackle different types of phobia with regular treatment. But the meaning for these new technologies in terms of UX is still unclear. With the rising applications and quick progress in the technology field, UX-centric process supports these fields to succeed. Since, the control is on people’s satisfaction level and they will adapt to these new ways of living, it needs to be believable.
The wholesome virtual reality experience is created by combination of different elements of user experience, and cannot be created by modifying one or many user experience attribute. It goes beyond immersion and pres-ence. According to Garner (2018), it includes flow, diegesis and fun which collectively illustrate the nature of VR experience.
Along with different components of VR experience, there arises interactive issues. Jared (2016) described that reality and location are two unique issues
based on their dimensional model of VR experience. Here, “reality” refers to the scope covered by the material presented which either belongs to real world or is rendered content. The term “locomotion” refers to the possibility on how the user can physically move in the virtual environment. This led to the need of understanding user-experience in an immersive experience in order to ensure effective design systems and applications.
As mentioned earlier, immersion and presence are the hallmarks to pro-vide real-world experience in simulated ambience. Yet another significant factor is interaction. Though immersion and presence are different at fun-damental levels, they influence the interaction phase of VR. Identifying the ways people interact with VR is important as it might reveal potential use cases that are yet to be discovered.
Further on, Alam et al. (2017) discusses that the combination of partial immersive experience with IoT technology are implemented across variety of applications like web based AR application within IoT infrastructure, medi-cal visualization, path planning, sensor-detection, and analysis. The virtual reality is also trying to change the working style of professionals. Companies provide collaborative virtual reality experience for teams to work together from remote places. They provide open-source systems that could be inte-grated with commercial VR headsets, such as Oculus Rift and HTC vive. So, by applying common tools the teams can create scalable VR environments. Presently, the market is booming with the successful fusion of real world and virtual objects through diverse real-time applications. Prototypical Virtual Environment of Things (VEoT), within an immersive 3D environment in which the user can explore the virtualized urban area and interact with the available smart objects through gestures and affordable VR devices is one proven example certainly researched in the Alessi et al. (2016) study. This analysis also provides the technique which could be used to prototype the low-fidelity VR environment.
2.4
Positioning of thesis
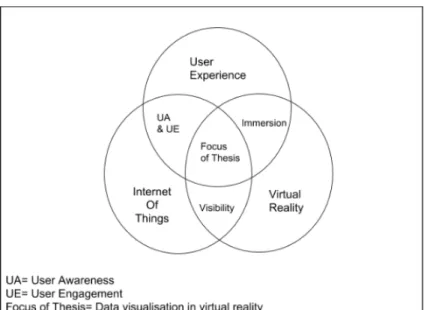
This section aims to describe the elements taken from each major topic, namely IoT, VR and UX to outline this thesis. From literature review section 2, it is seen that both IoT and VR technologies can be captured through the lens of user experience. According to Doug A.Bowman (2007), a good experience for VR is created with the combination of immersion, presence and interaction, as also mentioned in detail in the earlier section. However, Curry et al. (2018a) exhibits the possibility to qualitatively measure the users'understanding on virtual IoT concept . This is achieved by enhancing
the user awareness level and maintaining the engagement level inside VR space. The below picture illustrates the core concepts used in this thesis. As the concepts are too wide, only suitable themes among the concepts are associated together. The goal of this research is to assist naive developers to learn IoT process. This is accomplished by visualizing the invisible data in virtual reality medium. In addition, the data was qualitatively gathered and analyzed to understand user point-of-view and the underlying reasons. All these pointers are incorporated together as data visualization in virtual reality. As a result, core focus of this research was formulated.
Methods
3.1
Data gathering requirements
This chapter includes the scientific research method required to execute the study. All the processes and approaches in this study are depicted in a step-by-step scheme. However, the tweaking of the concept prototype was an iterative arrangement. The goal here was achieved through literature study and expert interviews. This was inspired by Bergman et al. (2018) research. The authors describe the method to formulate empirical study, apply scien-tific method to conduct interviews, and analyze gathered qualitative data as shown in the figure 3.2. A similar approach for conducting interviews was uti-lized and the detailed description is available in the subsequent subsections. From the interviews, a number of issues were identified that correlated with the research from the literature study. Based on these findings, visualizing data and its flow were identified as suitable areas for further improvements. In order to build and test this area, guidelines from Hevner (2004) research was implemented. He established seven guidelines to conduct, evaluate, and present design-science research. Specifically, a conceptual framework for in-formation systems research both in behavioural-science and design-science paradigm. However, this thesis focuses only on the design-science paradigm which means addressing research through building and evaluating artifacts to meet the identified areas. Here, building the artifacts refers to prototyping. Further on, Carr (1997) defines prototype as instruments and prototyping as a process to build and refine a product in an iterative mode to meet end-users expectation. Hence, these guidelines were implemented during the prototyping phase.
Similarly in this thesis, Lo-Fi and Hi-Fi prototypes were developed in an iterative prototyping development approach. To develop these artifacts
unreal engine for HTC Vive was utilized. In order to understand if the pro-totype was appropriate in learning IoT concepts effectively, testing with real users was conducted. This helped to recognize the relevancy of visualisation in VR and its influence on end-users.
Overall, a combination of these methods helped to execute the study in a fairly exploratory case-study style. In addition, considering the novelty and the nature of VR from industrial perspective, this study was guided by a qualitative approach. Comparatively speaking, quantitative methods are more suitable for objective goals than qualitative methods. The implemen-tation was carried by gathering the requirements from stakeholders, followed by developing the prototype and testing the setup.
3.1.1
Theoretical overview of the methods
The design theories and implementation guidelines related to VR are thor-oughly understood by studying the literature. The review process was fol-lowed under the guidelines of Kitchenham & Charters (2007). Nonetheless, it should be noted that these guidelines were not completely entrenched. The Systematic Literature Review (SLR) method was tweaked as the process was continued. To elaborate, this thesis only focused on the individual studies that contribute to a systematic review. These studies could be regarded as primary study. In order to attain full knowledge about the influence of VR visualization on IoT concepts, individual studies were carried out on top-ics, such as data in VR, 3D visualization, existing application of VR, and workplace environment. Due to the limited scope of thesis and focus, a sys-tematic review in the form of a more comprehensive secondary study was not implemented. Although the SLR method is mostly applied in medical industry research, Kitchenham & Charters (2007) illustrates the guidelines for performing systematic literature review method in a software engineering field.
However, the insights collected in-process and the relevance with the the-sis title promoted few changes. Precisely, only specifying the research ques-tion, identification of research, and selection of primary studies were the three stages that were finally applied. Moreover, the steps in these stages were followed only until it met the relevancy of thesis topic and the required level of knowledge to have an overview of all the concepts. To explain in detail, the initial search traced the most relevant information related to ba-sics of VR. For example, the reading covered topics beginning from history of VR, basics of VR development, required level of immersion (for this par-ticular prototype), interaction rules, techniques, visualizing data in VR, and existing prototyping tools available until September 2018. An assumption in
regards to the validity of recently published papers and the market status of VR until 2018 from an online source was built during the search process.
In (Conceptual Background) section, a brief study about technologies that might be used as a medium of visualization tools were collated and noted. These technologies support extended reality, namely, augmented reality, vir-tual reality, mixed reality, and/or hybrid reality. The authorized scientific articles, books, credible websites, and related academic course study collec-tively contributed to this literature study
3.1.2
Best practice evaluation
Lavalle (2016) evaluates VR systems and experiences. This book describes thorough analysis on topics, such as suitable headsets, time required for a particular VR scene, required degree of field of view and so forth. Refer-ring to some of the insights raised from the book, best practice approach were explored in this study followed by creating the high-fidelity prototype. Likewise, Hevner (2004) shared “best practice approach” as textual descrip-tive method while explaining the different processes that are implemented in a working system. Correspondingly, for this thesis, available software and VR prototyping techniques were inspected. This further includes VR designing tools, such as Tilt brush, Sketch, and Sketchbox that were manu-ally pretested. During the learning phase, basic features were checked and applied to build a low-fidelity VR space. Moreover, augmented reality proto-typing tools, such as Torch and Framer were also explored to push different boundaries.
The selection of a prototyping tool and platform relied on the experts'
opinion, self hands-on experience while focusing on ease of use, degree of flex-ibility, consumption time, and lastly, online availability of required meshes and materials. A few ideas related to 360 degree and VR video were also discussed in the process. These techniques did not match the level of immer-sion required for the project and lacked its potential to provide interaction, thus, they were discarded at the initial stage. The figure 3.1 is a snippet of advantage and disadvantage analysis between AR and VR as a possible visualization medium.
3.1.3
Interview with stakeholders
Interviews were conducted with professionals within a VR development com-munity in Finland and Sweden. The pre-requirement for connecting with experts was their association with the IoT and VR industry. People with
Figure 3.1: Advantage and disadvantage of immersive technologies
sheer knowledge were removed, because that would not help to deeply un-derstand the technology. These interviews enabled the extraction of current market scene on VR-work related environments, projects related to visualiz-ing data in VR, general challenges, and opportunities. As a result, experts from both small and large companies were added to the list.
From academic perspective, the overall planning was followed in regards to the method applied in Bergman and Johansson (2017). This research method follows a qualitative approach where companies were invited, in-terviewed and their recordings were transcribed to form conclusions. In this thesis, pilot interviews were organized to refine the interview questions. Nonetheless, Bergman's target audience differs from the current research
study. The interview instrument in the Bergman's research was customized for companies, whereas, in this research the target stakeholders were develop-ers and experts from different fields, this infdevelop-ers more user centric than product centric. However, the process followed in both the research studies as shown in figure 3.2, clearly describes the step-by-step scheme. Broadly speaking, this scheme is divided into planning, conducting and analyzing data. In or-der to attain knowledge on user pain points and needs, in-depth interviews were organized with IoT application developers. Further, the “Three Boxes” method from Hall (2013) was practiced to structure the interview questions in three broad parts: introduction, body and conclusion. The questions were tuned with respondent profile, as shown in Appendix A.1.
User needs - interview
Once the participants were selected, an interview was organized via skype and in-person (if agreed). The data was collected by applying a semi-structured
Inviting stakeholders
Figure 3.2: Overview of the method applied for interviews- Adpated from Bergman and Johansson (2017)
format. The interview questions were constructed in prior to the actual in-terview and later the respondents had the freedom to choose the order. This granted some space to explore the topics in a flexible manner. In addition, it allowed the possibility to have follow-up questions and sessions. The inter-view was planned in correspondence to the method as described earlier. The user segment required for the experiment covered IoT application develop-ers working in environment similar to medium-sized startups. The interview question and answer sessions were mainly focused on understanding work issues that arise during the development cycle. Their voices collectively con-tributed to pick one of the available core issues, that also sounded feasible for the scope of this research. The product manager, ERP system devel-oper, and IoT application developer were few discrete profiles among all the interviewees. A quick apprehension on these interviews are summarized in Appendix A.2 and in figure 3.3.
Experts interview
The VR industry is growing at a greater speed and in broad directions. The experts from the VR community were interviewed to understand the ongo-ing collaboration between IoT and VR technologies, concept creation for VR prototype, and current practices to design VR application. In addition, the main goals were to familiarize with the established ways of a VR design cy-cle and understand the possibilities of virtual reality in enterprise solutions. This research could also act as an opportunity for networking companies, to explore the impact of new technologies and product benefits related to inter-net of things. To gain more knowledge about different fields and applications related to extended reality, specialists from disparate areas were also inter-viewed. One of the interviewee's was an IoT data visualization expert who
specializes in understanding IoT data and creating appealing dashboards.
3.1.4
Preliminary analysis
Data was gathered and coded into transcripts utilizing online and offline solutions. The qualitative data was further separated into an orderly fashion using post-it notes. They were grouped on the basis of a similar pattern. In qualitative research, two main data analysis methods according to Bergman and Johansson (2017), are generation of theory and confirmation of theory. Since the aim of the analysis was to explore different possibilities related to UX, IoT and VR fields, the confirmation of theory method was chosen. This method allowed to find the evidence and support for a predefined hypothesis. A small sneak peek can be observed in figure 3.4.
Key information from literature study and interviews were gathered on real-time board (which is a web-page platform) and analyzed via post-it notes. This scanning helped to review the core concepts, challenges, and opportunities that sounded relevant and feasible for the prototype. The data source were associated together by the principles learned from literature section 2, the industry's outlook (AppendixA.2), and difficulties of developers
(AppendixA.2). This helped to formulate the core topic of the prototype. In regards to the analysis of data gathered after prototype test, Hevner (2004) guidelines were referred. The influence of the prototype can be rigor-ously indicated by well-executed descriptive evaluation method as supported by Hevner. Since detailed scenarios for the VR prototype were constructed to exhibit it's utility, descriptive method was applied. After gathering data
from the user tests, qualitative approach was applied to analyze the data. Hence, conclusions were drawn from the insights constructed during the anal-ysis process.
Figure 3.4: Snapshot of analysis of stakeholder interview
3.2
Prototype implementation
To evaluate the presumption explained in previous section 3.1, a single sce-nario was selected from several IoT based applications available in health industry. This section represents the design iterations and development pro-cess of constructing a VR prototype. The iterations were based on feedback received from pilot users and domain experts accumulated in the period of several prototype tests. This approach includes concept creation, sketching, Lo-Fi prototyping, and other technical settings required for running a VR prototype. The main focus of this implementation procedure was to get real time feedback on 3D visualizations and to evaluate how it enlightens one's knowledge.
For the scheme of this prototype, a single-way data gathering route of an indoor air quality measuring system was tested. The prototype was built with the support of Mixed Reality (MR) Hub which is a group of researchers situated in the University of Helsinki. The MR Hub provides a platform ser-vice which is known as MRS Studio. The platform enables non-programmers to get started with 3D modelling and customize VR environment. Based on the concept and elements created in Sketch subsection 3.2.2, the prototype was further developed and reiterated with pilot users.
Software and apparatus used
The software used to project 3D space was SteamVR running on Microsoft windows operating system. The prototype was developed on Unreal Engine 4th version. In addition, Gamebar from Microsoft was used to capture videos, screen-shots on 2D desktop. These clips actually captured the in-space of virtual environment which was also projected on 2D desktop.
The HTC Vive developed by HTC and Valve Corporation was utilized as VR headset for the prototype. The Vive controllers consist of four buttons including a trackpad, grip buttons, and triggers. The controllers can be used for six hours once charged in plenty. The controllers can target to any point withinroom scale with the help of a tracking system. The HTC Vive headset, along with SteamVR provides this tracking system. This allows the user to move free and interact with the VR space. The input sources for VR space could be through video, data, and bluetooth.
3.2.1
Concept creation
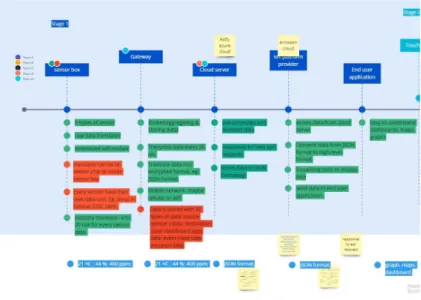
The concept of visualizing the system components and its flow addressed diverse key points during the process. The lessons from Lavalle (2016) were considered while ideating the concept for VR environment. The IoT sys-tem is a collection of networks, devices, and digital machines at numerous different level. In order to design a simplified version of this system, the-oretical background and revelation from developers were analyzed. During the literature study, three case studies were highlighted, namely, IoT smart water management system, air traffic management system and indoor air quality (IAQ) system. The figure 3.5 is a snapshot of flow of IoT process with positive and negative points of every component.
Based on available resources, experts guide and time constraint, IAQ system was considered for prototype. As shown in the picture 3.6, first all the components were modelled and then exported to virtual space. Initially, the main components were placed inside the VR space. The order of the components reflected the order from the blueprint. After fixing the positions of the components, 3D texts were added. The location of 3D texts were adjusted with reference to corresponding 3D model. Followed by, arrows and other minor models to complete the flow.
This allowed to consider the key features of the system from start, ex-plore the relationship between the components and identify the role of data at each phase. All these features were dotted down as requirements list (as shown in figure 3.7) and placed in a flowchart to match with the functions of corresponding components. For instance, indoor air sensors holds many
Figure 3.5: Flow of IoT context
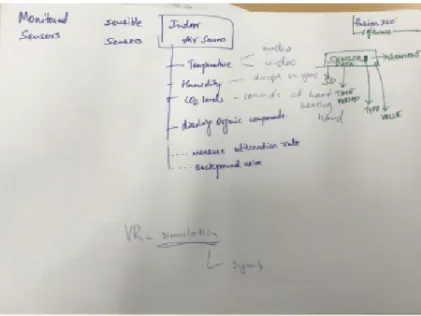
sensors together like temperature sensor, humidity sensor, carbon dioxide (CO2) levels, dissolving organic compounds, measure utilization rate, and background noise. For this specific prototype, we considered only the four key indoor environmental parameters, namely relative temperature and hu-midity, particulate matter (PM 2.5), volatile organic compounds (VOCs), and CO2. The data regarding four key parameters were referred from the ar-ticle - Sensirion Inc (2017) and their ideal values to indicate good air quality was considered from the Finnish Institute of Occupational Health (FIOH), so as to follow the industry standards.
Figure 3.7: Requirement list for the prototype content
3.2.2
Sketch
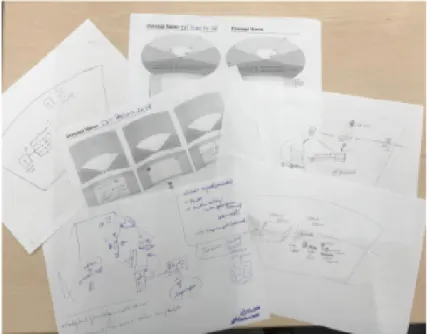
After analyzing individually, all the components and phases were sketched on paper. The aim was to find optimal visual for 3D space as compared to existing 2D visual model. The drawings reflected similar ideas on the functionality of every element when visualized on 2D/3D plane but they were discrete in their visuals. After the most desirable 3D models were chosen, a storyboard was gradually created on VR sketch sheets McCurley (2016). Key indicators for the actual content were emphasized during the process. A snapshot is shown in figure 3.8.
After the storyboard creation, the IoT system was unfolded in a low-level proof-of-concept prototype. This process also sparked the capabilities of unreal engine as compared to Unity technologies. One of the benefits, of using unreal engine is its potential to render photo realistic images in real time and blueprint features. This helped to create interactions within the engine platform, which allowed advance optimization for VR and inculcate rapid prototyping method. Running 3D environments are more intuitive way than rendering 2D images as they were more interactive and accessible. For developers, unreal engine stands for game-developing engine whereas for designers, it is a tool to design and create interfaces.
In regard to the prototype, the 3D texts were added to introduce the sections and key functions behind the components. The intention was also to provide navigation using low level indicator if the user felt lost inside the