A simple method to assess walkability around metro
stations
Khaled Shaaban*, Abdalla Siam, Ali Badran
and Mohammed Shamiyah
Department of Civil Engineering, Qatar University,
PO Box: 2713, Doha, Qatar Email: kshaaban@qu.edu.qa
Email: 200102525@student.qu.edu.qa Email: 200601338@student.qu.edu.qa Email: ms080730@student.qu.edu.qa *Corresponding author
Abstract: The ability to walk or ride a bike safely to and from metro stations is essential to the success of any metro service, especially for car users switching to the service. The main purpose of this study is to develop and apply a simple method to assess, compare, and rank walkability around different metro stations, with a priority order and specific recommendations for improvements. The proposed method depends on extracting different walkability variables in the catchment areas around metro stations. Three catchment areas around three proposed metro stations in the emerging city of Doha, Qatar were investigated using the proposed method to demonstrate its usefulness. The method was successful in comparing and ranking the different catchment areas, in addition to identifying priority areas for walkability enhancements in each area. This method is simple and can benefit professionals, practitioners, and policy makers to make swift decisions for future corrective measures, and can also be used to evaluate changes over time.
Keywords: transit-oriented development; TOD; public transportation; transit stations; urban design; bus stations; accessibility; urban communities; walkability; metro stations.
Reference to this paper should be made as follows: Shaaban, K., Siam, A., Badran, A. and Shamiyah, M. (2018) ‘A simple method to assess walkability around metro stations’, Int. J. Sustainable Society, Vol. 10, No. 1, pp.1–19. Biographical notes: Khaled Shaaban is an Associate Professor in the Department of Civil Engineering at Qatar University. He received his PhD in Civil Engineering from the University of Central Florida. He is a Registered Professional Engineer and a Professional Traffic Operations Engineer in the United States. He has been a principal investigator or co-principal investigator for many research projects. The outcomes of these projects include numerous published papers and presentations on a variety of transportation engineering topics.
Abdalla Siam has obtained his Bachelor and Master degrees from Qatar University in 2007 and 2018. Currently, he is working as a Senior Traffic Engineer at the Ministry of Transport and Communications. He manages and coordinates ongoing studies and strategic planning projects and assesses the
impact of the development projects on the transport network. In addition, he is involved in the development of the roadway design schemes as well as the planning of the public transport network in coordination with the relevant stakeholders.
Ali Badran has obtained his Bachelor and Master degrees in Civil Engineering from Qatar University in 2009 and 2017. Currently, he is working with the Public Works Authority as a client representative. He seeks and obtains all the required approvals and permits for all aspects of the design and construction programs. He ensures that all technical standards, policies, and procedures are adhered to during the process of obtaining the approval and permits.
Mohammed Shamiyah has obtained his Bachelor degree in Civil Engineering from Qatar University in 2012 and is currently enrolled in the Master program and expected to graduate in 2018. Currently, he is working with the Public Works Authority. He assists the contractors in relations with government authorities and third parties as a client representative, implements factory acceptance tests to ensure factories and products are meeting Ashghal requirements, attends inspections and safety walks on site, reviews road design submissions and temporary traffic management plans.
This paper is a revised and expanded version of a paper entitled ‘A simple method to assess walkability around metro stations’ presented at the Transportation Research Board 96th Annual Meeting, Washington, DC, January 2017.
1 Introduction
Access to the metro stations is extremely important for the success of any rail-based transport system and will play a major role in shaping the future of the use of the metro system, especially in areas with high potential of travellers, dense housing, high number of workplaces and attractions in addition to shopping areas, sports facilities, and entertainment areas. Most of the travellers in public transport systems come from areas in the vicinity of the station. These areas are called the catchment areas and can be defined as the vicinity of a station of public transportation where most of the transferring passengers at the station come from. Thus, the streets surrounding the transit stations must support multiple transportation modes such as buses, pedestrians, and bicyclists from different principles for all users (Landex et al., 2006).
Applied analysis of catchment areas for public transport can serve different purposes. They are usually used in the planning process of new public transportation services. Catchment area analysis can serve in the initial phase when the stop has to be placed on a new line. More detailed catchment area analyses can be used to investigate improvements in the accessibility of stations. Such improvements result in a transit-oriented development (TOD). TOD is a development design with the main goal of promoting walking, biking, and the usage of transit as feasible transportation choices in a neighbourhood. TODs play a major role in increasing the transit ridership. This case happens when more people switch to transit, especially car-users, which will reduce the
number of vehicle miles, promote healthier behaviour, and reduce congestion and greenhouse-gas emissions. This switch will also result in significant savings for the car-users due to not using their private car for transportation (Belzer and Autler, 2002) in addition to healthier habits and improvement in obesity and other health problems (Lovasi et al., 2012).
Research showed that TOD oriented neighbourhoods have less traffic congestion compared to other neighbourhoods (Cervero and Arrington, 2008). Studies also showed that the best method of assessing TODs is to evaluate the walkability in these neighbourhoods (Belzer and Autler, 2002; Calthorpe, 1993; Schlossberg and Brown, 2004). This type of assessment is understandable because improving walkability in a neighbourhood provides pedestrians with better access to the transit stations. This improved access would encourage more people to use transit in return. Research also showed that improving walkability can also encourage pedestrians to walk to transit stations from a cost-benefit point of view (Park et al., 2015).
In order for TODs to be successful, walking and biking are encouraged within a quarter or a half a mile from the transit station (Bernick and Cervero, 1997; Calthorpe, 1993). This is the same concept used in public health research where walking conditions are improved for pedestrians to reach the different amenities in a neighbourhood by walking. In this type of research, a walking score is used to measure walkability and accessibility in a neighbourhood (Lee et al., 2013). In some cases, it is also used as a factor to compare the accessibility of a house when buying real estate (Pivo and Fisher, 2011). This study is mainly focused on investigating the connectivity of sidewalks and the walking environment in the catchment areas around the three upcoming metro stations in the city of Doha, Qatar.
1.1 Doha metro network
Qatar, a fast-growing country in the Middle East, is facing an unprecedented challenge to deal with rapid growth within the country constrained by high demand on the existing road network and the high usage of private cars for transportation. The number of vehicles on the road in Qatar has more than tripled between 2000 and 2012. The existing bus service, which is the only public transportation in Doha is limited. A total of 27 internal bus lines run within the city of Doha and 14 external bus lines connect Doha to other remote cities. Bus service frequency varies from 30 minutes to 1 hour, which seldom attracts those on higher incomes to use the bus services. Due to the infamous traffic congestion in Doha, buses often do not arrive at stops on time, particularly during rush hours. Thus, taxis are used more as a means of transportation than buses. To address the fast-growing demand on the transportation network, the Qatari government is currently building the first metro system in Doha. The metro’s first phase is expected to be completed in 2020 to be ready for the Qatar 2022 FIFA World Cup, while the final phase is expected to be completed in 2026. The metro network is designed to link all the major town centres, major commercial and residential areas, Olympic venues, villages, hotel’s district, and the new Doha international airport with four lines and 100 stations with a total length of approximately 360 kilometres (Shaaban and Hassan, 2014).
It is well known that not many people use the public transportation in Qatar (Shaaban and Kim, 2016a, 2016b). To benefit from the new metro service in reducing traffic congestion in Doha, the metro must attract sufficient commuters, including regular transit
users and individuals who have the option of commuting by car. The more people switch to transit, the more benefit it will be to the mobility inside the city. Access to the proposed metro stations is needed to ensure the success of the system under construction. Most of the travellers in public transport systems come from areas just around the station. In order to promote walking and biking, the streets surrounding the transit stations must support different modes including buses, pedestrians, and bicyclists. Therefore, a simple evaluation method was needed to assess, compare, and rank the walkability around these different metro stations.
2 Methodology
The proposed evaluation method used in this analysis focuses on analysing the sidewalks, bike lanes, parking spaces, and bus transit service within the station’s catchment areas. This evaluation will assist in identifying the impact of those elements on the accessibility of the metro stations and consequently proposes any needed improvements. This type of assessment will lead to improvements that can reduce traffic congestion, need for parking, and savings for the users, especially among car users who would be otherwise driving. These improvements if combined with high-quality public transportation can help directing more car users to the use of the metro (Litman, 2011).
In this study, the circular catchment area approach was used, which is based on investigating a catchment area within a circle radius of a half-mile range (800 metres) from the metro stations. This value is the high limit of the range recommended of the quarter to half a mile from the transit station by previous studies (Association, A.P.T, 2009; Bernick and Cervero, 1997; Calthorpe, 1993; Sohn et al., 2012). This approach is the simplest approach and most used compared to the service area approach, which is based on searches in road networks to find the actual feeder routes (Andersen and Landex, 2008).
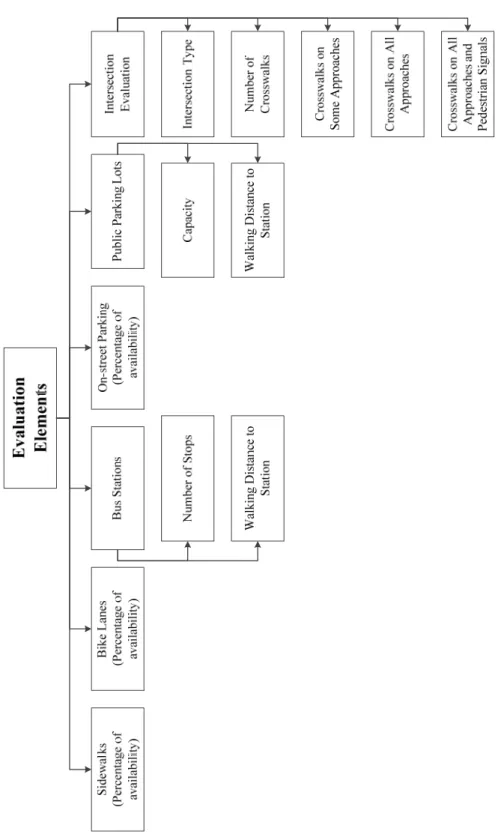
In this approach, the catchment area is split into three different circular levels. The first level is the core station area, which is defined as the direct area around a transit station within which the land use and urban design features have a main effect on the system ridership. In this area, pedestrian’s access generates an extremely significant portion of transit trips to and from the station. The second level is the primary catchment area (200 metres circle around the transit station), which is defined as the area within which the land use, urban design features, and the ease access to the station have a considerable impact on the ridership. In this area, pedestrian access generates a significant portion of transit trips to/from the station. Finally, the third level is secondary catchment area (800 metres circle around the transit station), which is defined as the area around a station within which ease and directness of access to the station have the greatest influence on the ridership. In this area, bike, feeder system, and passenger cars, including taxis are the primary access modes to and from the station. The method developed in this study evaluates the catchment areas based on different criteria including the availability of sidewalk, bike lanes, pedestrian/cyclist friendly intersections, parking spaces, and bus stops. These elements are listed in Figure 1.
2.1 Availability of sidewalks
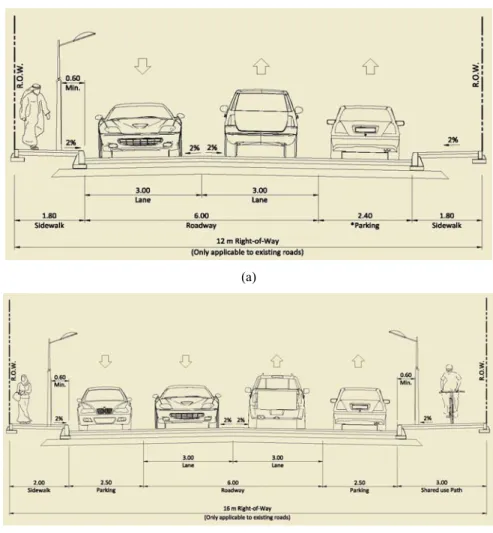
In the proposed method, the availability of sidewalks on a road segment is based on having proper sidewalks available on both sides of the segment. Therefore, for a given length of a road segment, the length of the existing sidewalks should be approximately twice the length of the road segment. This approximation was used to simplify the calculations since the main purpose of the developed method is to compare and rank the catchment areas for different stations. A more detailed method would be to deduct the width of the intersections from the total length of the road segment as the road interrupts the sidewalk at each intersection. The definition of a proper sidewalk in this study was based on having a minimum width of 1.8 metres according to the Qatar Highway Design Manual (MOT, 2015) and as illustrated in Figure 2.
Figure 2 Minimum sidewalks and parking widths for different typical sections, (a) minimum sidewalk width of 1.8 m (b) minimum shared sidewalk width of 3.0 m (see online version for colours)
(a)
(b)
2.2 Availability of bike lanes
The availability of bike lanes on a road segment in the proposed method is based on having proper bike lanes both sides of an existing road. Therefore, for a given length of a road segment, the length of the existing bike lanes should be approximately twice the road segment. A proper bike lane is defined as a dedicated, marked, and properly signed bike lane, a sidewalk that is wide enough to accommodate both the sidewalk and the bike lane, or a wide paved shoulder that, while not marked for bicycles, might serve as a de-facto bike lane. The width of the sidewalk shall not be less than 3.0 metres to be considered as shared sidewalk as illustrated in Figure 2 and per the Qatar Highway Design Manual (MOT, 2015).
2.3 Availability of pedestrian-friendly intersections
All intersections in the catchment areas were evaluated based on four levels, which include:
1 having no crosswalks
2 having crosswalks on some approaches 3 having crosswalks on all approaches
4 having crosswalks on all approaches and pedestrian signals.
For the purpose of this evaluation method, an intersection is considered pedestrian friendly if it has crosswalks on all approaches or had crosswalks and pedestrian signals. 2.4 Availability of bus stations
Only bus stations that are available within the primary catchment area (200 m) from the metro station were considered in this analysis. In the case of having multiple transit bus stations for the same bus lines in the same catchment area, only the closest one to the metro station entrance was considered assuming that the bus passengers will choose to disembark at the closer station. Hence, the calculations omitted the farther bus stations. 2.5 Availability of parking spaces
On-street parking was considered only if the parking was legal and safe to park. Otherwise, it was considered a private parking. For example, parking spaces located in front of residential houses or private properties were not considered in the analysis. Also, existing road shoulders were not considered as on-street parking. Parking spots within local roads that are mainly occupied by the residents of the local road were also not included in the analysis due to the fact that it will be used mainly by the local residents. However, parking spots within main roads were considered as potential parking spots for the metro users. When accounting for the on-street parking, it was assumed that the length of a car parking spot is 6.0 m in length in accordance with Qatar Highway Design Manual (MOT, 2015). It should be noted that on-street parking is available only in the form of parallel parking in the City of Doha. Also, there are no costs or time limits applied to the use of these type of parking spaces.
The availability of public parking lots within the catchment area was also taken into consideration and added to the number of parking spaces. For these public parking lots to be considered in the analysis, the parking lot must be public, properly designed, paved, marked, signed, and designated for general public use. A parking lot that cannot be accessed or is dedicated to a specific use such as a mall or a shopping plaza was not included in the analysis.
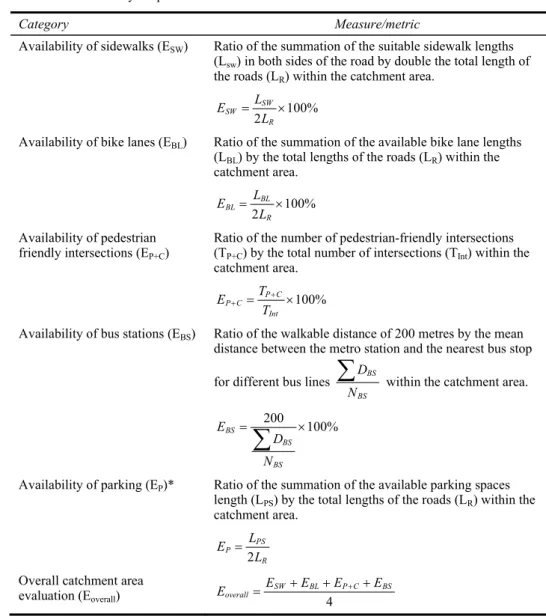
Table 1 Summary of quantitative evaluation of the catchment area
Category Measure/metric
Availability of sidewalks (ESW) Ratio of the summation of the suitable sidewalk lengths (Lsw) in both sides of the road by double the total length of the roads (LR) within the catchment area.
100% 2 SW SW R L E L = ×
Availability of bike lanes (EBL) Ratio of the summation of the available bike lane lengths (LBL) by the total lengths of the roads (LR) within the catchment area. 100% 2 BL BL R L E L = × Availability of pedestrian friendly intersections (EP+C)
Ratio of the number of pedestrian-friendly intersections (TP+C) by the total number of intersections (TInt) within the catchment area. 100% P C P C Int T E T + + = ×
Availability of bus stations (EBS) Ratio of the walkable distance of 200 metres by the mean distance between the metro station and the nearest bus stop for different bus lines BS
BS D N
∑
within the catchment area.200 100% BS BS BS E D N = ×
∑
Availability of parking (EP)* Ratio of the summation of the available parking spaces length (LPS) by the total lengths of the roads (LR) within the catchment area. 2 PS P R L E L =
Overall catchment area
evaluation (Eoverall) 4
SW BL P C BS
overall
E E E E
E = + + + +
Note: *EP is evaluated separately and not included in overall score.
2.6 Overall catchment area evaluation
An assumption was made that each factor should be included equally in the overall evaluation. This assumption may not necessarily represent the overall performance of the
catchment area accurately. Some factors may be more or less important than the others depending on public agency’s preference. This issue should be investigated further in order to provide a realistic evaluation of the catchment area. Areas under construction were evaluated based on the way the road is shaping up to. All formulas used for the calculations are shown in Table 1.
3 Data collection
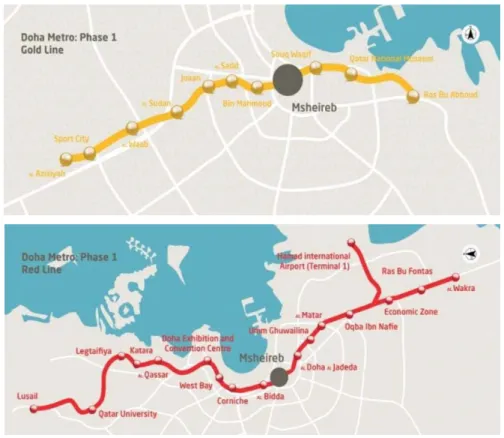
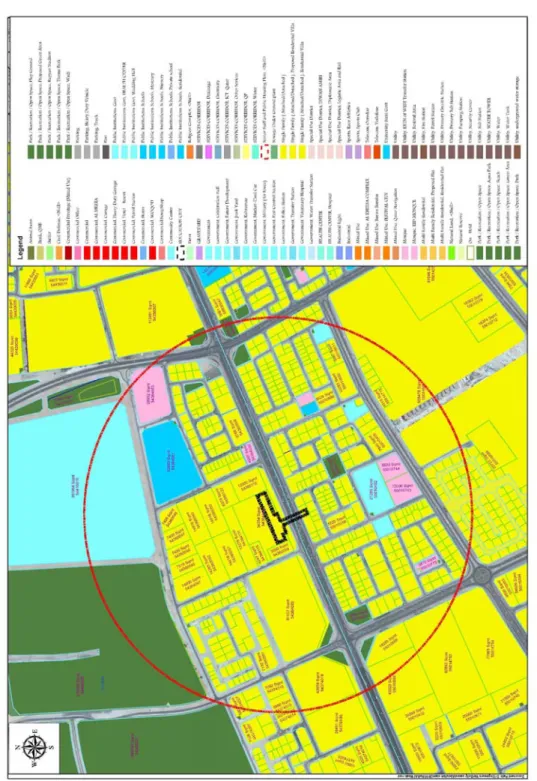
Three catchment areas around three under construction metro stations were selected for the analysis of this study. These stations are Al Waab station, Al Sadd station, and Doha Exhibition and Convention Centre (DECC) station. The Al Waab and Al Sadd stations are located along the golden line, while DECC station is located along the red line as shown in Figure 3. The three stations were selected in a way to cover different types of land use. Detailed land use maps for the three stations are shown in Figure 4. Road names and locations were collected from the Centre of Geographic Information System of Qatar of the Ministry of Municipality and Environment website. Site visits were conducted, and the data was collected and documented in spreadsheets. A summary of the data collected is shown in Table 2. Moreover, Figure 5 shows a sample of the different observations collected in the field.
Figure 3 Location map for studied catchment areas (see online version for colours)
Sour c e : C e nt re o f G e ogr a phi c Inform a ti o n S y st e m a nd M ini st ry of M uni c ipa li ty a nd E nv ir onm e nt
Sour c e : C e nt re o f G e ogr a phi c Inform a ti o n S y st e m a nd M ini st ry of M uni c ipa li ty a nd E nv ir onm e nt
Figure 4 Existing land use maps for the catchment areas (continued) (see online version for colours)
Source:
Centre of
Geographic Information System a
nd Ministry of
Munici
pality and Environmen
3.1 DECC station
This metro station is located in a densely developed area. The land use is mainly office towers, residential towers, hotels, commercial buildings, exhibition centre, schools, and mixed-use buildings. This area is considered the Central Business District of Doha. Most of the roads and infrastructure within the catchment area of the DECC station are newly constructed. These roads have sufficient and proper sidewalks. In the majority of the roads, the sidewalk is wide enough to accommodate both sidewalk and bike lanes. The sidewalk is connected through proper crossings at the intersections. The area is served by a shuttle bus service that covers most of the catchment area. The area also many public parking lots located near the station. These parking lots may encourage the ridership of the metro station, as many of the drivers will be encouraged to park their vehicles and use the metro.
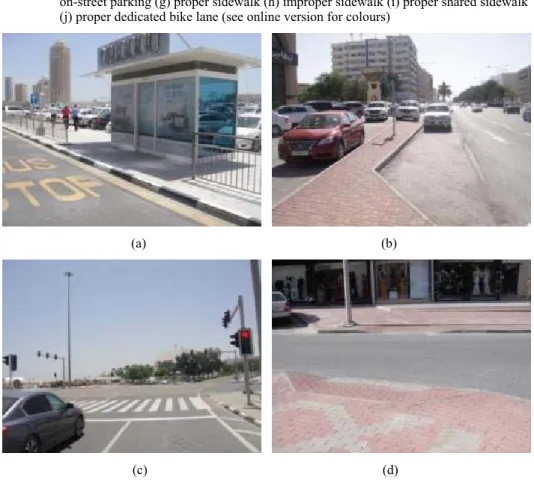
Figure 5 Sample pictures from site observations, (a) proper bus stop (b) improper bus stop (c) proper crossing (d) improper crossing (e) proper on-street parking (f) improper on-street parking (g) proper sidewalk (h) improper sidewalk (i) proper shared sidewalk (j) proper dedicated bike lane (see online version for colours)
(a) (b)
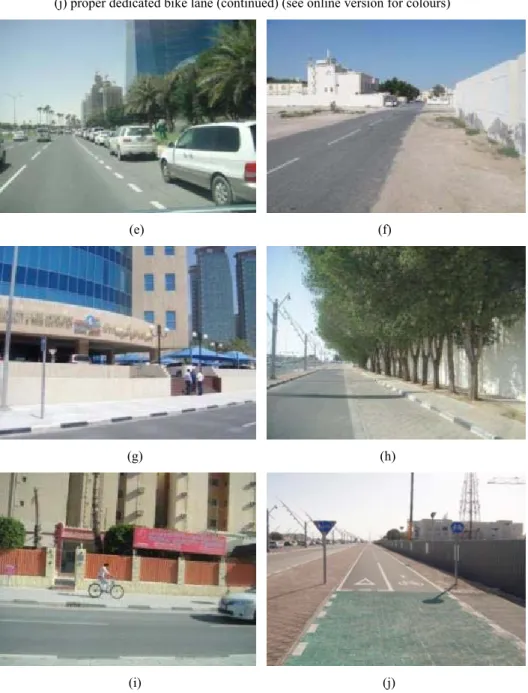
Figure 5 Sample pictures from site observations, (a) proper bus stop (b) improper bus stop (c) proper crossing (d) improper crossing (e) proper on-street parking (f) improper on-street parking (g) proper sidewalk (h) improper sidewalk (i) proper shared sidewalk (j) proper dedicated bike lane (continued) (see online version for colours)
(e) (f)
(g) (h)
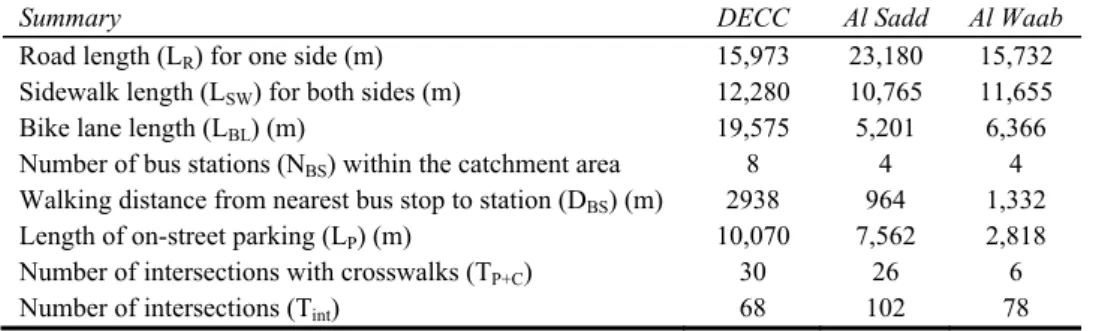
Table 2 Data collection summary
Summary DECC Al Sadd Al Waab
Road length (LR) for one side (m) 15,973 23,180 15,732 Sidewalk length (LSW) for both sides (m) 12,280 10,765 11,655
Bike lane length (LBL) (m) 19,575 5,201 6,366
Number of bus stations (NBS) within the catchment area 8 4 4 Walking distance from nearest bus stop to station (DBS) (m) 2938 964 1,332 Length of on-street parking (LP) (m) 10,070 7,562 2,818
Number of intersections with crosswalks (TP+C) 30 26 6
Number of intersections (Tint) 68 102 78
3.2 Al Sadd station
The land use around the Al Sadd station has office buildings, multi-family residential buildings, hotels, commercial buildings, mixed-use buildings, and schools. The area is densely developed, and most of the local roads are old and designed without accommodating sidewalks, bike lanes or parking. Most of the major intersections have proper signalised crossings. However, the minor intersections were not properly designed or constructed to accommodate the pedestrian/cyclist crossings. The station area is partially covered with bus service. The majority of the bus stops are poorly designed. Most of the main roads had on-street parking. However, most of the local roads are too narrow and were not proper to accommodate on-street parking.
3.3 Al Waab station
The land use around the Al Waab station is mainly single-family residential buildings, shopping areas, and schools. This station has a direct connection with Al Waab Street, which is well-designed and constructed. This road has dedicated and continuous bike lanes and sidewalks on both sides of the road. The continuity of the sidewalk and the bike lanes is maintained through signalised crossings at all the signalised intersections. On-street parking is available and properly designed along Al Waab Street. Several bus stops are located along around the station. The major intersections in the catchment area are properly designed to accommodate pedestrians and cyclists’ movement. Other than the main streets, most of the local roads did not have sidewalks, bike lanes, or on-street parking and the intersections are designed to handle pedestrian and cyclist.
4 Results
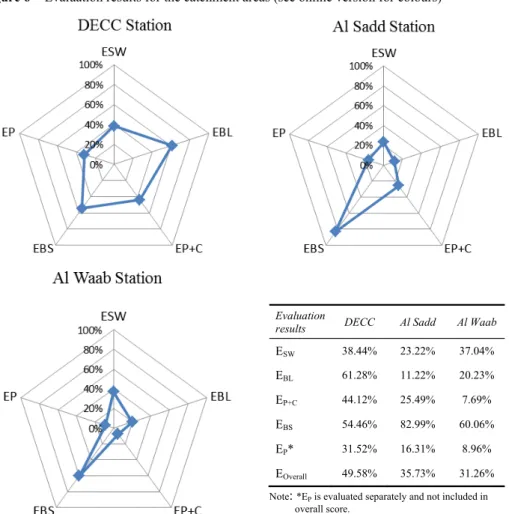
Using the formulas listed in Table 1, it is evident that both Al Sadd and Al Waab stations scored lower than the DECC station for the set evaluation criteria. The sidewalks and
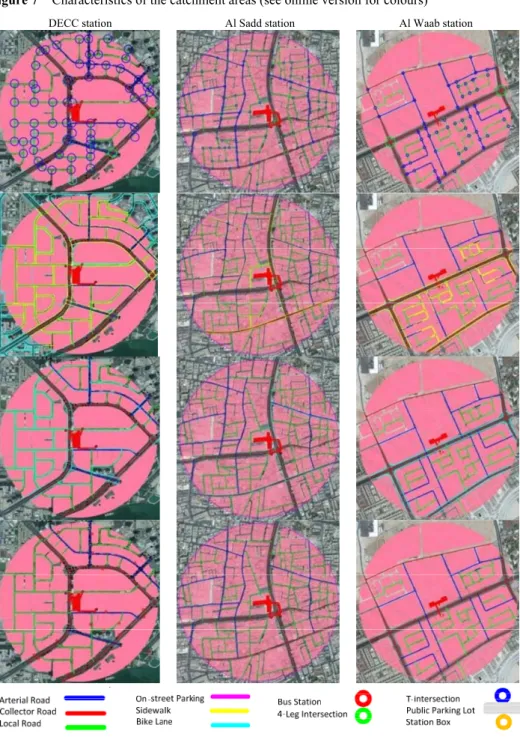
bike lanes were unavailable in most of the roads in both catchment areas. Most of the intersections did not have proper crossings, which result in a lack of connectivity. The DECC station has shown better scores since most of the roads within the catchment area are newly constructed. Proper and wide sidewalks that can easily accommodate bike lanes are available in this catchment area. In addition, the area is served by a shuttle bus service. In the overall evaluation, it is not the case when one catchment area scores well in one category means that it will score well compared to the other catchment areas. A balance between the different categories is needed in order to have a high score. Figure 6 shows the strength and weakness of each catchment area. To achieve a better understanding of these rankings, a visual-spatial analysis is shown in Figure 7. The GIS-derived maps give a visual analysis of the different studied elements, which makes it easier to identify locations with problems and areas in need of improvements.
Figure 6 Evaluation results for the catchment areas (see online version for colours)
Evaluation
results DECC Al Sadd Al Waab
ESW 38.44% 23.22% 37.04% EBL 61.28% 11.22% 20.23% EP+C 44.12% 25.49% 7.69% EBS 54.46% 82.99% 60.06% EP* 31.52% 16.31% 8.96% EOverall 49.58% 35.73% 31.26%
Note: *EP is evaluated separately and not included in
Figure 7 Characteristics of the catchment areas (see online version for colours)
5 Conclusions
In this study, a simple method was developed to assess walkability around metro stations. The data for three catchment areas around three metro stations under construction in the city of Doha were collected and used to evaluate the proposed method. The data included information regarding intersections, sidewalks, bike lanes, bus stations, and parking availability. The method is simple, fast and was effective in evaluating and ranking the studied locations. Although the proposed method assigned the same weight for all walkability elements, the method can easily be modified to assign different weights to different elements as needed.
This type of assessment can be useful for urban designers, planners, transportation professionals, as well as policy makers and practitioners. It can help identify priority areas for improvement and track changes and over time. Moreover, it can be used to investigate policies, develop funding plans, and discuss options with stakeholders to promote safe walking and bicycling around transit stations. Furthermore, this method can be useful in conducting a fast, simple evaluation during the planning phase of any proposed transit station to assist with selecting the best location for walking and biking activities.
It is important to note that this study has limitations that could be possible avenues for future research. One of them is related to focusing on the availability and not the condition of the different elements. For example, the condition of sidewalks was not taken into consideration. Cracks, broken sections, and debris can impact the usage of sidewalks. Similarly, the significance of one side of the sidewalk over the other was not studied. The sidewalk on the side of the metro station entrance might be more important than the other side. In addition, special conditions such as shared zones (pedestrians, cyclists, and vehicles share the same road space) or shared lanes (cyclists and vehicles share the same road space) should be considered and investigated. Also, the analysis of parking did not include the cost and time limits that may be applied to parking spaces, since they do not currently exist in the city of Doha for off-street parking (Shaaban and Pande, 2016). These factors should be accounted for if available.
The proposed method focused on identifying infrastructure issues as impediments to the use of walking, biking, and public transportation. However, the impact of additional factors such as population, density, and land use of the catchment area should also be considered as they play a major role in the success of TODs. Furthermore, it will useful in the future to link the developed walkability evaluation index with other performance measures such as station ridership or percentage of people in the area using public transit. Finally, the method did not consider the impact of weather on walkability in the catchment areas, which should be accounted for in future research. The weather in the city of Doha is hot, especially during summer where the average daily temperature can reach 50 ºC or more, with high humidity. Previous studies in the city showed that weather has a significant impact on pedestrian volumes (Shaaban et al., 2017a, 2017b). Given the high level of comfort in a private vehicle versus the walking alternative, this factor may impact efforts to induce a person to walk.
References
Andersen, J.L.E. and Landex, A. (2008) ‘Catchment areas for public transport’, WIT Transactions
on the Built Environment, Vol. 101, pp.175–184, Urban Transport XIV, ISSN 1743-3509,
doi:10.2495/UT080171.
Association, A.P.T. (2009) Defining Transit Areas of Influence, Washington DC, American Public Transportation Association.
Belzer, D. and Autler, G. (2002) Transit Oriented Development: Moving from Rhetoric to Reality, Brookings Institution Center on Urban and Metropolitan Policy, Washington, DC.
Bernick, M. and Cervero, R. (1997) Transit Villages for the 21st Century, McGraw-Hill, New York, ISBN-10: 0070054754, ISBN-13: 978-007005475.
Calthorpe, P. (1993) The next American Metropolis: Ecology, Community, and the American
Dream, Princeton Architectural Press, New York.
Cervero, R. and Arrington, G. (2008) ‘Vehicle trip reduction impacts of transit-oriented housing’,
Journal of Public Transportation, Vol. 11, No. 3, p.1.
Landex, A., Hansen, S. and Andersen, J.L.E. (2006) ‘Examination of catchment areas for public transport’, Proceedings of the Annual Transport Conference, Aalborg University, Trafikdage, Denmark.
Lee, S., Lee, S., Son, H. and Joo, Y. (2013) ‘A new approach for the evaluation of the walking environment’, International Journal of Sustainable Transportation, Vol. 7, No. 3, pp.238–260. Litman, T. (2011) Evaluating Accessibility for Transportation Planning, Victoria, BC, Victoria
Transport Policy Institute.
Lovasi, G.S., Grady, S. and Rundle, A. (2012) ‘Steps forward: review and recommendations for research on walkability, physical activity and cardiovascular health’, Public Health Reviews, Vol. 33, No. 4, p.484.
MOT (2015) Qatar Highway Design Manual in Ministry of Transport, Qatar.
Park, S., Choi, K. and Lee, J.S. (2015) ‘To walk or not to walk: testing the effect of path walkability on transit users’ access mode choices to the station’, International Journal of
Sustainable Transportation, Vol. 9, No. 8, pp.529–541.
Pivo, G. and Fisher, J.D. (2011) ‘The walkability premium in commercial real estate investments’,
Real Estate Economics, Vol. 39, No. 2, pp.185–219.
Schlossberg, M. and Brown, N. (2004) ‘Comparing transit-oriented development sites by walkability indicators’, Transportation Research Record: Journal of the Transportation
Research Board, Vol. 1887, pp.34–42.
Shaaban, K. and Hassan, H. (2014) ‘Modeling significant factors affecting commuters’ perspectives and propensity to use the new proposed metro service in Doha’, Canadian
Journal of Civil Engineering, Vol. 41, No. 12, pp.1054–1064, DOI: 10.1139/cjce-2013-0595.
Shaaban, K. and Kim, I. (2016a) ‘Assessment of the taxi service in Doha’, Transportation
Research Part A: Policy and Practice, Vol. 88, pp.223–235, DOI: 10.1016/j.tra.2016.04.011.
Shaaban, K. and Kim, I. (2016b) ‘The influence of bus service satisfaction on university students’ mode choice’, Journal of Advanced Transportation, DOI: 10.1002/atr.1383.
Shaaban, K. and Pande, A. (2016) ‘Classification tree analysis of factors affecting parking choices in Qatar’, Case Studies on Transport Policy, Vol. 4, No. 2, pp.88–95, DOI: 10.1016/j.cstp. 2015.11.002.
Shaaban, K., Muley, D. and Elnashar, D. (2017a) ‘Evaluating the effect of seasonal variations on walking behaviour in a hot weather country using logistic regression’, International Journal of
Urban Sciences, pp.1–10 [online] https://doi.org/10.1080/12265934.2017.1403363.
Shaaban, K., Muley, D. and Elnashar, D. (2017b) ‘Temporal variation in walking behavior: an empirical study’, Case Studies on Transport Policy, Vol. 5, No. 4, pp.671–680.
Sohn, D.W., Moudon, A.V. and Lee, J. (2012) ‘The economic value of walkable neighborhoods’,