Measurement the marketing performance for the Jordanian
pharmaceutical companies by using Balanced Scorecard
1.,Wanas abdelkareem wanas hindawi, Marketing department, Isra university, P.O Box 22, code 11622,Amman – Jordan. E-mail: wanashindawi@hotmail.com,
2. Khaled,K,zureikat,Management information system department, Isra university, P.O Box 22, code 11622 ,Amman – Jordan. E-mail: kzreqat@yahoo.com
Abstract
This study aimed to try to determine the relationship between the application of Balanced Scorecard axes, the focus of stakeholders and beneficiaries, and internal processes and procedures, education and development, innovation, and finally return on investment, finance, and marketing performance of the pharmaceutical industry in Jordan.
To achieve the objectives of the study and test hypotheses soft sample was withdrawn from the study population was composed of all workers in the pharmaceutical industry operating in Jordan for the year 2010, reaching 200 elements.
The study found a number of results highlighted that there are weaknesses in the application of the pharmaceutical industry Jordanian activities that reflect the interests and aspirations of the target customers may impact negatively on the performance catalog for these companies, and this side of weakness in refining services provided to external audiences in terms of accuracy and speed, and apply result also the focus of innovation and invention. The financial aspect of these companies, shows that they fully applied when setting goals and financial needs, which has a significant impact in stimulating and activating the catalog performance of these companies.
The study recommended finally the need to take advantage of the Balanced Scorecard in the activation of the strategic plans for private pharmaceutical companies, public and private sector, seeking to formulate objectives in the form of specific results quantifiable.
Keywords: marketing, marketing performance, balance scorecard.
1. Introduction:
Measuring performance is one of the trends of modern management through which all the institutions and organizations of different objectives and activities are studied, with the fact that it is done in accordance with a set of criteria to be used for this purpose; measuring the performance of the pharmaceutical companies and extracting indicators of this performance is important to judge the level of productivity and effectiveness of these organizations in completing their tasks and jobs, it reflects the effectiveness of this performance and its efficiency in the implementation of plans and programs in these organizations, and its primary objective is reflected in improved performance and increased productivity while being elevated by it so that they can carry out their duties to the fullest.
The success of measuring the performance of organizations is based on standards that are referenced when needed to enhance the performance of the organization, or to find out the course of action, and to determine the size of the deviation in the actual performance of what is desirable, determining its strengths and weaknesses, and to extract indicators that reflect the level of this performance, which vary depending on the activity of the organization and its objectives, and organizations with agricultural activity vary in the performance criteria and its indicators from the industrial, commercial, educational, or banking organizations.
2. Problem of the Study:
The study tries to answer the following questions:
1. What is the relationship between the application of the stakeholders and beneficiaries standard and the marketing performance of Jordanian pharmaceutical companies?
2. What is the relationship between the application of the standard of internal processes and procedures and the marketing performance of Jordanian pharmaceutical companies?
3. What is the relationship between the application of the standard of education, development and innovation of human resources and the marketing performance of Jordanian pharmaceutical companies?
4. What is the relationship between the application of the standard of investment and financial returns and the marketing performance of Jordanian pharmaceutical companies?
5. What is the relationship between the concept of the a Balanced Scorecard and the demographic characteristics of workers (size, market share, size of the profits).
3. Objectives of the study:
This study identifies the following:
1. Determine the relationship between the application of the stakeholders and beneficiaries standard and the marketing performance of Jordanian pharmaceutical companies
2. Determine the relationship between the application of the standard of internal processes and procedures and the marketing performance of Jordanian pharmaceutical companies
3. Determine the relationship between the application of the standard of education, development and innovation of human resources and the marketing performance of Jordanian pharmaceutical companies 4. Determine the relationship between the application of the standard of investment and financial returns and
the marketing performance of Jordanian pharmaceutical companies
3.1 The importance of the study:
The importance of the study was identified through the following:
1. Limitations of studies conducted to measure the impact of the application of Balanced Scorecard criteria on the marketing dimension in industrial companies.
2. Importance of feedback provided by this study for all businesses interested in measuring their performance. 3. Feedback provided by this study to government decision-makers working in these organizations about the
reality of government performance and how to take advantage of the findings.
3.2 Study theories:
To complete the objectives of the study, the following theories were phrased:
Ho1: There is no statistically significant relationship between the application of the stakeholders and beneficiaries’ standard and the marketing performance of Jordanian pharmaceutical companies
Ho2: There is no statistically significant relationship between the application of the standard of internal processes and procedures and the marketing performance of Jordanian pharmaceutical companies
Ho3: There is no statistically significant relationship between the application of the standard of education, development and innovation of human resources and the marketing performance of Jordanian pharmaceutical companies
Ho4: There is no statistically significant relationship between the application of the standard of investment and financial returns and the marketing performance of Jordanian pharmaceutical companies
3.3 Previous studies:
The aim of the study of both researchers (Qahtani and Al Nsour, 2009) entitled “Measuring the performance of Saudi Arabian governmental organizations : An Empirical Study on some governmental departments in the province of Al-Kharj”, was to identify the level of performance of governmental departments in the Kingdom of Saudi Arabia through the application of the criteria used in the axes of the Balanced Scorecard.The study found that 74.7% of indicators that reflect the interests and needs of the beneficiaries of governmental services in the province are already available, 68% of the indicators that reflect the processes and procedures within those departments are already available, and found that 43.7% of the departments involved have indicators that reflect the creativity, development and qualification of human resources, additionally, 30.7% of governmental departments apply financial indicators
that are related to its strategic objectives.The study recommended a series of recommendations that are believed to be important in the development process of measuring governmental performance and improving the use of the Balanced Scorecard in non-governmental organizations working in Saudi Arabia.
However, The study of the researcher (Zureikat, 2008) entitled "Balanced Scorecard in Jordanian industries" was I ntended to understand the Balanced Scorecard in the Jordanian Industrial Companies, by knowing how to use the card in these companies, and by studying a range of internal and external factors affecting the use of the Balanced Scorecard, and these factors were: the company's strategy, organizational structure, the external environment, the degree of competition in the markets, and the size of the company. The results showed that there was considerable support in the implementation of the Balanced Scorecard in the Jordanian industrial companies. The results also showed that the organization of administrative procedures and the size of the company have a positive affect on the use of the Balanced Scorecard, as the central strategy of the company and the external environment and the degree of competition does not have a positive impact on the use of the Balanced Scorecard. Finally, the study recommended directing researchers to study other areas in Multi Balanced Scorecards, and the possibility of more expansion in its applications, focus and benefits of its use.
A study (Shibley, 2005) which has implemented the idea of Balanced Scorecard on the commercial banking sector in Iraq, and the importance of this panel and its various dimensions to provide the strategy of the organization with the information that it needs, it also organized the flow of information within four integrated dimensions that depend on each other, and they were: financial, customer, internal processes, learning and growth, as well as to help them to manage the organization to overcome some of the conventional problems facing the Organization, namely: the problem of the time spent between planning processes and the need for information, the problem of lacking language and understanding between business executives and officials about information systems in the Organization. The study found that the management of commercial banks in Iraq lacks the information of environmental analysis, which forms an important basis in the organization's strategic direction, and a model diagram was developed according to the work of the card, which helps those banks in the formulation and implementation of an effective strategy to control the balance between the strategic orientations of the bank and the evolution of its operations . Another study (Abu El Enein, 2004) entitled "Assessment of institutional performance for Egyptian governmental organizations as a prelude to the administrative development" Adds the most important metrics used to measure governmental performance in Egyptian organizations, where it showed that the process of evaluating corporate performance is characterized by movement, continuity, flexibility and integration, it also used a number of standards for measurement and comparison, which are on the basis of which determine the extent of progress to achieve the desired goal. The study found that the most important challenges facing the performance evaluation in Egypt are the following: Variety and opposition of objectives within organizations, the spread of governmental routine, the absence of effective control, and political pressures. The study suggested some strategies that reduce these difficulties: the need for a radical change in the administrative thinking of individuals working in organizations, in the training of state employees, to rely on transformational training between professions and disciplines, to simplify the procedures of services provided by the governmental agencies to the public, and the need to change the philosophy adopted by the government on different sectors by considering it as service or investment sectors, also, a model has been proposed for evaluating the performance of government units using the data and information available on the performance of the Department of Real Estate Registration and Documentation (known by that name in Egypt); to identify the importance of relying on the mentioned models in the implementation of performance evaluation processes in general or not.
And at the level of Foreign Studies, the study (Vanderzee et al, 1999) entitled "Alignment Is Not Enough: Integrating Business & Information Technology Management With The Balanced Score", revealed the significant contribution provided by the Balanced Scorecard (BSC) idea in the implementation of integration and consistency between the plans linked with information systems and the process of evaluation plans, and that means, achieving effective integration between the data of the information system over the need of the organization's management for information. While it was clear from the study (Rousseau et al, 2000) entitled "Turning Strategy Into Action In Financial Services" the compatibility between the Balanced Scorecard and performance management, provides an advantage that lies in the speed of the increase in the financial performance of the organization as well as the speed to turn the strategy into reality and to be entered into implementation.
While the study (Bulter et al, 1997) titled "Linking The Balanced Score Card To Strategy" has attempted to review and critique the original idea of the Balanced Scorecard brought by both Kapaln & Norton, which divided the study into two main sections: the long-term strategy on one hand, and principles that realize the connection between standards and the way they lead the organization on the basis of its business. The principles included each of the following: clients, people, innovations, operations, performances, suppliers, and the community. The study relied on three major dimensions of the card, and they are: Shareholders , extraordinary growth, and continuous development.
While the study (kaplan & Norton, 1992) entitled "The Balanced Score Card Measures That Drive Performance" focuses on the development of the Balanced Scorecard performance that follows a strategy for the organization starting from the continuous development, participation, working human cadres, and international performance standards , they also provide managers with wide and varied information when they need them, and allows them to recognize how to achieve results that put the strategy at the heart of the organization's plans and not solely for controlling or monitoring.
4. Definition of performance management:
Productivity is concerned with the measures used from the production inputs, such as, labor, capital , land and organization, needed to produce a given volume of output of goods and various services, and despite the existence of debate on the concept of productivity in the public and private sectors, there is emphasis on the need to highlight the importance of managing productivity in various sectors as an essential element of economic and social progress, which reflects the performance management in the science of management, this importance made organizations consider the concept of productivity management or "performance management" as one of the most important duties of the administration. Economists also find that the productivity measures the level of success of economic unity in the optimal utilization of economic resources available to produce goods and required services, which means that productivity is considered an important indicator of performance measurement indicators in economic units (Al Shaqawi, 2002, p 10).
The degree of the progress of any country is measured by its ability to manage the performance, which increases the productivity, a goal that represents the backbone of economic and social progress and a prominent feature in the developed countries, a goal that the developing countries or those emerging seek, however, the process of measuring productivity accurately – in public and private sectors - is still shrouded in a lot of ambiguity and imprecision, due to the lack of specific criteria that can be relied upon for measurement, especially in the service field , despite the serious attempts by the specialists of administration in various organizations, especially the public ones to determine the direction of productivity, and to identify the factors affecting them, to activate them, and remove obstacles that hinder its development (Al Shaqawi, 2002, p 10).
4.1 Balanced Score Card:
This Card is represented through different dimensions posed by the strategic direction of the organization towards future performance and standards of operating performance, which is not only obtained using financial performance measures but by adding non-financial performance measures, and provides a whole clearer picture about the organization's performance and the best way to achieve this performance, the card also represents more than one picture that combine with each other important performance indicators or success key factors of the organization, it's a chain sequence of goals and standards that are interdependent on each other and they are supported and bonded by it in the light of reason and the subsequent acts and procedures (Kaplan & Norton, 1992, PP 64 -65).
And this, balanced the score (performance) card is a tool to revitalize and measure the performance of business units, as it contributes to improve the performance, measure its progress and its changes, and it’s defined as a score registration card with four dimensions: financial, customer, internal processes, growth and education.
This model was called the Balanced Score Card BSC and therefore it’s a card the records scores that point to the amount of information previously available to the strategy that is to be executed, and its need for it in accordance with the conditions faced by this strategy, as it leads the organization now and in the future, and the card determines four primary sources for the strategy of business organizations and its management, it express’s the following: the financial perspective and the customer perspective, the perspective of internal processes, learning and growth perspective (Al-Qarni, 2009).
Both Kaplan & Norton in building the Card and determining its implications, adopted two assumptions: the effective measurement which should be the main part in the management process, and the other part is what should be measured any that can be obtained, therefore, the efficient administration depends on the effective measurement of performance and its results ( Bulter et al, 1997, P.242).
This card provides managers with a variety of real-time information (Kaplan & Norton, 1992, P.71), the card was developed to meet many of the needs of managers at one time, and give the senior management a comprehensive view of the business in a clear and fast, also, the card displays through its four dimensions, the integration between financial metrics and non-financial metrics, it represents the operational objectives and standards with its various dimensions, it is considered a motor toward the future of the financial performance of the organization, as it embodies the card through its goals and standards the integrated and interactive relationship between the long-term strategic directions and operations.
It offers managers a comprehensive perspective that allows them to see the organization from four important aspects, integrated by answering four key questions, and they are: How do customers see the organization, what are the internal processes that should characterized it, Can the organization to continue the operations of improvement and the formation of value, and how does the organization see the stakeholders and shareholders in the organization. All this helps to guide the organization's vision for the future and how to achieve the results related to the vision, as it’s a sequential score card between the elements of the organization's strategy, starting from the continuous improvement of the organization through participation until the working staff, till it reaches the international standards of performance, and this includes transforming the organization's vision into action and procedures from one hand, and to the continuous improvement in the performance of the other hand, the card also represents a link between the information system and the needs of the strategy and its management.
The Balance Scorecard leads the strategy from a general concept, to the frame which guides the organization in guiding its work, and in determining the future image that, which enables them to take appropriate decisions in the administrative levels and all regulatory departments. This Card is a method or a plan that includes integration between the organization’s main objectives, and its policy, and in sequence with the activities it executes in its supreme form (Certo: 1995, p.6). It represents a group of homogeneous patterns in the decisions taken by the organization (Schroeder, 1989, P.11), and meanings of the strategy has been summarized, as it includes a Plan, a Pattern, a Poly, a Position, and a Perspective (Mintzberg: 1987, P.11) and any of it, individual or jointly, may represent the meant strategy in a particular area.
The knowledge of the strategy that is consistent with the nature of the work of the Organization and its field requires collecting a large amount of information from inside and outside the organization, which constitutes an important input in decisions that reflect the content of the strategy and its direction. However, the method of collecting information and its organizing in traditional methods needs a relatively long time in order to receive a response to the strategy that is intended to be executed, and this is due to the method used to collect information from the external and internal environments, to identify its trends, and conduct an interview for the purpose of identifying alternatives and choosing the most appropriate.
Finally, this method can raise a group of problems: firstly, lost time between planning processes and the need to supply information, secondly, the need for a linguistic understanding shared between business executives and officials about information systems (VanDer Zee & DEJong, 1999, P.199). Avoiding these problems requires an immediate response to the strategy’s and management’s need for information, which requires the development of a special information model that feeds the strategy with information that helps it and explains to it the most successful way into the future, as well as providing metrics designed to measure the impact of environmental multi dimensions on the strategy, therefore, the development or improvement made by the strategies direction towards the future can be measured through its relationship with these dimensions.
4.2 Components of the Balanced Scorecard:
These balanced objectives in its original form consist of four separate cards, each containing an objective specialized in the one field, and all of them ultimately realize the material and private objectives for the development of business, and these cards are as follows:
1. Financial goals Card: this card uses financial indicators because they reflect the profitability of the organization’s objectives, and is its role in maximizing the share of shareholder. However, the non-profit organizations may differ slightly, but they need sufficient resources to perform their activities and maintain continuity in the market. Financial objectives are based on the rate of return, the reduction of the cost, improving productivity, returns on investments, the growth of sales, income, and market share. For measuring these objectives, various and important financial percentages and numbers that express the performance of work at different times, are used, for example, the value of its net profit is large, while the rate of return on investments is small. Also, the money flow is very important in the times of financial distress (Norton & Kaplan, 1992).
2. Customers Card: this card contains the objectives related with customer satisfaction, which includes a set of quality standards: customer satisfaction and keeping, obtaining a new one, customer profitability, and market share of the targeted sectors, it is also linked with client indicators, such as time, quality, performance, and service. This card helps to cover the deficiencies in organizations that do not measure these objectives, where it’s rare to find that an institution requests from the client to comment on the service purchased by them, while the organizations that work in developed countries send a lot of questionnaires designed to identify the wishes, preferences, tendencies and trends of buyers. Organization, which are trying to maximize the financial figures in a short term will find after a period of time that customer requirements have changed, and that their products have become undesirable, and the organization that does not track customer requests, suggestions and complaints will be subject to loss of many of the customers, and a dropping out to competitors in the market (Shibley, 2005).
3. Internal processes Card: Many organizations neglect many internal processes performance metrics, and thus having a declining level of performance. This dimension focuses on the processes that are characterized by the organization, and has a clear value in revitalizing it and pushing it towards achieving its strategic objectives, executives identify the processes that earn the organization a clear superiority, and provide a high added value for customer in the target market, as it responds to the expectations of stakeholders on improving return rates. This card is trying to develop the organization from the inside and maintain a high level of performance, including: manufacturing quality, the wastage of raw manufacturer materials, the time of progress in industrialization, the rapid change of production from a product to another, the quality of design, the relationship with suppliers, the development of business management systems, the use of information technology, cooperation between various departments, new design, and the reduction percentage in the conversion cycle time. (Kaplan, 1992 & Norton).
4. learning and creativity Card: this card is used to help the organization monitor its progress and innovative capabilities compared to competitors in the market, and it includes the development possibilities of working in the organization in accordance with the requirements of innovation and change and sustaining it in order to ensure the continued progress of the organization in achieving its objectives and improving it, and this requires the interest in the prevailing structure which helps in the process of configuring the long-term growth, improvement and by supporting organizational learning and growth on three key elements: the people, the system, and the regulatory actions. This card is linked with the ability of the organization to achieve multiple objectives, which include the application of up to date administrative policies, learning new technology, providing a number of new products, the number of proposals submitted and implemented by the staff, and the existence of an employee incentive for innovation and development (Kapaln & Norton: 1996: P.64). The investment in the development of the skills of the workers and in strengthening the information systems and information technologies, and in organizing the relationship between actions and regulatory pathways, contribute to reducing the gap between potentials, current systems and procedures, with the goals and performance measures required to it.
The relationship between the previous four dimensions represent a relationship of exchange and reliability in the Card; The financial perspective reflects what should be measured from the long-term objectives of the organization (strategic) such as growth rates, or returns of investment. While the customer perspective represents the Organization's share of the market, and this perspective pushes the financial perspective from one side and supports it from the other side, this requires the existence of processes or outstanding competencies, and the need for attention and improvement because it provides output quantity and the type that responds to the needs
of the client and his/her expectations, and these requirements can only be achieved by relying on improving the key elements of growth and learning. The relationship between the strategic and operational dimensions shows through a standard metric model that includes: the goal, the measure, the target, and the starting point (Shibley, 2005).
5. Study Methodology:
A) Study population: The study population consists of all employees in the pharmaceutical industry operating in Jordan for the year 2010.
B) Study sample: an accessible sample was withdrawn from companies that amounted to 19 companies, where the questionnaire was distributed to workers in those companies, numbered 200 workers, 189 of whom responded to the questionnaire, or a rate of 96.4% that underwent all the final analysis.
Table (1): Sample Distribution according to educational and age level
Educational level
Number Rate Age level
Number Rate Years of experience Number Rate Secondary and less 8 4.2 Less than 30 years 9 4.8 Less than 5 years 9 4.8 College Diploma 30 15.9 30 – less than 40 46 24.3 5 – less than 10 65 34.4 University 136 72 40 – less than 50 78 41.3 10 – less than 15 87 46
Higher studies 15 7.9 50 – less than 60
56 29.6 15 + 28 14.8
Total 189 100 Total 189 100 Total 189 100
Table (2): Company Sample distribution according to market size and share
Company size Number Rate Market share Number Rate
Small size 6 31.6 Less than 5% 5 26.3
Medium size 9 47.4 5% - less than 10% 3 15.8
Large size 3 15.8 10% - les than 15% 6 31.6
15% + 5 26.3
Total 19 100 Total 19 100
C) Study Method: The study used the descriptive analysis method for the data which has been obtained, and therefore the measures of central arithmetic tendency were used, such as, the median, and the standard deviation, as well as statistical methods necessary for testing the hypotheses such as: chi square test and correlation coefficients, and Table 3 shows the statistical tests that were conducted on the study data, which indicates that all previous tests are statistically acceptable.
Table (3): Statistical tests and its objective
Axis Coefficient of mid variation (1) Cronbach's alpha (2)
Clients and beneficiaries axis 0.94 0.914
Internal processes axis 0.979 0.919
Learning, improvement, and creativity axis
0.998 0.987
Financial axis 0.947 0.926
D) Sources of data collection: The study relied on two types of data: the secondary data by reviewing the literatures of the subject in verified scientific journals, books and studies of Arab and foreign origin, as well as specialized websites. However, for the raw data, a questionnaire was developed to collect the necessary data from the study sample.
(1) Used to measure the degree of internal coherence and consistency between the paragraphs of the measure, and indicates the high value of the correlation coefficient to the fact that the parts are similar in response to a large extent.
(2) Measures the degree of validity and reliability of the scale, and the acceptable ratio for this test is (60%) or more than that.
E) The validity and reliability of the questionnaire: the researcher used a number of methods to verify the veracity of the questionnaire, which is as follows:
1. Validity of the arbitrators: Most arbitrators agreed on all the indicators included in the five axes of the questionnaire with some modifications in words, where the rate of agreement exceeded 80%.
2. Test of the internal consistency to measure the validity of the paragraphs and the connections between them: a correlation coefficient of mid variation has been found for each axis ranging between 90% - 96%, which is statistically significant at the level of significance of 5%, and Table 3 shows that the questionnaire has a degree of honesty.
3. Scale stability test: Table 3 shows that the stability coefficient for the measure as a whole is 96.9% (Cronbach's alpha), noting that the testing coefficients for each axis individually ranged between 93% - 99%, which indicates that the measure has a high stability coefficient, which gave the data used, a kind of honesty and reliability.
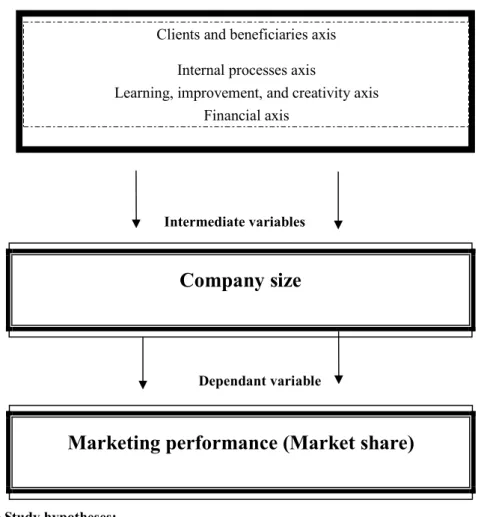
Independent variables (Elements of the Balanced Scorecard)
Intermediate variables
Dependant variable
6. Testing the Study hypotheses:
Ho1: There is no statistically significant relationship between the application of the stakeholders and beneficiaries’ standard and the marketing performance of Jordanian pharmaceutical companies?
Table 4 shows that 75.2% of the indicators that reflect the interests and needs of the beneficiaries’ are already available in the pharmaceutical industry in Jordan. The great disparity is also found in the application of indicators that show on this axis, therefore, there are a lot of unavailable indicators in the plans and programs of the pharmaceutical companies in Jordan, which means that there is a clear lack of goal setting that achieves strategies intended for inclusion in such companies.
Arithmetical averages recorded for most of the phrases in the axis values of more than 2.5, and with the exception of the indicators (5, 10, 11), and this means that these indicators are not available in the companies that represent the study sample. This means that the indicators that were not accepted in the sample were: availability of tools to measure the level of satisfaction of other governmental sectors related with your company, availability of a public relations device that is capable of measuring and improving the image of your company to the outside world, and availability of tools to measure the growth rate of new services to a number of new
Marketing performance (Market share)
Company size
Clients and beneficiaries axis Internal processes axis
Learning, improvement, and creativity axis Financial axis
customers.
Table (4): Sample answers distribution and descriptive statistics of the beneficiary’s axis
Phrase Available and
implemented %
Available and not
implemented %
Unavailable % Mean S.D
Availability of tools to measure the level of satisfaction of clients and beneficiaries towards the services provided to them
20.7 0.00 79.3 3.862 0.850
Availability of tools to measure the growth rate of beneficiaries from the provided services
41.4 0.00
58.6
2.724 1.246
Availability of an effective system to study the complaints of beneficiaries on the services provided to them.
48.3 10.3 41.4 2.937 0.916
Availability of tools to measure the level of public participation in events and programs organized by your administration.
17.2 0.00 82.8
2.552
0.785
Availability of a tool to measure the level of satisfaction of other government sectors that have relationships with your company
13.8 0.00 86.2 2.410 0.786
Availability of a Guide for the classification of the level of the current relationship with the beneficiaries of the services provided by your company
10.3 3.4 86.2 2.7586 0.634
Availability of a list with the most important beneficiaries that show dissatisfaction or present suggestions on the services provided to them
10.3 3.4 86.2
2.7586
0.656
Availability of tools to measure the types of beneficiaries from the services provided by your company
24.1 0.00 75.9 2.5172 0.879
Availability of tools to increase the size of participation of the company in local social service
10.3 6.9 82.8 2.7241 0.649
device that is able to measure and improve the image of your company to the outer world
Availability of tools to measure the growth rate of new services to a number of new customers
24.1 3.4 72.4 2.4828 0.879
Availability of tools to track changes that happen in the outer environment and find ways to benefit from it in designing new services
17.2 0.00 82.8 2.6552 0.765
Total 21.9 2.9 75.2
The pharmaceutical companies in Jordanian have been characterized with great weakness in the application of a lot of indicators that relate to the beneficiaries, examples include: measurement tools for the consent of beneficiaries and customers for the services provided to them, the level of public participation in events and programs organized by the administration, the level of satisfaction of other government sectors that are related to the company, the availability of a guide for the classification of the level of the current relationship with the beneficiaries from the services offered by the company, the availability of tools to increase the size of local community participation, and the availability of tools for monitoring the changes that occur in the external environment and taking advantage of them in the design of new products.
Table (5): Link between the application of the beneficiaries axis, and organizational variables
Phr ase No. 1 2 3 4 5 6 7 8 9 10 11 12 Org aniz atio n size 0.11 0- 0.50 8- 0.38 5- 0.04 4 0.22 6 0.21 8 0.21 8 0.24 7- 0.11 8 0.11 0- 0.50 8- 0.38 5- Mar ket shar e 0.11 0- 0.04 7 0.06 3 0.27 1- 0.14 0- 0.06 8- 0.06 8- 0.03 2 0.15 2- 0.11 0- 0.04 7 0.06 3 Other statistical indicators Ch 2 Calculated = 17.18 Siq. = 0.0325 Confidence Level = 5% Ch 2 Tabulated = 42.6
We find in this place an important result, which shows that the exercise of the pharmaceutical industry of Jordan for their work and activities takes place in isolation from the concerns and requirements or expectations of the beneficiaries and target customers by these companies, the pharmaceutical industry company plays the role of a monopolist for all services rendered, although they are profitable organizations, they design their services according to the objectives of the monopolist, which is to provide service regardless of the level of quality provided, or by attempting to remove the opinion of the beneficiary on these services and his/her role in its composition or design, especially if the profit targets for the private companies requires working on service designs that fit the targeted segments of customers.
The size of the working pharmaceutical companies has been divided into three categories: firstly, companies that run with 1-19 workers are considered small-sized companies in accordance with the standard of the number of employees of the Department of Statistics in Jordan, and with 19 - less than 50 workers are considered medium-sized companies, and with over 50 workers are large-sized companies.
And accordance to the terms of this standard, Table 5 shows that there is a statistically significant correlation average between the size of the company and most of the indicators that fall within the focus of the beneficiaries. This means the application of the beneficiary customers card from the Jordanian pharmaceutical industry companies, is linked to the size of the company, and that the larger in size is the company, the application of these indicators is easier, and therefore the larger companies are accompanied by an increase in the number of customers and reviewers to those customers, which means that there is a need for a major effort to specify their needs and interests.
It is also found, that the application of these indicators is reflected in the increase of the market share for the company, which is an important factor and an assistant to embrace the idea of applying those indicators, and the fact that it is considered the heart of the marketing concept, which provides satisfaction to the needs and aspirations of the customers.
Depending on the calculated value of the chi square test Ch 2 (17.18) and comparing it with the its tabular value with degrees of freedom amounting in 29 and levels of significance of 5% (42.6), therefore, the text of the first nihilist hypothesis is accepted, which sees that there was no statistically significant relationship between the standard of stakeholders and beneficiaries and between marketing performance of the pharmaceutical industry in Jordan. Which means that the Jordanian pharmaceutical companies do not apply indicators to measure the services they provide, and the same result can be achieved by comparing the level of significance of (5%) with level of test significance.
Ho2: There is no statistically significant relationship between the application of the standard of internal processes and procedures and the marketing performance of the pharmaceutical industry in Jordan.
The table No. 6 indicates that 72.1% of indicators that reflect the processes and procedures are unavailable in the pharmaceutical industry companies in Jordan, and the arithmetical averages of these indicators showed that it's more than the value 2, it ranged between 2.0345 - 2.9655 (arithmetic mean of the scale 3) which confirms that result, and the indicator No. 2 obtained a high average of 2.721, which indicated to the approval of most of the respondents on the unavailability of tools to measure the rate of lost time to the overall time in their organizations. And about 32% of those indicators are available but they vary between the application and or not within these departments, it turns out that there are differences evident in the application of indicators that reflect the processes and procedures within these departments, and perhaps because of the different nature of these departments and the lack of a standard or a measure that can be used to judge its work.
Table (6): Distribution of Sample Answers and the descriptive statistics of the internal processes axis
Phrase Available and
implemented % Available and not implemented % Unavailable% Mean S.D
There is a tool to measure the new services offered by the company to the public.
24.1 0.00 75.9 2.872 0.87099
There is a tool to measure processes with high added value provided by your company.
13.8 0.00 86.2 2.741
0.70186 There is a quality system for procedures and processes
that take place within your company.
27.6 3.4 69 2.534 0.90701
There is a tool for measuring the quality of output resulting from the company.
27.6 6.9 65.5 2.123 0.90292
There are procedures in your company that set it apart from the rest of the other organizations (innovation, information systems, organization, speed).
55.4 3.4 41.2 2.329
0.99010
There is a tool in your company to measure the percentage of transactions that are scheduled for certain periods of time (a week, a month, a year).
44.8 3.4 51.7 2.125
0.99753
There is a tool in your company to measure the proportion of time it takes to do certain procedures.
13.8 10.3 75.9 2.207
0.72771 TThere is a tool in your company to measure the
percentage of lost time to the overall time.
3.4 11.0 85.6 2.655
0.18570 There is a tool in your company to measure the
proportion of erroneous transactions to total transactions.
17.2 5.9 77.9 2.542
0.77998
There is a tool in your company to measure the quality of the procedural steps in the work.
24.1 6.9 69 2.483 0.86957
There is a tool in your company to measure the accuracy of the procedural steps in the work.
31 3.4 65.5 2.348 0.93640
There is a tool in your company to measure the speed of procedural steps in the work.
27.6 10.3 62.1 2.448
0.89745 There is a tool to measure the percentage of input /
output in the company.
27.6 13.8 58.6 2.103 0.89056
There is a tool for the development of internal processes in your company.
37.9 20.7 41.4 2.345 0.90565
There is a tool for measuring the rate of decline in problems at work to the total number of problems in your company.
20.7 6.9 72.4 2.172
0.82897
Total 25.5 2.4 72.1
As time is considered the fifth element from the production elements appears to be still untapped efficiently in a lot of the pharmaceutical industry companies in Jordan, where the rate of the work productivity element to the working time is very little, and this reflects the absence of measurement tools for the percentage of time lost to the total time
at work in about 85.6% of the companies, and 77.9% of companies still neglect the process of doing certain calculations of the time that is needed to complete some of the work or actions.
Also, 41% of the pharmaceutical industry companies in Jordan, uses regulations while exercising its actions, which put it apart from the rest of the competitors, especially in the field of creativity, information systems, organization, and speed, especially if we know that a large percentage of companies do not bother in perfecting its services to the public, especially with relation to the accuracy, speed, and quality of services provided, and considering that sophistication and creativity are the key to growth for many companies.
Table (7): Link between the application of the axis of the processes, procedures and variables
Phr ase Nu mbe r 1 2 3 4 5 6 7 8 9 10 11 12 13 14 15 Organization size -0.2 2 0.16 -0.38 -0.44 7 -0.55 2 -0.56 3 -0.05 5 0.19 8 -0.11 8 -0.22 5 0.166 -0.38 8 -0.4 4 -0.5 5 -0.5 6 Educational level 0.03 -0.1 4 0.037 0.039 0.050 0.053 -0.04 9 0.01 1 -0.11 6 0.032 -0.140 0.037 0.03 9 0.05 0.05 Other statistical indicators Ch 2 Calculated = 15.56 Siq. = 0.0243
Confidence Level = 5% Ch 2 Tabulated = 42.6
Table No. 7 shows that there is a medium to high correlation between the size of the company and all indicators that reflect the focus of internal processes and procedures, and this means that the possibility of the application of the Balanced Scorecard indicators across the axis of the internal processes grows larger with the size of the company. Also, the high relational ties and mostly positive ones between the application of earlier indicators and the market share increase in Jordanian pharmaceutical companies, and the results of the application of these indicators reflects positively in increasing the market share and therefore the level of profits for these companies.
Depending on the calculated value of the chi square test Ch 2 (15.56) and comparing it with its tabular value (42.6), the text of the second nihilist hypothesis is accepted, which sees that there was no statistically significant relationship between the standard of internal processes and procedures and between the marketing performance of the pharmaceutical industry in Jordan, and therefore the standard of internal processes and procedures did not have a positive impact on the marketing performance of the pharmaceutical industry companies in Jordan, with a goal of increasing the market share of these companies.
Ho3: There is no statistically significant relationship between the application of the standard of education, development and innovation of human resources and the marketing performance of Jordanian pharmaceutical companies
Table 8 indicates that about 67.9% of the Jordanian pharmaceutical companies provide and apply indicators and benchmarks that reflect the creativity and development and qualification of human resources involved. It also found that 90.8% of government departments have an interest in improving its used equipment and methods, where it constantly tries to enter new methods and tools that improve the processes and procedures within those departments,
such as: computers, phones, faxes, scanners, printers ... Etc., and this is such a high percentage, which is reflected by the desire of modernization and development in governmental organizations operating in the province.
It was found that a ratio between 52% - 58% of the government departments have effective standards and are applied partially, and are mainly related to: systems of incentives and rewards that motivate and achieves employee satisfaction, design of educational and training programs for working leaders, the existence of appropriate information systems and means of communication, also the application of standards that show the authorities and responsibilities of the leaders involved.
And through the analysis, it was shown that 30.8% of government departments only partially implemented some standards related to the self-calendar for the working leaders in it, and it uses tools to measure the unique capacities and skills of the workers in those departments, the analysis also found that nearly a third of government departments applied and used the training and functional requirements manual for the leaders involved.
Table (8) Distribution of Sample Answers and the descriptive statistics of the development and creativity axis
Phrase Available and implemente d % Available and not implemented % Unavailable% Mean S.D
There is a tool to measure the satisfaction of
employees for the business climate in your company. 24.1 3.4 72.4
2.4828 87099.0
There are education and training programs for the
work leaders in your company. 58.6 10.3 31
1.7241 0.92182
There are methods and tools for new improved
processes (computer, phone, etc.) in your company. 90.8 3.4 5.8
1.3103
0.71231 There is in your administration systems of incentives
and rewards that motivate the performance and achieves satisfaction of the employees.
51.7 3.4 44.8 1.9310 0.99753
There is in your administration, information systems
and appropriate means of communication. 55.2 6.9 37.9
1.8276
0.96618 There is in your administration tools for
self-evaluation of the leaders involved. 30.8 0.00 69.2
2.1034 1.01224
There is in your company a tool to measure the
capacity and outstanding skills of the workers. 37.9 3.4 58.6
2.2069
0.97758 There is in your company a tool to measure
innovation and creativity among employees. 17.2 3.4 79.3
2.6207 0.77523
There is in your company a tool to measure the impact of transferring the knowledge and expertise among its staff.
17.2 10.3 72.4 2.5517 0.78314
There is in your company a guide to measure the training needs and work needs for the leaders involved.
31 13.8 55.2 2.2414 0.91242
There is in your company standards that show the
authorities and responsibilities of the employees. 51.7 3.4 44.8
1.9310
0.99753
It also was found that there is a large ratio of Jordanian pharmaceutical companies that do not have the following indicators: Tools to measure staff satisfaction in the business climate, tools to measure innovation and creativity among employees, tools to measure the impact of the transfer of knowledge and experience among workers, measuring tools for the unique capabilities and skills of their employees, nor there where tools to measure the functional and training needs of the leaders involved.
Table (9): Link between the application of the axis of development and creativity and the variables
Phr ase Nu mbe r 1 2 3 4 5 6 7 8 9 10 11 Organization size -0.28 5 -0.54 8 -0.090 -0.594 -0.591 -0.547 -0.543 -0.05 1 -0.184 -0.285 -0.548 Market share 0.28 8 0.21 3 0.084 0.260 0.235 0.309 0.355 -0.16 5 0.039 0.288 0.213 Other statistical indicators Ch 2 Calculated = 15.3 Siq. = 0.056
Confidence Level = 5% Ch 2 Tabulated = 42.56
Table No. 9 indicates that there are positive medium links between the size of the organization and between each of the following: availability of incentives and rewards that motivate performance and achieve satisfaction of employees, availability of information systems and means of appropriate communication, availability of a tool of self-evaluation of leaders working, availability of a tool for measuring the capacity and unique skills of the workers,Finally, the availability of benchmarks to illustrate the authorities and responsibilities of the employees, the more the size of the organization increased, the use of those indicators declined, while there was no statistically significant link between educational levels and age levels with these indicators.
Depending on the calculated value of the chi square test Ch2 (15.3) and comparing it with its tabular value (42.6), the text of the third nihilist hypothesis is accepted, which sees that there was no statistically significant relationship between the application of the standard of education, development and innovation of human resources and between the marketing performance of the pharmaceutical industry in Jordan.
Ho4: There is no statistically significant relationship between the application of the standard of investment and financial returns and the marketing performance of Jordanian pharmaceutical companies
financial indicators that are related to its strategic objectives, while 30% of these companies did not apply such standards, and the reason for this is that there is a high financial sensitivity towards the activities and objectives that those companies are seeking to achieve, and it can be said that the financial decision in the pharmaceutical industry companies in Jordan is kind of central, by being associated with the general spending plans and policies of the company, and therefore the rationalization of expenditure is considered as one of the basic objectives sought by these companies.
Table (10): Distribution of Sample Answers and the descriptive statistics of financial axis
Phrase Available and implemente d % Available and not implemented % Unavailable% Mean S.D
There is a tool to measure the proportion of
financial waste in your administration. 65.5 0.00 34.5
2.32 0.969
There are tools to measure the rate of return on
investments in your administration. 82.8 0.00 17.2
2.85 0.666
There isa tool to measure the rate of growth in
revenue in your administration. 75.9 0.00 24.1
2.6 0.850
There is a tool for setting goals and financial
needs in your administration. 62.1 0.00 37.9
2.37
0.973 There are clear financial programs for the
implementation of different activities and needs in your administration.
55.2 0.00 44.8 2.138 1.176
There are financial measures discussed by senior management in your administration (in revenue growth, returns on investment, profitability, returns to assets). 72.4 3.4 24.1 2.769 0.861
There are short-and long-term financial plans in
your administration. 62.1 0.00 37.9
2.277 0.973
There is a monitoring process to the new
financial needs every year in your administration. 48.3 0.00 51.7
1.76
0.966 There are modern ways to use available financial
budgets (budget performance, zero-based budget) in your administration.
75.9 0.00 24.1 2.52 0.878
There are tools to measure the feasibility of
investments made by your administration. 86.2 3.4 10.3
2.75 0.675
Total
68.6 0.7 30.7
The results show that approximately 62.1% of the Jordanian pharmaceutical companies fully applied goal setting and financial needs, and this does not preclude the application of some short-and long-term financial plans . It also shows that 41% of companies annually execute the process of monitoring the new financial needs. As it turns out that 55% of companies have clear financial programs for the implementation of activities and identifying its different
needs. It also found that 65% of companies have an interest in reducing the proportion of financial waste and in improving the utilization of the available financial resources. And in general it was found that 72.4% of the pharmaceutical industry companies in Jordan applied criteria and indicators for investment and estimated the resulting financial returns, because the market business is at the heart of the work of these companies.
Table (11): Link between the application of the financial axis and organizational variables
Phrase Number 1 2 3 4 5 6 7 8 9 10 Organization size 0.88 0.69 0.89 0.77 0.87 0.79 0.88 0.75 0.76 0.95 Market share 0.79 0.71 0.76 0.98 0.87 0.90 0.78 0.98 0.93 0.68 Other statistical indicators Ch 2 Calculated =45.9 Siq. = 0.019
Confidence Level = 5% Ch 2 Tabulated = 42.56
It is clear from Table 11 that there are elevated and statistically acceptable correlation relationships between the size of the organization and among most of the financial indicators, and the greater the size of the organization the more increases in the ability to apply these financial indicators. Depending on the calculated value of the chi square test Ch2 (45.9) and comparing it with its tabular value (42.56), the text of the fourth nihilist hypothesis is rejected, which sees that there is a statistically significant relationship between the application of the standard of financial and investment returns, and between the marketing performance of the pharmaceutical industry in Jordan, and the alternative hypothesis is accepted, which sees the existence of this relationship
7. Recommendations:
In light of the results that have been reached, the following recommendations are presented:
Improve the operations that take advantage of the Balanced Scorecard in the activation of the strategic plans of the pharmaceutical industry companies in particular, and in the public and private sectors, and seeking to formulate its objectives in the form of specific results that are quantifiable.
− Build and provide tools to measure the concerns and needs of the beneficiaries of the services provided by the pharmaceutical industry companies in Jordan.
− Development of public relations devices in the pharmaceutical industry companies to become more able to measure and monitor complaints and improve their public image to the outside world.
− Provide evidence for the classification of the level of the current relationship with the beneficiaries of the services provided by the pharmaceutical industry companies in Jordan.
− Activate internal processes development tools in Jordanian pharmaceutical companies and investing it in the process of application and development.
− Provide the following indicators: tools to measure the satisfaction of employees in the business climate, tools to measure innovation and creativity among employees, tools to measure the impact of the transfer of knowledge and expertise among its staff, and tools to measure the distinctive capabilities and skills among workers in the Jordanian pharmaceutical industry companies.
References: Arabic references
(1) Abu shekha nader ahmad(1982),productivity and development methods in public EST. Amman. (2) abu aleneen,(2004),establishments performance assessment for Egyptian organizations,No.6 (3) Shebly muslim(2005), balance board using in commercial banks strategy directions,economy
Afaq,Ref.26.No.3.
(4) Zuriqat,majdi issa,(2008),balance scorecard in Jordanian medicine industry,alkuwait university,Ref.15,No.3
(5) Alshakawi,abdelrahman,(2002), for better performance in government sector, in Saudi Arabia, planning ministry,alryadth.
Foreign References:
(6) -Bank, John (2000) The Essence of Total Quality Management 2nd. Edition Pearson Education Limited , Edinburgh Gate , Harlow .
(7) Certo , Samuel et al (1995), The Strategic Management Process, 3rd Edition , Austen Press, Irwin , Chicago .
(8) David – Fred , R (1993) , Concepts of Strategic Management , 4th edition , Macmillan Publishing Company , New York .
(9) -Grant .R (1999) Contemporary Strategy Analysis,4th Edition, Blackwell 2002, Management, J. Naylor, Financial Times .
(10)Harrington , H. James (1995) , Total Improvement Management: The next Generation in Performance Improvement. Mc Grow- Hill , Inc. New York .
(11)Loh, Michael.(1997), Rc-Engineering at Works, Second Edition, Gower Publishing Limited , Hampshire , England
Scientific Journals:
(1) -Bulter , A et al (1997), Linking The Balanced Score Card To Strategy ,Long Range Planning , Vol 30 , No.2 .
(2) -Burkhead , Jesse; &, Hennigan, Patrick J (January– February 1978), Productivity Analysis : A Search for Definition & Order”. Public Administration Review .
(3) Coyle-Shapiro , Jacqueling A.M (DEC 1999) , Employee Participation & Assessment of An Organizational Change Intervention: A Three-Wave Study of Total Quality Management”. The Journal of Applied
Behavioral Science, Volume 35 , Issue 4 , Arlington.
(4) Gilbert and Tang/ podsakoff et al. / Johns, In : Laschinger , Heather K. spenc ; Finegan , Joan; Shamiam Judith (Summer 2001) , The Impact of Workplace empowerment, Organizational trust on Staff nurses’ work satisfaction and organizational Commitment” , Health Care management Review, volume 26, Issue 3 ; Gaithersburg .
(5) Kaplan , R & Norton , A.P (1996) , The Balanced Score Card Measures That Drive Performance, H.B.R . Jan – Feb .
(6) Kaplan. R & Norton, D (January – February , 1996) , Using the Balanced Scorecard as a Strategic Management System, , Harvard Business Review.
Boost efficiency and effectiveness at a VA Medical center” ? Health Care management Review, volume 25 , Issue 2 , Gaithersburg .
(8) Quinn , J.B (1980) , Strategies For Change , Home Wood . III Richard, D, Irwin , Chicago (9) Rousseau ,Y & Rousseay , P (2000) , Turning Strategy Into Action In Financial Services , CMA ,
Management December & January .
(10)-Simpson , Mike ; Kondouli, Dimitra (July 2000) , A practical approach to benchmarking in three Service industries”. Total Quality Management , volume 11, Issue 4-6, Abingdon .
(11)-Smith , Adam (1952) , An Inquiry into the nature and causes of the wealth of nations. In: Encyclopedia Britanica. London .