ContentslistsavailableatScienceDirect
Resuscitation
jo u r n al hom ep age:w w w . e l s e v i e r . c o m / l o c a t e / r e s u s c i t a t i o n
Developing
and
evaluating
a
machine
learning
based
algorithm
to
predict
the
need
of
pediatric
intensive
care
unit
transfer
for
newly
hospitalized
children
Haijun
Zhai
a,
Patrick
Brady
b,d,
Qi
Li
a,
Todd
Lingren
a,
Yizhao
Ni
a,
Derek
S.
Wheeler
c,
Imre
Solti
a,d,∗aDivisionofBiomedicalInformatics,CincinnatiChildren’sHospitalMedicalCenter,Cincinnati,OH,USA bDivisionofHospitalMedicine,CincinnatiChildren’sHospitalMedicalCenter,Cincinnati,OH,USA cDivisionofCriticalCareMedicine,CincinnatiChildren’sHospitalMedicalCenter,Cincinnati,OH,USA
dJamesM.AndersonCenterforHealthSystemsExcellence,CincinnatiChildren’sHospitalMedicalCenter,Cincinnati,OH,USA
a
r
t
i
c
l
e
i
n
f
o
Articlehistory:
Received27September2013
Receivedinrevisedform20February2014 Accepted8April2014
Keywords:
Clinicalstatusdeterioration Clinicalcare PICU PEWS Machinelearning EHR
a
b
s
t
r
a
c
t
Background:Earlywarningscores(EWS)aredesignedtoidentifyearlyclinicaldeteriorationbycombining physiologicand/orlaboratorymeasurestogenerateaquantifiedscore.CurrentEWSleverageonlya smallfractionofElectronicHealthRecord(EHR)content.Theplannedwidespreadimplementationof EHRsbringsthepromiseofabundantdataresourcesforpredictionpurposes.Thethreespecificaimsof ourresearchare:(1)todevelopanEHR-basedautomatedalgorithmtopredicttheneedforPediatric IntensiveCareUnit(PICU)transferinthefirst24hofadmission;(2)toevaluatetheperformanceofthe newalgorithmonaheld-outtestdataset;and(3)tocomparetheeffectivenessofthenewalgorithm’s withthoseoftwopublishedPediatricEarlyWarningScores(PEWS).
Methods:Thecaseswerecomprisedof526encounterswith24-hPediatricIntensiveCareUnit(PICU) transfer.Inadditiontothecases,werandomlyselected6772controlencountersfrom62516inpatient admissionsthatwerenevertransferredtothePICU.Weused29variablesinalogisticregressionand comparedouralgorithmagainsttwopublishedPEWSonaheld-outtestdataset.
Results:Thelogisticregressionalgorithmachieved0.849(95%CI0.753–0.945)sensitivity,0.859(95%CI 0.850–0.868)specificityand0.912(95%CI0.905–0.919)areaunderthecurve(AUC)inthetestset.Our algorithm’sAUCwassignificantlyhigher,by11.8and22.6%inthetestset,thantwopublishedPEWS. Conclusion:Thenovelalgorithmachievedhighersensitivity,specificity,andAUCthanthetwoPEWS reportedintheliterature.
©2014TheAuthors.PublishedbyElsevierIrelandLtd.ThisisanopenaccessarticleundertheCC BY-NC-SAlicense(http://creativecommons.org/licenses/by-nc-sa/3.0/).
1. Introduction
Failuretorescuehospitalizedpatientsfromcomplicationsof diseaseortreatmentis thesourceofsubstantialmorbidity and death.1,2Acardiopulmonaryarrestorcodeoutsidetheintensive careunit(ICU)isaprofoundconsequenceoffailuretorescuethat isassociatedwitha poorprognosisinhospitalizedchildren and adults.3Asclinicalantecedentsarepresentbeforemostcodes,rapid responsesystems (RRS)have beendesigned,tested, and imple-mentedtodetectdeteriorationearlyandtorapidlyintervene.4,5
∗Correspondingauthorat:CincinnatiChildren’sHospitalMedicalCenter,Division
ofBiomedicalInformatics,3333BurnetAvenue,MLC7024,Cincinnati,OH 45229-3039,USA.
E-mailaddress:[email protected](I.Solti).
OnechallengewithRRSisfailuretoactivateortriggertheafferent limb.6Earlywarningscores(EWS)aredesignedtoaddressthis chal-lengebycombiningphysiologicand/orlaboratorymeasuresintoa quantifiedscorethatcanthenbelinkedtoclear,expectedaction suchasincreasednursingassessmentsor activationofRRS.7–18 ThemostcommonlyusedPediatricEWS(PEWS)combinescoresin 3–7sub-scalestogenerateascorebetween0and26.12,15,16Initial developmentandvalidationofthesescores,whicharedesignedto betabulatedbyhandbynurses,occurredbeforewidespread imple-mentationofelectronichealthrecords(EHR)andthereforeleverage onlyasmallfractionoftheEHRcontent.
The predictive validity of two commonly used PEWS scores12,15,16 has been examined using the outcome of sub-sequent transfer to the PICU. The Bedside PEWS is the most extensively validated to date and includes seven components: heartrate,systolicbloodpressure,capillaryrefilltime,respiratory http://dx.doi.org/10.1016/j.resuscitation.2014.04.009
0300-9572/© 2014 The Authors. Published by Elsevier Ireland Ltd. This is an open access article under the CC BY-NC-SA license (http://creativecommons.org/licenses/by-nc-sa/3.0/).
Fig.1.Stepstogeneratecasesandcontrols.
rate, respiratory effort, transcutaneous oxygen saturation, and oxygentherapy.15Ascoreof0,1,2,or4isgeneratedfromeach categoryandaggregatedtoatotalscore,whichhasanareaunder the receiving operating characteristics curve (AUC) of 0.91 in itsderivationcohortand AUCof0.87 and 0.73in twoseparate validationcohorts.12,15,17
TheMonaghan’sPEWSusedinourinstitutioncombines sub-scoresinbehavior,cardiovascular,andrespiratorydomains,with addedpointsfornebulizers¼hourlyorvomitingfollowingsurgery tocreatea0–9overallscore.Whilelessextensivelyvalidated,this scorehadAUCof0.89whenprospectivelyevaluated.16Sincean EWSwillonlysucceedinpreventingdeteriorationwhenitistied toclearaction,eachscorehascutpointswhereassociated algo-rithmscallforspecificactionstobetaken.TheBedsidePEWShas mostcommonlybeenstudiedusingacutpointof8,whilethe Mon-aghan’sPEWScommonlyusesascore>2forincreasednurseand physicianevaluation.15,16
TheplannedwidespreadimplementationofEHRsbringsthe promise of abundant data resources for research purposes via secondaryuseof EHRdata,includingbetterprediction of clini-caldeterioration.19 Asnoted,EHRsandEHR-basedresearchcan transformhealthcaredeliverythroughadvancedclinicaldecision support.20However,manyofthegrandchallengesindeveloping clinicaldecisionsupportarestillbarelyaddressed.21Oneofthese challengesistominelargeclinicaldatasetstodevelopnew clini-caldecisionsupportsystemstoimproveclinicaloutcomes.Inour studyweaimtocontributetoachievingthisexactgoalbyusing thedatacollectedintheEHRduringroutineclinicalcaretoderive andevaluateapredictionalgorithmforPICUtransferforchildren inacutecarewardswithinthefirst24hofadmission.
2. Methods
2.1. Definitionofcasesandcontrols
CincinnatiChildren’sHospitalMedicalCenter’s(CCHMC) Insti-tutionalReviewBoardapprovedtheprotocolforourretrospective study. We extracted EHR data that were generated by clinical providersbetweenJanuary1,2010andAugust31,2012.During thisperiod,CCHMChad71,752admissionstoitsinpatientwards. Ofthese,1438admissionswerelatertransferredfromthegeneral wardstothePICU. Our unitof analysiswastheencounter and not the patient. For each inpatient encounter, we defined the first24hofadmissionasthestudyperiodforthreereasons.First, we attempted to determine which patients might need more attentionandresourcesatthestartoftheirinpatientstay.Second, aspresentedbelow,thePICUtransfersthatoccurredinthisscope covered a largepercentage of total PICU transfers (i.e.,36.6%). Third,thealgorithmdevelopedinthisscopecouldbegeneralized
andtestedinotherscopes.Weidentified526caseand6772control encounters(Fig.1).
Casesandcontrolsweresplitintotwoexperimentaldatasets,a trainingsetwith90%ofcases(including473casesand473controls) andatestsetwith10%ofcases(consistingof53casesand6299 con-trols).The119:1ratioof“no-PICUtransfer”:“24-hPICUtransfer” wasmaintainedinthetestsettopreservethegeneralizabilityof thestudy’sfindings.
2.2. Identificationandselectionofpredictiveclinicalelementsfor themachinelearningalgorithm
We collected over 300,000,000 data points from all 71,752 encountersthatoccurredbetweenJanuary1,2010andAugust31, 2012.Thedatasetincluded7587uniqueclinicalelementsas can-didatepredictors.Throughasix-stepprocess(Fig.2),weselected thepredictiveclinicalelementsfromthisdataset.
Inthefirststep,wesortedtheclinicalelementsbytheir fre-quency.Inthenextstepwefilteredouttheelementsthatwere mea-suredinlessthan20%ofclinicalencountersandretainedthetop 400mostfrequentelements.Inthethirdstep,apediatrichospitalist manuallyreviewedthe400clinicalelementsandgeneratedalist of16candidateclinicalelementswithpredictivepotential.To cre-ateindependentvariables,wecollectedallmeasurementsforthe 16clinicalelementsrecordedintheEHRuntil1hbeforethe trans-fereventforcasesandmeasurementsrecordedinthefirst24hfor
Top 400 most frequent elements extracted from electronic records
Discretization and categorization
Measurement selection based on chi-square test
36 measurements (155 variables) used for machine learning algorithm
16 elements selected by expert
36 measurements extracted
Fig.2. Identificationandselectionprocedureofclinicalelementsformachine learn-ingalgorithm.
Table1
Predictiveclinicalelements.
Allpredictiveclinical elements
Clinicalelement Type Availability Categorization
Temperature Continuous 924(97.7%) C1 ≤36◦C C2 >36◦Cand <38◦C C3 ≥38◦C Systolicbloodpressure Continuous 912(96.4%) Agegroup
0–3months 3–12months 1–4years 4–12years >12years C1 >60and<80 >80and<100 >90and<110 >90and<120 >100and <130 C2 ≥80or≤60 ≥100or≤80 ≥110or≤90 ≥120or≤90 ≥130or ≤100 C3 ≥100or≤50 ≥120or≤70 ≥125or≤75 ≥140or≤80 ≥150or≤85 C4 ≥130or≤45 ≥150or≤60 ≥160or≤65 ≥170or≤70 ≥190or≤75
Oxygensaturation Continuous 836(88.4%) C1
>94
C2
91–94
C3 ≤90
Heartrate Continuous 930(98.3%) Agegroup
0–3months 3–12months 1–4years 4–12years >12years C1 >110and <150 >100and <150 >90and<120 >70and<110 >60and<100 C2 ≥150or ≤110 ≥150or ≤100 ≥120or≤90 ≥110or≤70 ≥100or≤60 C3 ≥180or≤90 ≥170or≤80 ≥150or≤70 ≥130or≤60 ≥120or≤50 C4 ≥190or≤80 ≥180or≤70 ≥170or≤60 ≥150or≤50 ≥140or≤40
Respiratoryrate Continuous 929(98.2%) Agegroup
0–3months 3–12months 1–4years 4–12years >12years C1 >29and<61 >24and<51 >19and<41 >19and<31 >11and<17 C2 ≥61or≤29 ≥51or≤24 ≥41or≤19 ≥31or≤19 ≥17or≤11 C3 ≥81or≤19 ≥71or≤19 ≥61or≤15 ≥41or≤14 ≥23or≤10 C4 ≥91or≤15 ≥81or≤15 ≥71or≤12 ≥51or≤10 ≥30or≤9 Levelofconsciousness Narrativetext 666(70.4%) C1
Normal C2 Unclear C3 Highrisk Ispatientexperiencing pain? Nominal 920(97.2%) C1 Yes C2 No Cardiac Nominal 881(93.1%) C1 WNL C2 X Respiratory Nominal 883(93.3%) C1 WNL C2 X Neurologic Nominal 875(92.5%) C1 WNL C2 X Urinary Nominal 872(92.2%) C1 WNL C2 X Tissueperfusionand
oxygenation Nominal 858(90.7%) C1 Excellent C2 Compromised C3 Adequate C4 Extremely compro-mised Development appropriate Nominal 813(85.9%) C1 Yes C2 No
AcuityLevel Nominal 674(71.2%) C1
Level1 C2 Level2 C3 Level3 C4 Level4 C5 Level5 Workofbreathing Narrativetext 758(80.1%) C1
Normal
C2
Unclear
C3
Highrisk
Perfusioncaprefill Nominal 398(42.1%) C1
<3s
C2 ≥3s
Levelofconsciousness Workofbreathing
Categorydefinitionsforthe“levelofconsciousness”and“workofbreathing”clinicalelements Normal Alert,active,quiet,arousable,WNL(withinnormallimits),
responds,oriented,awake,answersquestions,follows commands
Easy
Unclear Sleeping,drowsy,emerging,jittery Othercomments
Highrisk Lethargic,sedated,combative,unresponsive,seizure, agitated,seizing
Retracting,mild,nasalflaring,grunting,headbobbing,bobbinghead, moderate,reportsdyspnea,prolongedexpiratoryphase,gasping,severe Note1:Thefirstfiveclinicalelementswerevitalsigndataenteredintotheelectronichealthrecordasnumericvaluesbyanurseornursingassistant.Theremaining10 clinicalelementswereenteredbyanurseatleastevery4haspartofthebodysystemsassessment.Forthisassessmentthenursechosefromalistofpre-existingdescriptors ofthebodysystemorselected“other”andinputfreetext.Note2:Thesecondcolumninfirstsectionoftablenamed“Availability”showedthetotalnumberandpercentage ofencountershavingmeasurementforeachclinicalelementinthetrainingset;Note3:Ciwasusedtoindicatedifferentcategoriesundereachelement;Note4:WNLand
Xdenoted“WithinNormalLimits”and“ExceptionstoWNL”;Note5:For“Acuitylevel”,alocallydevelopedindicator-basedtoolwasusedforassessingpatientacuityand dependencyregardingnurseresources.
controls.Thatis,tobeconservativeinouralgorithmdevelopment, weusedonlyamaximumofthefirst23hours’datapointsforthe cases.Table1presentsthedetailsofthe16clinicalelements,which includefivecontinuous,twonarrative,andninenominalelements.
Inthefourthstep,foreachencounter,weextractedthemost recentmeasurementinthestudytime-window(accountingforthe 1hcutoffthresholdforcases)foreachclinicalelementtodevelop a machine learning algorithm. For the five continuous clinical
Table2
PerformancecomparisonoflogisticregressionagainstBedsidePEWSandMonaghan’sPEWS.
Sensitivity(95%CI) Specificity(95%CI) PPV(95%CI) AUC(95%CI) Performance Trainingset BedsidePEWS 0.715(0.672–0.755) 0.708(0.665–0.749) 0.710(0.669–0.751) 0.785(0.757–0.819) Monaghan’sPEWS 0.741(0.675–0.800) 0.830(0.775–0.877) 0.797(0.739–0.854) 0.814(0.774–0.850) Logisticregression 0.827(0.793–0.861) 0.873(0.843–0.903) 0.867(0.836–0.898) 0.919(0.899–0.935) TestSet BedsidePEWS 0.736(0.597–0.847) 0.717(0.706–0.728) 0.021(0.015–0.028) 0.816(0.806–0.826) Monaghan’sPEWS 0.684(0.434–0.874) 0.816(0.802–0.829) 0.023(0.010–0.035) 0.744(0.728–0.759) Logisticregression 0.849(0.753–0.945) 0.859(0.850–0.868) 0.048(0.035–0.062) 0.912(0.905–0.919) Sensitivity (improvement, P-value) Specificity (improvement, P-value) PPV (improvement, P-value) AUC (improvement, P-value) Performancecomparison
Trainingset LogisticregressionagainstBedsidePEWS 15.7%,P<0.001 23.3%,P<0.001 22.1%,P<0.001 17.1%,P<0.001 LogisticregressionagainstMonaghan’sPEWS 11.6%,P=0.01 5.2%,P=0.13 8.8%,P=0.03 12.9%,P<0.001 Testset LogisticregressionagainstBedsidePEWS 15.4%,P=0.15 19.8%,P<0.001 125.4%,P<0.001 11.8%,P<0.001 LogisticregressionagainstMonaghan’sPEWS 24.1%,P=0.22 5.3%,P<0.001 114.3%,P=0.02 22.6%,P<0.001
elements,wecreatedfouradditionalmeasurements,includingthe oldest,maximum,minimumandmeaninthestudytime-window. With these four measurements, we intended to represent the dynamicnature ofthepatients’ clinical conditions.In total, we collected36candidatemeasurements.
Inthefifthstep,wecategorizedeachofthese36measurements. Formeasurementsfromtheninenominalelements,weusedthe originallabelstoindicatethecategories.Forthefivecontinuous elements, we performeda categorization step based on defini-tionsofcut-offpointsidentifiedfromthepublishedwork15 and guidedbytwophysicians.Wecategorizedthefinaltwonarrative elementsbasedonkeywordsandsynonymsprovidedbythe physi-cian.Table1showsthecategorizationofthe16clinicalelements.In ourdataset,thestudyvariablesrarelyhadmissingvalues. Conse-quently,insteadofattemptingtoimputevaluesfortheoccasionally missingclinicalelements,weaddedanewcategory“NotAvailable” (“N/A”)foreachclinicalelementandhandledthe“N/A”category asothernaturallyoccurringcategoriesofthedata.22The catego-rizationofthese36measurementsresultedin155dichotomous variables.
Finally,weusedChi-squarecalculationstotestthesignificance ofeachmeasurementinthetrainingset.All36measurementswere selectedandusedtodevelopamachinelearningalgorithmat0.05
P-value.
2.3. Algorithmdevelopment
WeselectedlogisticregressionastheMachineLearning(ML) algorithmandusedWeka3.6.8asourexperimentalplatform.We basedthechoiceonlogisticregression’swideusageinclinical deci-sionsystemsandtherelativeeaseofinterpretingitsoutput.Inthis study,insteadofcalculatingaPEWSforeachcategory,weused binary-valuedvariablestoindicatethepresence/absence of cat-egories.Weapplieda forwardstepwiseapproachwithAkaike’s InformationCriterion(AIC)toselectthebestmodel.23
2.4. Evaluationmetrics
Tomeasurethealgorithm’spredictiveperformance,we calcu-latedthesensitivity,specificity,positivepredictivevalue(PPV)and AUC.24Apredictedpositivewasanycombinationofpredictor vari-ablesthathadanoutputof>0.5fromthelogisticregressionmodel.
2.5. Experimentalcomparison
InordertoevaluatethePICUtransferpredictionmethods,we implementedastandard10-foldcrossvalidationstep.Toassessthe performanceofthemodelsonpractical,realworlddata,we evalu-atedthemodelsonthetestingset,whichrepresentedtherealworld ratioof24-htransferandnon-transferencounters.For compari-son,wealsoevaluatedParshuram’sBedsidePEWSandMonaghan’s PEWS.
WhenevaluatingParshuram’sBedsidePEWS,wefollowed Rob-son’swork17andincludedonlyfiveclinicalelementsavailablein ourdatasetinstead oforiginal seven (heartrate,systolic blood pressure,capillaryrefilltime,respiratoryrate,respiratoryeffort, transcutaneousoxygensaturation,andoxygentherapy).Allofthe elementsexceptrespiratoryeffortandoxygentherapywerealso usedinourmachinelearningalgorithm.
Monaghan’sPEWSiscalculatedfornearlyalladmittedpatients atCCHMC.Forthecases,weextractedthehighestPEWSvalues recordedbeforethetransferevent;forcontrols,weextractedthe highestPEWSvaluesrecordedinthefirst24hofhospitalization. Fourhundredtwentyfiveencountersinthetrainingset (consist-ingof201casesand224controls)includedanon-missingvalue forMonaghan’sPEWSand3080encountersinthetestset (includ-ing19casesand3061controls)hadMonaghan’sPEWS.Forafair comparison,thepredictionresultsforMonaghan’sPEWSwere cal-culatedonlyontheencountersthathadanon-missingMonaghan’s PEWSvalue.
2.6. Timestampexperiment
In order to assess the robustness of our logistic regression model,weevaluateditusingavailableclinicalmeasurementsat differentpointsofthefirst24-hafteradmission.Specifically,we ranthemodel24timesusingcumulativeclinicalmeasurementsin eachhourofthefirst24-hafteradmissiononthetrainingset(i.e., 946samples).
3. Results
3.1. Predictionresultsusingbaselines
Table2showstheresultsofBedsidePEWSatscore7and Mon-aghan’sPEWSatscore 2.These cut-pointsweredeterminedby
Table3
Variablesusedinthefinallogisticregressionmodel.
Variable Oddsratio P-value
Oldesttemperature≤36 0.78 0.222
Mostrecenttemperature≥38b 1.52 <0.001
Minimumtemperature≤36b 0.41 <0.001
OldestsystolicbloodpressureC4a 72.91 0.207
MostrecentsystolicbloodpressureC1a 0.67 0.070
MaximumsystolicbloodpressureC1a,b 1.57 <0.001
MinimumsystolicbloodpressureC4a,b 25.47 <0.001
MeansystolicbloodpressureC1a,b 0.47 <0.001
Mostrecentoxygensaturation>94b 0.43 <0.001
Maximumoxygensaturation>94 8.42 0.105 Minimumoxygensaturation≤90b 1.80 0.021
MostrecentheartrateC1a 0.61 <0.001
MostrecentheartrateC3a,b 3.07 <0.001
MostrecentheartrateC4a,b 22.78 0.031
MaximumheartrateC3a,b 0.58 <0.001
MinimumheartrateC4a,b 24.22 0.002
MeanheartrateC4a,b 2.68 0.039
MinimumrespiratoryrateC4a,b 3.10 <0.001
MeanrespiratoryrateC4a,b 4.55 <0.001
LevelofconsciousnessHighriskb 7.16 0.005
Isthepatientexperiencingpain?Yesb 1.97 <0.001
Cardiacwithinnormallimitsb 0.28 <0.001
Neurologicwithinnormallimitsb 0.26 <0.001
Tissueperfusionandoxygenationadequateb 89.04 <0.001
Tissueperfusionandoxygenationextremely compromised
28.65 0.246
AcuitylevelLevel3 1.52 0.611 AcuitylevelLevel4b 1.26 <0.001
WorkofbreathingHighriskb 8.60 0.049
Perfusioncaprefill<3sb 2.10 0.031
aSeeTable1.
bIndicatesvariablessignificantlyassociatedwithPICUtransfer.
logisticregressionwiththreshold0.5toguaranteeafair compari-son.
3.2. Predictionresultsusinglogisticregression
Weincluded29variables associatedwith13ofthe16 clini-calelements,inthefinalmodelbytheforwardstepwiseapproach (Table3).Ofthe29variables,23weresignificantlyassociatedwith PICUtransfer(P<0.05).TheresultsarepresentedinTable2.
3.3. Resultscomparison
Table2 presentstheperformance ofthedifferentpredictive methods. In comparison tothe BedsidePEWS and Monaghan’s PEWSinthetestset,ourmodel’sAUCandspecificitywere statis-ticallysignificantlyimproved.Ourmodel’ssensitivitynumerically improvedby15.4and24.1%inthetestset,buttheseimprovements werenotstatisticallysignificant.Wehypothesizethattherelatively smallnumberofcasesinthetestsethinderedthedetectionof sta-tisticalsignificance.ThePPVofourmodelwas8.1%,overtwicethe valueofthatfoundinourdatasetofthetwoPEWS.Asaprevious study25described,thebigdecreaseofPPVinthetestsetwascaused bythedominationofcontrols.
3.4. Timestampexperiment
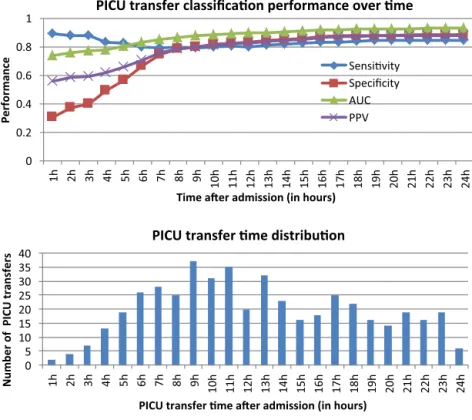
Fig.3 (top)showstheperformanceofourlogisticregression modelondifferentpoints(from1to24h)afteradmission.Wecan seethatAUCincreasessignificantlyinthefirst6handreachesthe plateauafter7h,whichmeansthatourmodelcanperformagood predictionusingtheclinicalmeasurementsoffirst7hafter admis-sion.ThebottomofFig.3displaysthePICUtransferdistribution forthe473casesinthetrainingset.TheaverageandmedianPICU
transfertimesare11.7and11hrespectively,and79%admissions aretransferredtoPICUafter7h.
4. Discussion
WeusedexistingclinicaldataintheEHRandmachine learn-ingtodevelopandvalidateapredictionalgorithmforPICUtransfer ofhospitalizedpatientsinthefirst24h.Throughaprocessusing expertclinicianopinion,categorizationandmachinelearning,we builtamodelconsistingof29variablesforpredictingPICU trans-fer.Ouralgorithmachieveda0.912(95%CI0.905–0.919)AUCin thetestset.Thisresultwasstatisticallysignificantlyhigherthan applicationoftwoexistingPEWSinourtestdataset.Unlike previ-ousPEWSwhichusedanumberofsub-scorestocreateanoverall scorewithvariouscut-points,weusedlogisticregressionsothat theoutputwasapercentagelikelihoodofPICUtransfer.Withthis approachwewereabletoachieve0.849sensitivityand0.859 speci-ficity.
Our predictionalgorithmperformedsignificantly betterthan twopublishedPEWSthatwerebasedondynamicclinicalelements, suchasvitalsigns.Onereasonforthisfindingisthatweused29 variablesfrom16clinicalelementsascomparedto3–7variablesin PEWSwithwhichwecompared.Ourvariablesincludedvitalsigns, whichbothotherscoresemploy.Wealsoincludedlevelof con-sciousness,painassessments,andworkofbreathingthateachmet twoimportantcriteria:(1)facevalidityinassociationwith wors-eningpatientstatusthatmightprecedePICUtransfer,and(2)were obtainedbyournursesinthecourseoftheirusualclinical assess-ments.Withtheexceptionofonevariable(capillaryrefill)eachof ourvariableswasavailablein>70%ofencounters,withthe major-itybeingpresentin>90%oftheencounters.Atourcenter,these datadidnotrequireanextrareportingstructure,additional clini-calassessments,orresearchnurses.EachwaspresentintheEHR forclinicalcare,butwebelieveeachwaspoorlyleveragedinthe courseofcareinidentifyingandpredictingpatientrisk.
Thetimestampexperimentshowedthatclinicalmeasurements takeninthefirst7hweresufficientforourpredictions.Wefound arelativelylowPPVastransfertothePICUinthefirst24hisan uncommonevent.Aswebelievethecostofafalsenegativeis con-siderablyhigherthanafalsepositive,relativelylowPPVmaybea tolerabletrade-off.
Our prediction algorithm can be integrated into our rapid response system to identify patients at elevated risk for PICU transfer. Current mechanisms to trigger or activate the rapid response systemhave limitations.6 Earlywarningscores repre-sentaquantitativeandthemostextensivelyvalidatedmechanism toactivate,butotheractivationmechanismsincludingsubjective nurse,family,orphysicianconcernsarealsoused.These subjec-tivemechanismshavelimitationsregardingvalidityandreliability, andtodate,PEWSarelimitedbythemodestnumberofelements from which a score canbe generated. Our methodof machine learning/logisticregressionallowsanoutputofthepercentage like-lihood of PICU transferto becalculated for analmost limitless numberofclinicalelements.Whilethebestwaytousethis out-putwillneedtobedeterminedprospectively,webelievearapid responsesystemcouldhavemultiplethresholdsbasedonthe per-centage likelihood. For example,ifthe likelihoodwere >50%of PICUtransferwithin24h,this maypromptanautomaticcallof themedicalemergencyteamformultidisciplinaryassessment.A scoreof>25%mighttriggerabedsideevaluationbytheprimary medicalteamandarecalculationofpredictionwithin2h.An out-putof>95%mightputinmotion, throughclinicaldecisionaids, aprocessthatmakesimmediatePICUtransferthedefaultaction andaphysicianwouldneedtotakeactiveactiontoavoidsucha result.
0 5 10 15 20 25 30 35 40 1h 2h 3h 4h 5h 6h 7h 8h 9h 10h 11h 12h 13h 14h 15h 16h 17h 18h 19h 20h 21h 22h 23h 24h
Number of PICU transfers
PICU transfer me aer admission (in hours)
PICU transfer me distribuon
0 0.2 0.4 0.6 0.8 1 1h 2h 3h 4h 5h 6h 7h 8h 9h 10h 11h 12h 13h 14h 15h 16h 17h 18h 19h 20h 21h 22h 23h 24h Performance
Time aer admission (in hours)
PICU transfer classificaon performance over me
Sensivity Specificity AUC PPV
Fig.3.Timestampexperimentresults.
4.1. Limitations
Missingdatawasamajorcauseofincorrectpredictionandwe needtodevelopaproperimputationmethodology.Inthecurrent study,weusedaverysimplemethodtoaddressthechallengesof missingdata.Wewillimplementmorecompleximputation meth-odsinourfuturework.Imputationwillbeespeciallyimportant becauseaswewilladdmorevariablestothemodel,theadditional variableswillincludemissingvaluesmorefrequently.
TransfertothePICU,whileaclinicallyimportantevent,does havesomelimitationsasitmaybedriveninpartbynon-patient factorssuchasPICUbedavailability.Infuturestudies,insteadof focusingexclusivelyontheneedforPICUtransferasadependent variable,wewillpredictthedeteriorationofhospitalizedchildren’s clinicalstatusandwillincludeothervariables(e.g.callingamedical emergencyteam,nurseorphysicianidentificationashighrisk)as dependentvariables.
Inthisstudy,alltheclinicalelementshadamuchhigher per-centageofavailabilitythaninpreviousstudies.Thehighpercentage of available clinical measures provided the bases for applying machinelearningtodetect24-hPICUtransfer.Thismayreduce thegeneralizabilityofourfindingsincenterswithmorefrequently missingdata.Infuturestudies,wewillpartnerwithotheracademic andnon-academicchildren’shospitalstovalidateouralgorithm ina diversesetof institutionsona prospectivesetof patients. Althoughour algorithm was created in thefirst 24h, applying itafter24hisquitestraightforward.Similarlytothetimestamp experiment,weneedtoregeneratethevalueofeachvariableevery fewhours(e.g.,1,2,4)andusethemodeltocalculatethe probabil-ity.However,theeffectivenessofthisapproachneedstobeverified onprospectivedata.Thedeteriorationofhospitalizedchildrenisa complicatedphenomenonwithavarietyofclinicalantecedentsand causes.AprolongedseizurethatresultsinPICUtransferhasa differ-entpathophysiologyandlikelydifferentclinicalantecedentsthan worseningrespiratorydistressinpneumonia.Inourcurrentstudy, weonlytested16clinicalelementsforprediction.Weincluded
just one static element (presence of developmentaldelay) and 15dynamic elements. Whilewe believedynamic elementswill likelybemoreusefulinpredictingPICUtransferintheshortterm, wesuspectfurtheradditionofstaticelementssuchasaneedfor medicaltechnologywillimprovepredictionaccuracy.Wedidnot includelabtestresults,andanearlierworkhasexploredthe pre-dictivepotentialof labtests andmedications for patientstatus deterioration.26Infutureworks,wewillincludemanymoredata pointsforthepatientssuchaslabtests,medications,diagnostic history,socialhistory,andfamilyhistory.
5. Conclusion
Onaretrospectivedatasetwesuccessfullydevelopedalogistic regressionalgorithmthatutilizedtheEHRcontenttopredictPICU transferforpediatricpatients’firstdayofhospitalization.Thenovel algorithmachievedhighersensitivity,specificityandAUCthantwo ofthecurrentPEWSreportedintheliterature.
Authorcontributions
IS,PBandHZdesignedthestudy.HZrantheexperiments, ana-lyzedtheresults,createdthetablesandfigures,andcontributed tothedraftandfinalmanuscript.QL,TL,DWandYNcontributed ideasforalgorithmdevelopment.TheprojectwassupervisedbyIS. ThefirstdraftofthemanuscriptwaspreparedbyHZ,IS,andPB withadditionalcontributionsbyallauthors.Allauthorsreadand approvedthefinalmanuscript.
Funding
TheauthorsweresupportedbyinternalfundsfromCincinnati Children’sHospitalMedicalCenter.HZ,QL,TL,YN,andISwere par-tiallysupportedbygrants5R00LM010227-05,1R21HD072883-01, and1U01HG006828-01.
Conflictofintereststatement
Noconflictofinterestforanyoftheauthors. References
1.GhaferiAA,BirkmeyerJD,DimickJB.Variationinhospitalmortalityassociated withinpatientsurgery.NEnglJMed2009;361:1368–75.
2.SilberJH,KaestnerR,Even-ShoshanO,WangY,BresslerLJ.Aggressivetreatment styleandsurgicaloutcomes.HealthServRes2010;45:1872–92.
3.NadkarniVM,LarkinGL,PeberdyMA,etal.Firstdocumentedrhythmandclinical outcomefromin-hospitalcardiacarrestamongchildrenandadults.JAmMed Assoc2006;295:50–7.
4.ScheinRM,HazdayN,PenaM,RubenBH,SprungCL.Clinicalantecedentsto in-hospitalcardiopulmonaryarrest.Chest1990;98:1388–92.
5.Jones DA, DeVita MA, Bellomo R. Rapid-response teams. N Engl J Med 2011;365:139–46.
6.DeVitaMA,SmithGB,AdamSK,etal.“Identifyingthehospitalisedpatientin crisis”–aconsensusconferenceontheafferentlimbofrapidresponsesystems. Resuscitation2010;81:375–82.
7.Bradman K, Borland M, Pascoe E. Predicting patient disposition in a paediatric emergency department. J Paediatr Child Health 2012,
http://dx.doi.org/10.1111/jpc.12011.
8.Petrillo-AlbaranoT,StockwellJ,LeongT,HebbarK.Theuseofamodified pedi-atricearlywarningscoretoassessstabilityofpediatricpatientsduringtransport. PediatrEmergCare2012;28:878–82.
9.SweneyJS,PossWB,GrissomCK,KeenanHT.Comparisonofseverityofillness scorestophysicianclinicaljudgmentforpotentialuseinpediatriccriticalcare triage.DisasterMedPublicHealthPrep2012;6:126–30.
10.ParshuramCS,BaylissA,ReimerJ,MiddaughK,BlanchardN.Implementingthe BedsidePaediatricEarlyWarningSysteminacommunityhospital:aprospective observationalstudy.PaediatrChildHealth2011;16:e18–22.
11.SkaletzkySM,RaszynskiA,TotapallyBR.Validationofamodifiedpediatricearly warningsystemscore:aretrospectivecase-controlstudy.ClinPediatr(Phila) 2012;51:431–5.
12.ParshuramCS,DuncanHP,JoffeAR,etal.Multicentrevalidationofthe bed-sidepaediatricearlywarningsystemscore:aseverityofillnessscoretodetect evolvingcriticalillnessinhospitalisedchildren.CritCare2011;15:R184.
13.AkreM,FinkelsteinM,EricksonM,LiuM,VanderbiltL,BillmanG.Sensitivity ofthepediatricearlywarningscoretoidentifypatientdeterioration.Pediatrics 2010;125:e763–9.
14.DemmelKM,WilliamsL,FleschL.Implementationofthepediatricearlywarning scoringsystemonapediatrichematology/oncologyunit.JPediatrOncolNurs 2010;27:229–40.
15.Parshuram CS, Hutchison J, Middaugh K. Development and initial vali-dation of the Bedside Paediatric Early Warning System score. Crit Care 2009;13:R135.
16.TuckerKM,BrewerTL,BakerRB,DemerittB,VossmeyerMT.Prospective evalu-ationofapediatricinpatientearlywarningscoringsystem.JSpecPediatrNurs 2009;14:79–85.
17.RobsonMA,CooperCL,MedicusLA,QuinteroMJ,ZunigaSA.Comparisonof threeacutecarepediatricearlywarningscoringtools.JSpecPediatrNurs2012,
http://dx.doi.org/10.1016/j.pedn.2012.12.002.
18.EdwardsED,PowellCV,MasonBW,OliverA.Prospectivecohortstudytotest thepredictabilityoftheCardiffandValepaediatricearlywarningsystem.Arch DisChild2009;94:602–6.
19.DasS,EisenbergLD,HouseJW,etal.Meaningfuluseofelectronichealthrecords inotolaryngology:recommendationsfromtheAmericanAcademyof Otolaryn-gology–HeadandNeckSurgeryMedicalInformaticsCommittee.Otolaryngol HeadNeckSurg2011;144:135–41.
20.JhaAK.Thepromiseofelectronicrecordsaroundthecornerordowntheroad? JAmMedAssoc2011;306:880–1.
21.SittigDF,WrightA,OsheroffJA,etal.Grandchallengesinclinicaldecision sup-port.JBiomedInform2008;41:387–92.
22.Grzymala-BusseW,HuM.Acomparisonofseveral approachestomissing attributevaluesindatamining.In:Proceedingsofthesecondinternational con-ferenceonroughsetsandcurrenttrendsincomputingRSCTC’2000.2000.p. 340–7.
23.VenablesWN,RipleyBD.ModernappliedstatisticsstatisticswithS-PLUS.4hed. NewYork:Springer;2002.
24.MetzCE.BasicprinciplesofORCanalysis.SeminNuclMed1978;8:283–98.
25.LalkhenG,McCluskeyA.Clinicaltests:sensitivityandspecificity.CritCarePain 2008;8:221–3.
26.BonafideCP,HolmesJH,NadkarniVM,LinR,LandisJR,KerenR.Development ofascoretopredictclinicaldeteriorationinhospitalizedchildren.JHospMed 2012;7:345–9.