8.1
THE SETTING
The power supply in Zimbabwe is sourced from local generation and imports. The domestic generation comes from Kariba Hydropower, Hwange coal-fi red power Station, and three small thermal power plants. Supplementary power is imported from Mozambique, Democratic Republic of Congo (DRC), and Zambia. There have been very large reductions in the supply of power within Zimbabwe in the past decade. The domestic generation has been reduced owing to lack of regular maintenance and imports have been cut back because of the inability of Zimbabwe Electric Supply Authority (ZESA) to settle its bills regularly. Because electricity is fundamental to Zimbabwe’s economic and social development, the persistent lack of adequate and reliable supply has resulted in signifi cant losses to the economy. The shortage of power supply has affected people’s quality of life and business and industrial development, contributing to the economic decline of the country over the past decade. An effi cient and viable electricity sector will assist economic stability and growth, given its forward and backward linkages with the rest of the economy. A reliable electricity energy source has a direct bearing on national income, hence ensuring uninterrupted production essential for sustained economic growth.
8.1.1 Institutional Arrangements for the Energy Sector
The energy sector in Zimbabwe is supervised by the Ministry of Energy and Power Development (MEPD). The mandate of the Ministry includes policy formulation, performance monitoring and regulation of the energy sector, as well as research and promotion of new and renewable sources of energy and energy conservation. It supervises the activities of the various specialized agencies and parastatals with responsibilities in the energy sector (see Chart 8.1). In conjunction with the Zambian Ministry of Energy and Water, the MEPD supervises
CHAPTER 8:
Rehabilitation and Recovery in the Power Sector
the Zambezi River Authority (ZRA) which operates, monitors and maintains the Kariba Dam complex and other dams on that part of the Zambezi River shared by Zambia and Zimbabwe.
A new Electricity Act was enacted in 2002 bringing about the restructuring and unbundling of ZESA from a vertically integrated utility into separate successor companies under ZESA Holdings. The companies included: Zimbabwe Power Company (ZPC), responsible for all generating stations and for the supply of power to the transmission grid, Zimbabwe Electricity Transmission Company (ZETCO), Zimbabwe Electricity Distribution Company (ZEDC), and Powertel which was primarily responsible for providing communication services to the power companies, but was to use excess capacity in the grid to offer data services to the public.
The Rural Electrifi cation Fund Act of 2001 was passed in January 2002.The Act established the Rural Electrifi cation Agency (REA), mainly responsible for grid extension in rural areas and for supplying specifi c institutions, such as schools, clinics, government offi ces, and community-initiated projects. REA covers the cost of its operation through levies on electricity and petroleum sales and from fi nancial support it receives from Government and donors. As of end October 2010, REA had electrifi ed more than 6,000 rural centers, including schools, health centers, government offi ces, businesses, and irrigation schemes in the rural areas covering the eight regions in the country.
The Electricity Act also provided for the establishment of an autonomous regulatory body that would encourage investment in the power sector by putting in place an appropriate regulatory framework harmonized with those of the Southern Africa Development Community (SADC) countries and through strategic partnerships. Accordingly, the Zimbabwe Electricity Regulatory Commission (ZERC) was established in 2005. It reports to the Minister of Energy and Power
Development. The mandate of ZERC includes promotion of competition and private sector participation in the power sector, licensing and regulation of businesses engaged in generation, transmission, distribution, and
supply of electricity, arbitration and mediation of disputes, establishing operating codes and standards for the sector and issuing guidelines, and advising stakeholders about electricity services.
In January 2010, ZETCO and ZEDC were merged into a single company, the Zimbabwe Electricity Transmission and Distribution Company (ZETDC), which is now responsible for transmitting and distributing electric power and for its sale, including meter reading, billing, cash collection, and credit control of the retail business. It is also responsible for regional trade in power. In addition to these government entities, a number of independent private producers (IPPs) are active in power generation in Zimbabwe. The Nyamingura IPP (a 1.1 MW hydroelectric plant) and the Charter IPP (500 MW co-generation plant) both sell power to the national grid. Other small IPPs dispose of their power independently.
8.1.2 Policy Framework for the Power Sector
The Government has drafted a revised National Energy Policy (NEP) Paper which seeks to promote supply and utilization of energy, in particular the use of indigenous sources of energy, for socioeconomic development in a safe, sustainable, and environmental friendly manner. The main objectives and policy measures as outlined in NEP are set out on Box 8.1 below. The policy paper is well formulated and addresses the policy issues related to the current unsustainable operation of the electricity supply industry. The Policy Paper is to be approved by the Cabinet by end of 2011.
Zimbabwe is a signatory to the SADC Protocol on Energy and one of 12 operating members of the Southern African Power Pool (SAPP). In line with regional trends towards the establishment of an all encompassing energy sector regulator, the MEPD is in the process of drafting the Energy Amendment
Bill which seeks to synchronize the Petroleum Act, the Electricity Act, and other renewable energy acts that will provide for, among others, the setting up of an energy regulator to harmonize regulation in the energy sector as a whole. The functions of the ERA are described in some detail in Chapter 4 of this Report.
Box 8.1: Main Elements of the National Energy Policy Policy Objectives
• Ensure availability, affordability and accessibility of electricity for all consumers
• Provide a platform for adequate and reliable access to electricity to all at competitive prices
• Allow access to IPPs and Private-Public Partnerships (PPPs), Private Public Associations (PPAs), and other joint ventures.
NEP Policy Measures
• Maintain a dynamic system development planning process
• Facilitate effi cient use of existing infrastructure
• Classify vandalism of transmission and distribution systems as economic sabotage
• Promote and protection of private sector participation in the electricity sector
• Adopt a pricing mechanism for electricity that is cost refl ective
• Adopt energy effi ciency on the supply side
• Promote regional and international integration and co-operation
• Improvement of investment opportunities to attract partnerships and mitigate costs of capital intensive power projects
• Develop local capacity for manufacturing of electricity equipment
• Observe environmental regulations in all power sector projects
8.1.3 Pricing Policy for Electricity Services
Pricing policy for electricity services is an important issue in Zimbabwe. The regulatory authority for the sector, ZERC, is responsible for the design of the pricing policy and, after consultation with the MEPD, sets prices and tariffs. A number of principles have
been established for the pricing of electric power. The standard tariff structure in place at present distinguishes between residential users who pay a fi xed charge and a variable increasing-block charge based on the level of consumption. The fi rst 50kWh per month for all resident users is subsidized at one US cent per kWh. Low demand non-residential users pay a mix of a fi xed rate and fl at variable rates. High demand non-residential users pay a combination of fi xed and capacity charges and a variable seasonal price; the latter includes a standard price and prices for on-peak and off-peak usage. The value of off-off-peak and standard charges, at 2 US cents and 3 US cents per kWh respectively, are very low in comparison with the average tariff of 6.5 US cents per kWh.
Existing pricing policy calls for setting tariffs on a cost-plus basis. In practice, tariffs are revised once a year to cover operating costs
and some capital expenditures. In 2009, the average end-user tariff for ZESA is estimated at 6.5 US cents per kWh, while the economic cost of service provision was estimated at 9.8 US cents per kWh.1 The price of electricity in
Zimbabwe is also low in comparison to tariffs set by a number of other countries in the region. As Figure 8.1 indicates, the average tariff in the region is in the range of 8-9 US cents per kWh. There is a case for providing certain groups in Zimbabwean society with access to affordable, low-cost power. However, as the subsequent analysis of the fi nancial performance of the power utilities indicates, the provision of subsidies for almost all users in Zimbabwe has serious consequences for the fi nancial position of the utilities, given that the government does not compensate the utilities for these heavily subsidized prices.
8.2
ENERGY RESOURCES
AND EXISTING POWER
GENERATION
8.2.1 Energy Resources
In 2004, fuel-wood resources in accessible woodlands covered about 20 percent of the total land area, representing a stock of 320 million tons, with a sustainable yield of 13 million tons per annum. Total national fuel-wood consumption is estimated at around 9.4 million tons per annum. On a national level, the sustainable yield can meet Zimbabwe’s total fuel-wood needs. While problems of resource depletion are partly regional, there is increasing trade from fuel-wood surplus to defi cit and urban areas.
Fuel-wood availability is complemented by the availability of biomass-based renewable energy technologies such as timber waste, urban waste, bagasse, and biogas. Over 70,000 tons of biomass waste is produced annually
from timber plantations, and more than 2.5 million tons of household and industrial wastes are produced per annum in urban areas. Some of this waste material has the potential to fuel power plants to create electricity or other forms of energy. Bagasse is currently used to generate 72.5 MW of electricity in the Lowveld. Biogas offers an option for supply of household and agro-industrial energy in Zimbabwe. More than 400 biogas digesters have been installed in Zimbabwe, which range in capacity from 3 cubic meters to 16 cubic meters.
Zimbabwe has no proven oil reserves. All refi ned oil products are imported and the bulk of liquid fuels are used in the transport sector. Most imported petroleum products are piped over 280 km from Beira port in Mozambique to the receiving terminal at Mutare in Zimbabwe. The oil products are further transported over 260 km to the main consumption centre in Harare. The piping facility is used by the National Oil Company of Zimbabwe (NOCZIM) and about 70 private companies operating in the country. The import capacity of the pipe is about 108 million liters per month while the average import in 2009 was 30 million liters per month (about 30 percent of capacity) against the breakeven import of 67 million liters per month. It is therefore economically justifi ed to consider using the spare capacity to wheel oil products to neighboring countries. The country’s main storage depots, which have a total capacity of about 538,000 cubic meters, are located in Mutare and around Harare.
Zimbabwe is endowed with a wide variety of conventional energy sources for electricity generation, of which the main ones are coal, hydro, and coal-bed methane. Coal reserves are estimated at about 10.6 to 26 billion tons in situ in 21 deposits, of which some 2 billion tons are considered mineable by opencast methods. To date, only 3 million tons per annum of the coal resources are used to generate power at
1 The under-pricing of electricity in Zimbabwe is a long-standing issue. According to the World Bank (2010), the
average tariff was 2.6 US cents per kWh in 1996-97, while the fully loaded cost to cover operations and capital development programs was estimated at 6 US cents per kWh.
Hwange power plant and the small power plants in Bulawayo, Harare, and Munyati. Zimbabwe is also endowed with coal bed methane deposits, which are located at Lupane, Chiredzi, Hwange, and Beitbridge, estimated at more than 600 billion cubic meters. These can also be used for generation of electricity.
Other available renewable energy sources include hydroelectricity, solar radiation, and wind. Hydropower potential on the Zambezi River, to be shared equally between Zimbabwe and Zambia, is estimated at 37 TWh per annum, of which about 10 TWh per annum have been harnessed. Potential for small-scale
hydropower also exists in Zimbabwe. Because of the terrain and rainfall pattern, the small hydropower potential is mostly concentrated in the Eastern part of the country. Solar radiation is available at an average of 2,000 kW per hour per square kilometer per annum, spread over roughly 3,000 hours per annum. At this rate, photovoltaic cells could generate the current total electrical energy consumption of 10,000 GWh with effi ciency of 10 percent and by installations covering 1.3 percent of Zimbabwe’s total surface land area. There is also considerable potential for wind energy, particularly for water pumping.
Map 8.1. Electric Power Transmission Grid of the Southern African Region
8.2.2 Domestic and Regional Power Generation Capacities
Electricity supplied by ZESA is generated through one hydroelectric station and four thermal power stations with a combined installed capacity of 1,960 MW (Table 8.1). The power stations include: Kariba South
Hydro-power (750 MW), Hwange Thermal Power Station (920 MW), Harare Thermal Power Station (80 MW), Munyati Thermal Station (80 MW), and Bulawayo Thermal Power Station (90 MW). The thermal power stations are all coal fi red. Both the hydropower and thermal power stations are old: the small thermal plants were commissioned in 1942-57,
Kariba in 1959-62, and Hwange in 1983-87. The most reliable plant is Kariba hydropower station, which has an available capacity of 746 MW. The supply form Hwange power station is intermittent, primarily owing to the age of the plant and lack of regular maintenance. The operation of three small thermal power plants has been sporadic because their high generation
cost (the cost of these plants is double that of the Hwange plant) resulting from old age (over 60 years), lack of up-keep, and an unsteady supply of coal. The location of electricity generation potential and the existing power generation stations in Zimbabwe are shown in Map 8.2.
As can be seen from Table 8.1, the average availability of the power stations during the past decade was 64 percent, with a range between 53 percent and 72 percent. The age of the power stations, coupled with lack of their regular maintenance due to a shortage in fi nancial resources, contributed to these low availability levels.2 Load shedding of
customers is a daily occurrence because of lack of domestic generation at the Hwange Power Plant, sometimes running at about 10 percent of installed capacity. In the absence of other sources of power, on some occasions up to 600 MW has had to be curtailed to ensure the safe operation of the system.
2 Stage II Units which had been overhauled in 2003 were supposed to be overhauled after 55,000 service hours were overhauled in 2007 after 77,000 service hours.
In 2007, ZESA borrowed US$ 40 million from NamPower (Namibian Power Utility) to maintain Stage II units (Units 5 and 6) with an agreement that ZESA would service the loan by supplying NamPower with a fi rm capacity of 150 MW for fi ve years. This supply of power to NamPower puts an additional burden on generation shortage for domestic supply.
Zimbabwe is an operating member of the Southern Africa Power Pool (SAPP). Because of its geographic location, Zimbabwe’s power network infrastructure is also vital to the movement or “wheeling” of power to and from neighboring countries within the pool. The domestic generation is augmented by imports. As Table 8.2 indicates, over the last 10 years Zimbabwe imported 29 percent of its power supply from the neighboring countries (with annual dependence on imports ranging from 21 percent to 42 percent). These supplies came mainly from Mozambique, Democratic Republic of Congo (DRC), Zambia, and South Africa. More recently, imports from the
neighboring countries have been substantially reduced because of shortages of power in the region. The availability of imports is further constrained by existing arrears in import payments by ZETDC to suppliers. The continued existence of the arrears has put ZETDC in a weak position to negotiate for future contracts, given that other more profi table and arrears free utilities are competing for the same power. The net effect has been that ZETDC imports what it can afford.
8.2.3 Status of Current Supply Capacities
Domestic power generation in Zimbabwe is mainly from Hwange Thermal Power Plant and Kariba Hydropower Plant. Kariba is the most reliable power station with available capacity of 746 MW. Hwange has been experiencing frequent outages because of lack of regular maintenance which sometimes limits the output to 100 MW. Normally, the small power plants at Harare, Bulawayo, and Munyati
have not been running owing their lack of
maintenance and high operational costs. The cost of generating power from these power plants is about double the average tariff.
With aggressive measures taken by ZPC, the domestic power generation in September 2010 improved signifi cantly compared with the situation prevailing in May. Hwange power station, which had been running one out of six units (generating 100 MW) in May 2010, was running fi ve units generating 560 MW in September 2010. Kariba hydropower plant which was under the yearly programmed maintenance in September 2010 was generating 650 MW only. At the same time, ZPC was running one of the two units of Munyati power
station generating about 32 MW in spite of high operational costs. At that time, ZETDC could only import a fi rm supply of 150 MW from Mozambique. Out of the supply available from domestic generation and import, ZPC had to provide NamPower (Namibia) 150 MW to meet the agreed payment arrangements for the loan provided by the Namibian utility to rehabilitate Hwange power station. Hence, the net power available to the national grid was 1,242 MW, which was 72 percent of the demand of 1,730 MW (Figure 8.2).
The implication was that 488 MW had to be curtailed to safeguard the operation of the system and avoid total system collapse that invariable occurs when supply does not match demand. The response to the power shortages has been to import power from other regional utilities. However, tapping this source of supply has been constrained by shortage of power in the region and fi nancial limitation in ZETDC to settle its import bills. Hence, load shedding of customers is a daily occurrence because of the shortage of domestic generation and constraints to import from the region.
It is expected that ZPC will shortly put in service the last unit (160 MW) in Hwange power station and this will augment the fi rm supply from the power station to 720 MW. Kariba will provide its regular supply of 746 MW when the ongoing regular maintenance is complete. ZPC intends to rehabilitate the Harare and Munyati thermal plants in partnership with the mining/ industrial customers. Under the arrangement, the power plants will be rehabilitated with funding from the mining/industrial customers to be ring-fenced to supply these customers at cost refl ective tariffs. When this arrangement is realized ZPC will generate 64 MW (80 percent of 80 MW) from each power station. ZPC is also negotiating with Botswana Power Corporation (BPC) for BPC to fi nance the rehabilitation of Bulawayo power plant (90 MW). It is expected that the rehabilitation of Bulawayo plant will provide 72 MW (80 percent of 90 MW). Under this arrangement, the two utilities will equally share the output of the plant until 2012 when Botswana will be able to meet its demand by commissioning Morupule power station. With implementation of the measures indicated above, the domestic generation would reach 1,592 MW, raising the domestic generation availability to 83 percent. In the immediate future, ZPC is expected to maintain the current level of import of about 150 MW from Mozambique and at least 50 MW from DRC, when the contract terminated in 2010 is reinstated. After allowing for exports of 150 MW to Namibia and 36 MW
to Botswana, the available supply for the national grid in 2011 will be about 1,610 MW, equivalent to 84 percent of the domestic demand of 1,921 MW projected for 201. This power demand forecast does not include the reserve margins specifi ed in the Operation Rule of SAPP, which requires member countries to retain a reserve margin equal to 10.6 percent of thermal generation capacity plus 7.6 percent of hydropower generation capacity. Measures that can be taken to augment supply in Zimbabwe in the short-term will be through implementation of demand side management and accessing power available under the SAPP short-term trade mechanism.
8.3
ENERGY DEMAND AND
ELECTRIFICATION
8.3.1 Energy ConsumptionIn 2004, fi nal energy consumption in Zimbabwe was estimated at 6.94 million tons of oil equivalent (toe). The main energy consumption is drawn from wood and coal, which is mostly used by households, accounting for 47 percent. The next largest type of energy consumption was coal and coke, accounting for 21 percent, followed by motor fuels accounting for 20 percent. Electricity, which is used exclusively by industrial and public services, accounted for 12 percent. In terms of end use consumption by sector, the residential sector accounted for 47 percent followed by industry (19 percent), transport (15 percent), agriculture (11 percent), commerce (4 percent), mining (3 percent), and others (1 percent).
8.3.2 Current Trends in Electricity Consumption
There are a number of estimates for the current level of electrifi cation in Zimbabwe. ZETDC reports that 81 percent of urban households and 10 percent of rural households had access to electricity in 2009. Analysis undertaken for this Report indicates that the foregoing urban and rural electrifi cation rates imply that
about 37 percent of Zimbabwe’s population had access to electricity in 2009—a relatively high level of access compared with many Sub-Saharan countries. The average electrifi cation level in the Southern Africa region is estimated at 30 percent. However, the draft NEP referred to in Box 8.1 reports that the national electrifi cation rate is about
3 Annex 4 includes a detailed discussion of these various electrifi cation rates and sets out the basis for estimates for the national electrifi cation rates used in this Report.
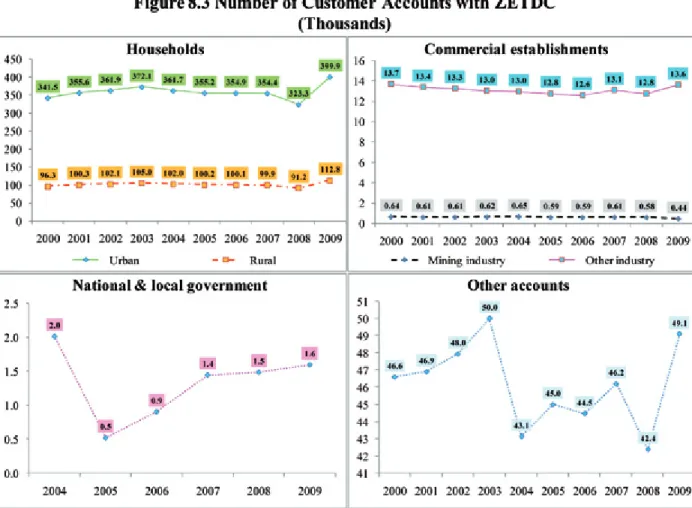
40 percent, with the rural electrifi cation rate at a little below 20 percent. These estimates imply an urban electrifi cation rate of 76 percent, which is somewhat lower than that reported by ZETCO. For the purposes of this Report, the urban and rural electrifi cation rates reported by ZETDC have been used in Figure 8.3 below.3
Figure 8.3 presents past trends in customer connections. Total connections to the ZETDC network increased by about 77,105 in 2000-09 reaching about 577,00 in 2009—an average increase of almost 1.6 percent per annum. In the past decade, almost all of the growth in connections came from households. The household connections of 437,860 in 2000 increased to 512,753 in 2009 registering average annual growth of about 1.8 percent. During
the 2004-09 period, there had been fl uctuation in government connections. The number of government connections had decreased from 2,014 in 2004 to 1,597 in 2009, a decline of about 20 percent. The number of business and other connections showed marginal change over the decade with 14,316 in 2000 declining to 14,039 in 2009. The lack of growth in the latter is indicative of the limited operation of the existing business and less progress with
new business formation in Zimbabwe over the
decade. Lack of electricity and its unreliable supply have been major deterrents to private sector investment.
Trends in electricity consumption are presented in Figure 8.4. The overall consumption of electricity over the last decade has decreased at an average of over 3 percent a year. Except the household consumption and that of “other accounts,” the consumption of all accounts decreased. The household consumption marginally increased with average less than 1 percent.
As Table 8.3 indicates, average annual consumption of electricity per connection decreased from about 21,000 kWh in 2000
to about 13,400 kWh in 2009, equivalent to a decline of 5 percent a year. This decline was registered in all consumer categories and stemmed from the decline in economic activity and the inability of ZESA to meet demand for power. The other point about these trends in consumption is that annual consumption of electricity per person in Zimbabwe had declined to about 600 kWh by 2008 (Figure 8.4), which is only marginally higher than the average for all of Sub-Saharan Africa.
8.3.3 Rural Electrifi cation Program
The ongoing rural electrifi cation program was launched in 2001 following the creation of the Rural Electrifi cation Agency (REA). The primary objective of the program has been to extend the power grid to about 10,000 rural public institutions such as schools, rural health centers, government extension offi ces, and farming communities. The full cost of
these extensions was to be covered by the REA program which is funded by levies on electricity use. The locations to be electrifi ed were those with the greatest demographic densities. The total scope of the program involved construction of 25,000 km of 11 and 33 kV distribution lines and installation of 425 MVA substation capacity. The program promotes the economic use of electricity in
rural areas through the development of energy intensive irrigation schemes, and cottage and agroindustries. By October 2010, the REA had extended the grid to 6,083 rural centers across the country, including 1,523 of the 3,891 primary schools in rural areas, 888 of the 1,267 secondary schools, 580 of the 897 rural health clinics in the country. A total of 8,000 km of 11 kV and 33 kV distribution lines had been constructed and 190 MVA of substation capacity had been installed. In addition 222 mini grid solar systems had been installed at remote rural schools and clinics. Final connection of all customers is done by ZETDC, which at end 2009 had 112,806 rural customer accounts.
8.4
MAJOR CHALLENGES IN
THE POWER SECTOR
The electricity sub-sector suffers from unsustainable operations owing to fi nancial constraints as a result of non-cost refl ective tariffs, collection ineffi ciencies, and vandalism of distribution infrastructure. The loss of experienced staff in the last decade also contributed to the sub-standard performance of electricity supply industry. The unsustainable performance of the sub-sector is refl ected in the low investment in infrastructure and sub-standard poor delivery of service.
A substantially improved performance of the power sector is of fundamental importance for sustained economic recovery
in Zimbabwe. The key challenges facing the sector are: (i) to implement a comprehensive program to rehabilitate the existing power sector infrastructure as soon as possible; (ii) to restructure the state enterprises responsible for power supply, transmission, and distribution to improve their fi nancial and technical capacities; (iii) to reduce the under-pricing of power; (iv) to improve the performance of the power utilities by reducing distribution losses and improving cost recovery; and (v) to improve the regulatory and investment framework for the power sector to lay foundations for mobilization of large amounts of private investment in new generation capacity.
8.4.1 Rehabilitation of the Power Sector Infrastructure
The foregoing trends in electricity consumption underscore the extent to which lack of maintenance and rehabilitation in the past decade has eroded to capacity of the power utilities to meet the demand for power. The rehabilitation of the electric power network is widely seen as a high priority for the immediate future. An improved technical and fi nancial performance by the power utilities is critical for sustained economic recovery. The power utilities face numerous challenges in implementing a rehabilitation program, including security of supply, system reliability, and operational and fi nancial constraints that stem from under-pricing of power services to all categories of consumers.
The economic losses from the current power sector crisis in Zimbabwe are large. These are illustrated in Figure 8.5 which shows the monetary value of production gains (in US$) arising from the consumption of 1 kWh of electricity by various sectors.4 It therefore
puts a value on the production losses at the sectoral level that stem from a reduction in supply of one kWh of electricity. In agriculture, mining and manufacturing, the losses to the economy arising from the current inability to meet demand on a continuing basis is signifi cantly higher than ZEDTC’s average tariff of 7.53 US cents per kWh. The implication is that increases in the price of power to cover the full cost of supplying these types of consumers will not undermine the profi tability of production.
8.4.2 Balance between New Domestic Supply and Imports
Key for Zimbabwe in the decade ahead are decisions on the balance to be struck between increased domestic investment in new power supply and increased purchase of imported electricity. As Table 8.2 indicates, imports accounted for about 40 percent of total supply in 2000; by the end of the decade, imports had declined from 5,000 GWh a year to about 2,000 GWh a year, and accounted for about 20 percent of total supply. The primary reason for the decline in imports was the increasingly diffi cult fi nancial circumstances of ZETDC and its inability to pay for imported power.
For the decade ahead, demand for power is projected to grow by about 8 percent a year in the base case used for this Report (Figure 8.6). At the present time, the cost of providing electricity from the main thermal plant at Hwange is in the range of 8 US cents a kWh, including about 6 US cents a kWh for the fuel cost of operating the plant. As Table 8.4 indicates, the current prices paid by ZETDC for power imports range from a low of 1.9 US cents a kWh from ZESCO in Zambia to 5.3 US cents a kWh for imports from SNEL in the
DRC. A key issue going forward for Zimbabwe is the trade-off between increased dependence on imports and investment If the projected increase in domestic demand by 2020 is to be met entirely from new domestic generation, an additional 2,300 MW of capacity at an estimated cost of $2 billion (at 2009 constant prices) will be required by 2020. At say, 3.5 US cents a kWh, the annual import cost of the same quantity of electricity would be about $35 million a year.
4 These data are for 1998 data when production fi gures were stable and energy consumption fi gures were normal.
These ratios therefore provide a reliable indication of energy requirements when the economy is functioning normally.
8.4.3 Improve the Performance of the Power Utilities
Regardless of the decisions about what is an acceptable degree of dependence on imported electricity supplies, an essential requirement for the immediate future is to restore the two power utilities, ZPC and ZETDC, to fi nancial health. In the case of ZPC, the issue is to address the current fi nancial problems and through fi nancial and perhaps technical restructuring, and prepare the company for a possible partnership with a strategic investor interested in investment.
Table 8.5 provides an overview of the fi nancial position of the utility in 2009 when the net income of the company was negative. Almost $70 million of the $77 million of current assets are accounts receivable, the bulk of
which were due from the ZETCO and ZEDC. With a current ratio of 0.24, the company had only US 24 cents of current assets for each $1 in current liabilities. Moreover, the average collection period for receivables was 121 days, which is far below the normally acceptable level of 30 to 40 days for collection. As of end 2009, the company had about $200 million of long-term liabilities ($176 million of obligations in arrears that were therefore payable within one year), $144 million of accounts payable (mainly to suppliers of coal for the Hwange Thermal Plant), and more that $120 million in deferred taxes due to the government. The return on equity in 2009 was minus 2 percent. Given these rather serious fi nancial constraints, including a weak cash position and large amounts of long-term debt payable within one year, the ZPC is not able to generate the funds required for the rehabilitation of almost $1 billion of power sector generation assets that it currently owns. In 2009, total spending on maintenance of these assets was about $6 million—less than one percent of the total cost of assets. Under more favorable circumstances, maintenance outlays would be in the range of $30-50 million a year, equivalent to 3-5 percent of the cost of assets. Early action to improve the recovery of the receivables would allow ZPC to generate suffi cient funds to undertake regular maintenance on the generating plants and hence improve reliability of supply and enable gradual clearance of liabilities.
In the case of ZETDC, fi nancial and technical restructuring must ensure that it has the capacity for the unencumbered purchase of electricity from foreign and domestic sources of generation, including IPPs under take-or-pay contract arrangements. As noted earlier, ZETDC was established in January 2010 as a result of a merger of transmission and distribution utilities, ZETCO and ZEDC. Table 8.6 provides a summary view of the fi nancial condition of these two utilities in 2009.
In 2009, both utilities had operating losses, the combined total of which was about $150 million. Net income was also negative. In the case of ZEDC, the number of employees averaged about 5,770 in 2009. With 579,000 customer accounts, there were about 100 accounts per employee. This compares with an international benchmark of 150-250 accounts per employee for a well managed utility. The current assets of the two utilities were about $600 million at end 2009, of which $525 million were accounts receivable. The bulk of these receivables were internal to ZESA Holdings. The distribution utility
had accounts payable of $295 million, most of which was due to ZETCO, and ZETCO had accounts payable of $237 million, most of which were due to ZPC and suppliers of imported electricity. The current ratio of these two utilities averaged 0.63 in 2009; in other words, they only had about 63 US cents for each $1 of current liabilities. The large amount of accounts receivable resulted in a debt ratio of about 100 percent for ZETCO in 2009. These two utilities also had about $220 million of long-term loans at end 2009, all of which were in arrears and therefore treated as payable within one year. In addition, they had about $50 in taxes due to the National Government.
A key challenge for ZETDC in the near term will be to improve substantially its commercial performance. This will require an upgrade of its billing system, the introduction of pre-paid meters, and enforcement of disconnections for seriously delinquent consumer accounts. The earlier mentioned problem of low tariffs for electricity sales is compounded by substantial non-technical losses that further erode the cash position of the utilities. These losses are estimated to account about 11 percent of the operational expenses. Early action is called for on measures that will reduce these losses.
8.4.4 Reduce Under-pricing of Power
As noted earlier, electricity tariffs in Zimbabwe are well below the cost of service delivery. ZETDC’s current average tariff of US$ 0.0753/kWh is about 65 percent of the cost recovery tariff estimated at US$ 0.116/ kWh. A long history of tariffs in Zimbabwe (and elsewhere in the Southern Africa region) at sub-economic levels have not been able to provide the right signals for optimum use of electricity and attraction of new investments. Similarly, the sub-economic tariffs have led to adverse consumer behavior that involved ineffi cient use of electrical power.
The introduction of cost refl ective tariffs will be required to put ZPC and ZETDC on sound fi nancial grounds to become acceptable partners in the PPP arrangements. If the fi nancial position of ZETDC is to be improved, adjustments in power tariffs will be essential. The required adjustments will need to cover the entire pricing structure for various types of customers. An off-peak charge of only 2 US cents per kWh for large industrial consumers, for example, needs to be reviewed and raised. In the course of reviewing the tariff structure, consideration will have to be given to provision of services for low income households at subsidized rates.
Adjustments in tariffs will also ensure that Zimbabwe moves in consonance with other members of SADC and SAPP. The SADC Council of Ministers has given directives for member states to gradually migrate to cost refl ective tariffs on the basis of the agreed regional framework in order to attract private sector investment to the region. The utilities
are now implementing programs to raise tariffs gradually with a target of reaching cost refl ective tariff rates by 2013. SAPP, with the assistance of the DBSA, carried out a tariff study that was designed as a limited scope, fast-track assessment of the tariff setting principles and methods in a sample of SADC member countries. The purpose of the study was to assess the extent to which wide variations in the tariff methodologies among the member countries may be acting as deterrents to regional electricity trade and overall investment in the power sector in the Region. To complement the study, the Regional Electricity Regulator Association of Southern Africa (RERA) has undertaken a review of the tariff setting principles for the region and proposed a migration path towards cost refl ective tariffs. The study seeks to promote the use of cost refl ective tariffs to generate funds to support investment for the new power projects in the region.
8.4.5 Improve the Power Sector Regulatory Environment and Investment Framework
As the consideration in Chapter 4indicates, there is need for adoption of measures that will strengthen the regulatory authority of ZERC and reduce the current overlap between the MEPD and ZERC in regulating the power sector and market. The Electricity Act states clearly that the authority must operate as an independent body, not subject to direction or control of any individual entity or body. However, the Minister exercises considerable infl uence over the operations of ZERC, with Board members being appointed by the President after consultation with the Minister. Chapter 4 includes a detailed discussion of the current regulatory arrangements for the power sector and sets forth actions that may be considered to improve the current institutional arrangements.
8.5
AN ACTION PLAN FOR
THE POWER SECTOR
8.5.1 Projected Demandfor Electricity
ZESA has prepared forecasts for energy and peak power for 2010-20. The projections have been prepared forthree scenarios, including a base caseand low and high alternative scenarios.5 Annex 4.C includes a discussion of
the assumptions used for the different scenarios and the supply-demand balance for the three scenarios. The working assumption used in this Report is that the base case prepared by ZESA would apply for 2011-20. The alternative scenarios are discussed at greater length later in this chapter in the section that deals with risks and uncertainties.
In the base case scenario, the demand for power is projected to grow at an average rate of almost 8 percent per annum over 2010-20 from 8,302 GWh in 2009 to 18,629 GWh by 2020, which translates into a peak capacity of 3,174 MW (Figure 8.6).
8.5.2 Rehabilitation and Expansion of Generation Capacity
ZPC will rehabilitate and renovate the existing Hwange and Kariba power plants and build new power plants during 2011-20. The intention is to
5 The forecast methodology for deriving future energy demand is based on the Model for Analysis of Energy Demand (MAED). This is a standard demand simulation model that has been developed by the International Atomic Energy Agency (IAEA). A description of the MAED methodology is provided in Annex 4.C.
improve the supply situation in the short-term (2010-12) through rehabilitation of the existing plants, and implementation of enhanced DSM measures. In the medium-term, ZESA plans to improve the supply condition through increased domestic generation by adding 300 MW at Kariba South and 600 MW at Hwange and increasing electricity imports from within the region. In the longer term, ZESA will commission Gokwe North coal-fi red plant (1,400 MW) and the 250 MW Lupane gas-fi red plant. The timing for commissioning the
Batoka power plant will depend on the growth in power demand in the decade ahead. In the event that demand is higher than envisaged under the base case, the Batoka plant would need to be commissioned by about 2020. The generation projects identifi ed for short- to medium-term development are presented in Table 8.7. The proposed program has been prepared in line with the criteria adopted by ZESA and takes into account the realization of the DSM program for “virtual power generation”.
As Table 8.7 indicates, the cost of the rehabilitation program is estimated at about $450 million, while the cost of the proposed 2,300 MW of new capacity is put at $1.956 billion (all at 2009 constant prices).
8.5.3 Rehabilitation and Expansion of the Transmission Grid
ZETDC is responsible for the development, operation, and maintenance of the transmission and distribution network in Zimbabwe. The transmission system is made up of 420kV, 330kV, 220kV, 132kV, 88kV and 66kV lines and substations. The transmission lines have a total length of about 7,274 km. Table 8.8 below show the size of transmission and substations. ZETDC will strengthen and extend the transmission and sub-transmission networks over 2010-20.
Rehabilitation of the existing network.
More than 50 percent of substations do not have fi rm capacity. This means that in the event that one fails, large portions of the country will have no power for prolonged periods. Also, new customers cannot be connected owing to lack of transformer capacity at a number of substations. The installation of additional capacity at strategic bulk supply points will address the substation capacity constraint. There is need to address capacity constraints on existing sub-transmission networks to support national electrifi cation in line with the Expanded Rural Electrifi cation Program (EREP).Because of rural electrifi cation developments, the existing network can no longer take any additional load owing to inadequate capacity.The 33kV and 11kV lines feeding these areas extend beyond 100 km and can no longer take any new load. In some cases, voltage regulators and boosting capacitors have been installed, but the networks have failed to cope because of voltage and capacity problems. The proposed sub-transmission lines and associated substations will allow the connection of new loads as anticipated under EREP. Maps 8.3 and 8.4 depict the existing and planned transmission network expansion.
Expansion of the transmission grid. The transmission grid expansion program has been prepared to meet the demand projected under the three scenarios, namely: a low case, base case and high case for 2010-20. The Company’s planning criteria stipulates that the system should remain stable under all load conditions following the loss of the most critical circuit or element (N-1 Criteria). However, short of elaborate transmission studies, the expansion plan highlights the transmission projects necessary to connect the recommended generation expansion projects to the grid and load centers in a reliable, safe, and economic manner. The expansion plan has also taken into account the fact that the system should operate within acceptable voltage limits and without dangerous overloads to equipment both under normal conditions and during emergencies. It should also maintain the capability of transactions with neighbouring systems as well as wheeling within SAPP.
Zimbabwe lies at the epicenter of the SAPP transmission grid, with power from the north to the south through the ZETDC network; hence the need to expand and reinforce the transmission grid to ensure system stability and security of supplies. The ZETDC transmission systemprovides a wheeling corridor for transactions from SNEL and ZESCO via Kariba North-South and from HCB via the
MAP 8.3. Existing Transmission Grid of Zimbabwe
Songo–Bindura 400kV line, as well as from ESKOM via the Matimba–Insukamini 400kV line. Currently, wheeling operations from north to south on the Zimbabwean Network are limited to 350 MW because of the limited
capacity of the transmission network. The proposed wheeling projects will allow ZETDC to increase its tradable energy from 350 MW to 1,050 MW as well as address some network constraints on the ZETDC Network. The
proposed wheeling projects have been identifi ed to facilitate power transfers as well as improve wheeling through the Zimbabwean network. The estimated cost for the rehabilitation and upgrade of the transmission network is about
$650 million at 2009 constant prices (Figure 8.8). The rehabilitation and upgrade of the transmission network is estimated to cost about $285million, with the sub-transmission network estimated at about $360 million.
Map 8.4. Existing & Proposed Power Generation Sites in Zimbabwe
8.5.4 Rehabilitation and Expansion of the Distribution Grid
ZETDC is responsible for the development, operational and maintenance of the transmission and distribution network in Zimbabwe. The distribution system is made up of 33kV, 22kV 11kV and 0.380/0.220kV lines. The distribution lines have a total length of over 119,784 km servicing a base of close to 600,000 customers.
To meet a higher level of reliability for the distribution system and to ensure that the distribution system is capable of meeting the future electrical requirements, short-, medium- and long-term master plan studies have been prepared by ZETDC. The studies show the need for the implementation of projects to ensure reliable supply and the growth of the main cities. Accordingly, ZETDC will strengthen the existing distribution networks and replace the vandalized distribution materials to
address capacity constraints. ZETDC will also extend the network to connect new customers including households, small business, industries, and agricultural establishments.
REA, in line with its mandate and the objectives of the EREP, is now embarking on Phase III of the rural electrifi cation program for the country. The objective is to extend the medium- and low-voltage distribution networks to supply the remaining 5,000 rural centers that do not yet have access to electricity. REA estimates that this will require construction of more than 15,000 km of 11kV and 33kV distribution lines. The agency intends to expand its support for energy intensive rural projects including rehabilitation electricity supplies to an estimated 50,000 hectares of communal irrigation, and provision of power for 61,000 hectares of new irrigation. The program will also expand access to electricity for cottage and agro-industries in rural areas, and through collaboration with ICT service providers, the REA will expand its support for access to the national communications grid. The REA requires technical services to support for a comprehensive assessment of economic feasibility of expanding the use of renewable energy sources, including solar and mini-hydro sources in rural areas. A business plan for the integration of these sources into the main power grid is also required.
There is a signifi cant shortage of distribution materials to restore power, improve reliability of supplies, and meet new customer connections. Moreover, a number of existing customers are without supply owing to vandalized distribution materials. ZEDTC will therefore procure the necessary distribution materials to extend and strengthen the networks to remove the capacity constraints on the distribution networks.
8.5.5 Demand Side Management
ZETDC will also implement demand side management (DSM) programs with a view to reducing energy consumption and improving the Company’s operational performance. The Company is facing serious revenue collection challenges as the majority of customers are failing to settle their bills on time. As of March 2010, these receivables stood at $340 million and are projected to be about $290 million by the end of 2010. The proposed DSM program may reduce demand by as much as 350 MW in the decade ahead.
The program will involve replacing incandescent lamps with energy effi cient CFLs and installation of a ripple control system to control critical loads during peak hours. The estimated cost of these components of the program is $27.7 million (at 2009 constant prices). The program also includes replacement of credit meters with pre-paid meters to encourage consumers to manage their bills. The installation of pre-paid meters will also improve revenue collection rate and reduce the costs involved in meter reading and avoid confl ict with customers who are not settling their bills. The pre-paid meters will also assist in reducing nontechnical losses, which are estimated at about 11 percent, equivalent to $4.5 million monthly revenue loss. If these nontechnical losses were reduced to a minimum, the cost of the pre-paid meter program would be recovered in a little more than one year. The estimated cost of the
pre-paid meter program is $63.9 million (at 2009 constant prices).
8.5.6 Commercial Performance and Restructuring of Power Utilities
The reality is that the commercial performance of ZETDC and ZPC must be improved in the near term if there is to be an early launch of the proposed rehabilitation program for the power sector. The reason is that, except for modest amounts of support from the newly created Zimbabwe Multi-Donor Trust Fund, the bulk of the funding requirements for rehabilitation in 2011 and 2012 will have to come from the power utilities with perhaps a modest degree of support from the national budget. Consideration should be given to the launch of the following three-pronged program in 2011 to strengthen the commercial performance of these two utilities:
• Improve collections from ZETDC customers with rapid implementation of the pre-paid meter program, upgrade of the existing billing system, and enforcement of the disconnection policy for seriously delinquent accounts. A reduction in accounts receivable to 40 days would bring in about $250 million if accounts were paid in full.
• Replace the existing tariff structure with one that moves the pricing of power towards full cost recovery, while at the same time preserving price subsidies for low income households. If the average tariff were raised from the current level of 7.53 US cents per kWh to 8.5 cents in 2011, the increase in ZETDC revenues would be about $90 million. If it were raised to 9.5 cents, the increase in revenues would be about $180 million. An increase in the average tariff to the current cost of service provision of 11.6 cents per kWh would raise revenues by $370 million in 2011.
• Use the increased revenues of ZETDC to increase spending on the most urgently needed rehabilitation requirements for the transmission and distribution grid, and reduce its accounts payable to ZPC to 30
days and thereby reducing ZPC’s accounts receivable by $40-50 million that, in turn, would allow for a substantial reduction in its accounts payable.
In addition to these high priority short-term measures, the Report proposes early action on the fi nancial restructuring of the power utilities, along the following lines:
• Strip long-term liabilities that are in arrears and owe accrued interest charges from the balance sheets of ZPC and ZETDC and transfer these to a Special Purpose Vehicle to be created by the Government in support of parastatal restructuring, as discussed in Chapter 5 of this Report. This would remove $176 million from the books of the ZPC and $267million from ZETDC. Along with the foregoing measures to improve commercial performance of the two utilities, the transfer of these
long-term liabilities would bring a signifi cant recovery in the fi nancial health of the two utilities;
• These measures would strengthen substantially the prospects for a successful privatization of ZPC. A privatization strategy could be developed along the following lines: a trade sale of perhaps 40 percent of the equity in ZPC to a potential strategic investor with a track record of investment in IPP arrangements, along with subsequent listing of 35 percent of the stock on the Zimbabwe stock market. ZESA Holdings may then hold the remaining 25 percent of the equity;
• At the same time, the resulting sharp improvement in the commercial viability of ZETDC would reduce substantially investor concerns about the potential risks associated with sale of electricity to the ZETDC grid under a take-or-pay contract arrangement;
• These measures would need to be accompanied by a restructuring of ZESA Holdings, perhaps along the following lines. The non-core business activities of ZESA Holdings that currently result in substantial operating losses should be closed down or sold off. ZESA holdings would continue as the primary shareholder in ZETDC. It may also remain as a minority shareholder in the privatized ZPC.
8.5.7 Institutional Capacity Building Programs
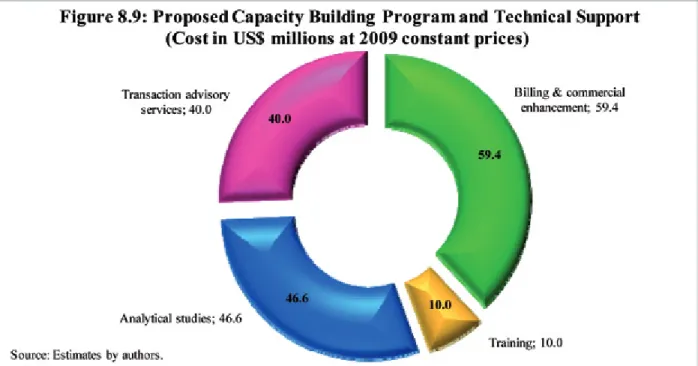
It has been recognized that the energy institutions require capacity building in order to effectively discharge their responsibilities. The capacity building program involves billing and commercial enhancement, training and analytical technical studies. The cost of this item over 2011-20 is estimated at $150 million (Figure 8.9). The key elements of the proposed program include: (i) improvements in billing and commercial operations; (ii) support for institutional capacity building; (iii) training programs; (iv) a series of analytical and technical studies; and (v) retention of a team of transaction advisers with extensive international experience.
Billing/commercial enhancement.
Improvements are needed in meter reading, billing, revenue collection, cash management, and customer service to improve performance and revenue generation. The investment addresses the implementation of an effi cient billing system as well as undertaking a customer data base sanitization exercise and a
public relations campaign. In addition systems and processes in the area need to be reviewed and optimized.
Capacity building and training. This item will provide technical assistance to the Energy Regulator and support ZETDC, ZPC, and REA in their planning and operational activities. The institutional capacity building is linked to expanded training programs. There has been substantial loss of technical and fi nancial skills in the sector in the past decade. Although some have since been re-engaged, the number of returnees has been very small owing to very attractive packages offered by other regional utilities. Enhancing staff effectiveness is a top priority for ensuring effective deployment of the emergency investments.
Analytical technical studies. Under the proposed program, ZESA would undertake a number of analytical and technical studies. These studies will provide guidance on the strategies to be followed in the development of the sector and the generation of bankable project documents. The main components of the program are as follows:
• Need assessment for immediate rehabilitation of generation, transmission and distribution networks;
• Preparation of strategic framework and development program for the power sector for the short to medium term;
• Preparation of transmission and distribution master plans;
• Feasibility studies for generation and transmission projects;
• Feasibility studies for expansion of the rural electrifi cation program, including increased use of solar power and other renewable energy sources;
Transaction advisory services. International experience with PPPs points to the importance of providing adequate funding for expert advisors to help a government or related entity in the development and tendering process associated with the design and implementation of a PPP-type arrangement. These services can be expensive. In the United Kingdom, where there is a signifi cant degree of standardization in PPP-type arrangements, the costs of a transaction advisory team amount to about
8.5.8 Implementation of the Proposed Program
Table 8.10 sets out an indicative set of timelines for implementation of the proposed Power Sector Action Plan. The program calls for an early start on the various capacity building programs, including in particular the billing and commercial enhancement of utility operations and the demand-side management program, the restructuring and privatization of ZPC, the detailed design of the format for IPP agreements, and completion
of the high priority rehabilitation programs for generation, transmission, and distribution. Given the timetables for launch of tenders for the new generation plants, the fi rst of the transactions advisory teams would need to be established in 2012. Construction of the new generation capacities would begin with the Kariba extension in 2013. Although the Batoka hydro-plant may not be needed until 2023, construction would need to start in 2018 to meet the target date for commissioning the plant.
2.6 percent of the capital cost of a PPP-type project over the period from prequalifi cation to fi nancial closure.6 Figure 8.9 includes $40
million for the cost of the advisory services that will be required for the Gokwe and Lupane IPP projects, the estimated investment cost of which is $1.62 billion. In the event that the Batoka hydro-power project is launched in 2018 as proposed in Table 8.7, this may require an additional $30 million for transaction advisory services.
8.6
CAPITAL EXPENDITURES
AND MAINTENANCE
8.6.1 Capital Expenditure Programs
The proposed development expenditure program for the power sector for the decade ahead amounts to about $4.3 billion at 2009 constant prices (Table 8.11). It includes about $150 million for capacity building and technical services, $450 million for rehabilitation of the Hwange and Kariba power plants, about $2 billion for the new
power generation capacity required to support strong sustained economic growth, about $640 million for rehabilitation and expansion of the transmission grid and $610 million for the distribution grid, about $480 million for the rural electrifi cation program with its links to the objective of universal access to the national communications network by 2020, and about $28 million for demand side initiatives to reduce nontechnical losses and reduce substantially accounts receivable for the ZETDC.
8.6.2 Financing for the Capital Expenditure Program
Table 8.12 sets out an indicative fi nancing strategy for the proposed $4.3 billion program of rehabilitation and development for the power sector in the decade ahead. The key elements of the funding arrangements are as follows: • The $156 million for capacity building and
studies would be funded primarily by ZESA Holdings, with a modest amount of support from REA and the donor community, including the recently established Zimbabwe Multi-Donor Trust Fund and the companion trust fund managed by the World Bank; • The $450 million required for rehabilitation
of the existing power plants would be
funded primarily by ZPC, in partnership with the donor community;
• The $1.96 billion required for the proposed three new power stations in the decade ahead would be funded by private investment. As discussed earlier, the privatized ZPC would be expected to play a major role in the proposed new generation plants. In the case of the Kariba extension and Units 7 and 8 at Hwange, as owner of these plants, the privatized ZPC would mobilize the $820 million required for their construction.7 For the
Gokwe North and Lupane Gas plants, these Greenfi eld investments would be tendered internationally to attract one or more additional IPP investors.
7 The proposed funding arrangements for these two projects might evolve along the following lines. In the course of the privatization, ZPC would partner with a strategic investor that would put $300 million of equity into the company. With the existing long-term debt currently in arrears removed from the ZPC balance sheet, the newly
privatized company would be able to use the equity contribution to raise about $600 million of debt fi nancing for
The rehabilitation and expansion of the transmission and distribution grid would be funded primarily by ZETDC. Its ability to mobilize the $725 million of funding required in the decade ahead depends heavily on early implementation of the fi nancial restructuring measures outlined earlier in this chapter. With a successful program of arrears clearance underway in 2011, as assumed for the base case in this Report, the donor community
would be approached for a continuing program of support for further development of the grid. A notional amount of $120 million of private investment in the transmission grid is also included, given the ongoing signifi cant interest within the Southern Africa region in “wheeling” arrangements for the transmission of electricity across borders of the member countries of SAPP.
For the purposes of this Report it is assumed that 45 percent of the proposed $484 million program for rural electrifi cation would be funded by REA using funds mobilized through the 6 percent levy on electricity sales and fees imposed on the communications industry service providers and paid into the Universal Fund. (See Chapter 12 for a further discussion of these arrangements.) It is assumed that the balance of the program (of $266 million) is funded by donors. In the event that donors do not support the rural electrifi cation program, the balance of the funding would have to come from the national budget.
Implementation of the foregoing fi nancing plan would mean that the power utilities would
provide about $1.2 billion of the funding required, and private investment would provide about $2.1 billion. The donor contribution would be modest at about $600 million for the ten-year period.
As Table 8.11 indicates, the proposed program calls for an early start on the rehabilitation of the power sector network with expenditures of $315 million on the transmission and distribution grid, $100 million for rehabilitation of the existing power plants, $12 million for the DSM program, and $21 million for the fi rst phase of the technical support required for the program. A modest amount of funding for these initiatives can come from the newly created
Zimbabwe Multi-Donor Trust Fund and perhaps some bilateral support by individual donors depending on early progress on arrears clearance arrangements. But the reality is that up to $400 million of the required funding for the 2011 program will have to come from
the power utilities and, if need be, from the national budget. A successful early launch of the power program depends heavily on the early implementation of measures to improve the commercial performance of the power utilities, as discussed earlier in this chapter.
8.6.3 Routine Maintenance Requirements and Funding
Spending on routine maintenance by ZPC and ZETDC is projected to be about $90 million in 2010, up from $16 million in 2009 (Figure 8.10). The cost of existing assets in the power sector is estimated at about $1.73 billion, which suggests that spending on routine maintenance in 2010 will be about 5 percent of the cost of capital. For the purposes of this Report, it is assumed that routine maintenance outlays will remain at 5 percent of the cost of the capital stock each year for the decade ahead. The implication is that outlays on routine maintenance will rise to almost $300 million by 2020 (at 2009 constant prices).
As discussed in Chapter 2 of the Report, labor services for the power sector maintenance program are projected to be about $620 million in the decade ahead, which implies average outlays on the services of electricians and others involved in provision of maintenance services of $62 million a year (at 2009 constant prices). Assuming an average annual cost per person of $7,000 for skilled and semi-skilled trades people, this implies
full time employment for some 9,000 people with skills in the electrical services fi eld, many of whom would require accredited trade skills such as electricians. The issue then is whether the educational institutions in Zimbabwe have the capacity to ramp up their training and trade certifi cation capacities quickly so as to respond to this increased demand.
8.7
MANAGING RISKS AND
UNCERTAINTIES
There are a number of major risks and uncertainties associated with the proposed Action Plan for the electric power sector. As with the other infrastructure sectors reviewed in this Report, the risks and uncertainties of greatest interest at this stage relate to the design, funding and implementation of the proposed program. Of particular importance are the prospects for early action that will improve the commercial viability of the two power utilities, the prospects for restructuring these utilities and for transferring their current long-term liabilities to a Special Purpose Vehicle that would hold such liabilities, the growth in demand for power driven by overall
economic growth and by increased rates of electrifi cation in urban and rural areas, and the prospects for mobilizing the large amount of private investment required for new generation capacity in the decade ahead.
8.7.1 Growth in Demand for Power
To evaluate the impact of these various concerns, two alternative projections for the growth in demand for power have been prepared by ZESA. These are referred to as the low case and the high case, the details of which are summarized in Figure 8.11 and discussed at some length in Annex 4
Under the low case scenario, there is only very weak growth in demand because there are serious delays in implementing the high priority reforms aimed at improving the commercial performance of the power utilities and in the proposed restructuring program. The slow progress on these fronts results in continued power shortages that constrain the recovery of the economy. In this scenario, demand grows at an average rate of 3.3 percent per annum during 2010-20, reaching 11,545 GWh by 2020.
This modest increase in domestic demand could be met with additional generation capacity unless of course, the operating environment for private investment in power generation
was judged to be unsatisfactory by potential investors. In this case, Zimbabwe would have to meet the increased demand with additional imports of electricity, assuming that ZETDC