GreeSE Papers
GreeSE Papers
Hellenic Observatory Discussion Papers
on Greece and Southeast Europe
December 2020
Knowledge Diffusion and Financial Development Thresholds
Konstantinos Dellis
Paper No. 154
All views expressed in this paper are those of the authors and do not necessarily represent the views of the Hellenic Observatory or the LSE © Konstantinos Dellis
Knowledge Diffusion and Financial Development Thresholds
Konstantinos Dellis
GreeSE Paper No. 154
All views expressed in this paper are those of the authors and do not necessarily represent the views of the Hellenic Observatory or the LSE © Konstantinos Dellis
Contents
1. Introduction ... 2
2. Theoretical Framework ... 3
3. Literature Review ... 5
4. Data and Methodology ... 7
4.1 Stylized Facts ... 7
4.2 Empirical Specification ... 14
5. Results ... 16
6. Policy Implications and the case of Greece ... 24
7. Conclusion ... 26
References ... 27
Appendix ... 31
A1. Theoretical Model ... 31
A2. Variables and Descriptions ... 32
A3. Graphs... 35
1
Knowledge Diffusion and Financial Development Thresholds
Konstantinos Dellis
1 ABSTRACTForeign direct investment (FDI) has grown strongly as a major form of international capital transfer over the past decades. Countries all over the world compete for direct investment flows, as they are considered less volatile than portfolio investment and are expected to spur long-term growth. The attraction of FDI flows depends inter alia on a number of host country attributes, including macroeconomic, geographical, and institutional variables. Additionally, the extent to which FDI inflows contribute to domestic productivity and long-term growth is
conditional on characteristics that shape a country’s absorptive capacity. This paper uses country-level data from OECD economies over the 2005-2016 period to empirically gauge the effect that FDI inflows have on recipient country productivity and innovative performance. Furthermore, it examines the potential of threshold effects regarding the development of the host economy financial system insofar as the latter is considered a conducive force for spillover effects. In the vein of the trade-growth literature we measure the effect of the foreign R&D stock weighted by bilateral capital goods imports and FDI flows looking at Total Factor Productivity and Patents per population at the economy-level. The results indicate that the depth and efficiency of the destination country financial system provides a mediation mechanism for the realization of positive externalities associated with MNC presence. Most of the financial variables appear to facilitate knowledge spillovers above a certain threshold value irrespective of that being exogenously or endogenously determined. Finally, this exercise yields fruitful policy lessons for Greek economy. More specifically, the ongoing process of restructuring the stressed domestic financial system combined with the incremental completion of the Banking and Capital Markets Union at the EU level could serve as a conduit for speeding the catch-up process to the technological frontier.
2
1. Introduction
According to Endogenous Growth Theory innovation is the pivotal driver of productivity growth and the improvement of living standards (Romer, 1986; Aghion & Howitt, 1992). Innovation can be developed through activities carried out domestically as well as through the absorption of useful knowledge and technology from external sources (Grossman and Helpman, 1991). The inherent traits of knowledge that serves as a public good allow for it to spill over and thus create positive externalities in productivity. These spillovers contribute to the technological improvements of firms or even countries outside the source of the innovation. To be more precise, knowledge spillovers are defined as the ability of a firm, industry or country to gain from technological improvements of its partners as these are expressed by their cumulative R&D stock (Grilliches, 1979; Keller, 2004). Elaborating on this notion, pure knowledge spillovers are derived from the imperfect appropriation of codified and non-codified knowledge embodied in production activities (Seck, 2012), thus not referring to imperfect pricing of knowledge and technological advances in traded inputs (rent spillovers)2 .
The implication of these knowledge spillovers for the innovation potential of economies that lack the domestic capabilities and are far from the technological frontier has spurred a voluminous literature that aims to identify and gauge the extent of these knowledge transfers as well as the mediating mechanisms (channels) through which useful knowledge transcends firm, industry or national boundaries (Peri, 2005; Mancussi, 2008; Smeets, 2008; Gorodnichenko et al., 2014). The early influential work of Jaffe et al. (1993; 1995) used patent citations as its focal point, underlining that technology spillovers can be traced by the citation from a patent to another. The pivotal work of Coe & Helpmann (1995) owing to the theoretical model developed by Grossman & Helpmann (1991) spawned the rich trade-growth literature of knowledge spillovers according to which imports and exports of intermediate inputs were the perennial mechanisms of knowledge transfer across economies. The subsequent empirical literature approximates external knowledge through a trade-weighted sum of foreign R&D stock and examines its effect on domestic productivity or innovation creation through reduced form equations (Keller, 2002; Guellec & de la Potterie, 2004; Coe et al, 2008; Seck, 2012). Apart from trade of intermediate goods, studies identify FDI (Javorcik, 2004; Lee, 2005) and mobility of high-skilled employees (Le, 2010; Drivas et al., 2016; Morales, 2019) as conduits of knowledge transmission. Having said that, a set of local economic, technological, and
institutional characteristics create a country’s absorptive capacity (Cohen & Levinthal, 1989)
2 We shall be referring to a broader sense of knowledge spillovers or knowledge transfer throughout the text, since it is challenging to empirically identify the two sub-categories of spillovers described above.
3 and explain the fact that the spillover process is far from uniform (OECD, 2001; Ozturk, 2008; Crescenzi et al., 2020; Gorodnichenko et al., 2020).
In the present study, we aim to empirically measure the magnitude of knowledge spillovers from trade and FDI flows, accounting for the variation in the host country financial development to condition the effect of the latter. To this end we use a panel dataset from 23 OECD economies and a rich set of previously unavailable financial system indicators. Following the trade-growth literature, we assess the impact of financial development thresholds as determinants of the non-linear effect of external knowledge using endogenous panel threshold econometric techniques (Caner & Hansen, 2004). Our results show that the effect of foreign knowledge is not uniform across institutional environments. Sound financial institutions matter for the culmination of knowledge spillovers through FDI inflows when we focus on domestic patenting activity whereas MNC presence does not appear to exert positive effects on host economy productivity.
Firstly, we discuss the theoretical underpinnings behind this exercise, while the third section of the paper briefly reviews the relevant empirical literature. Section 4 presents the data in hand and describes the analytical framework, before moving to the empirical results in Section 5. Finally, we assess the importance of the findings for the Greek economy in Section 6 and Section 7 concludes.
2. Theoretical Framework
Ever since the pioneering work of Grossman & Helpman (1991), the importance of knowledge transfer has lied at the epicenter of endogenous growth theory. Firms, regions or entire economies that are far from the technological frontier can benefit from achievements and knowledge created in an external environment and do not need to finance their own innovative processes (Grilliches, 1979; Aghion & Howitt, 1992)3. Market transactions such as trade of
intermediate goods and FDI as well as non-market mechanisms such as patent citations serve as transmission mechanisms thus allowing for knowledge spillovers and productivity increases for technological laggards (Keller, 2002; 2004, Peri & Urban, 2005). However, the positive externalities are realized in a manner that is far from uniform and depends heavily on a set of host country economic and institutional attributes (Fagerberg, 1994; De Mello, 1999; Aghion & Howitt, 2005). This phenomenon is asserted in the empirical literature considering FDI flows and economic growth and is in line with the notion of absorptive capacity described by Cohen
3 The importance of productivity spillovers is enhanced in the face of declining own R&D efficiency and the rise of the intangible economy (Aghion et al, 2019; Miyagawa, 2019)
4 and Levinthal (1989)4. The degree to which the recipient unit commercializes the externally
created knowledge has been theoretically and empirically examined through the inclusion of numerous parameters that capture the economic, social, and institutional environment of the host firm/economy5. In this study, we attempt to shed light to the conducive role played by the
financial system development of the host economy.
According to Alfaro et al. (2004) the financial markets play a pivotal role in the knowledge transmission process, considering the effects of both the banking sector and the host market. Apart from the established growth enhancing effect of well-developed financial markets the authors show that they can also indirectly promote productivity growth through the externalities created by trade and MNC participation. In the process of acquiring external knowledge which increases productivity domestic firms need to expand and hire employees, hence rely on financing. This argument is even more relevant in the case of horizontal FDI spillovers through the absorption of employees previously working for MNCs in the sector. Moreover, the export capacity of domestic firms (which is absorptive capacity) depends on depth of the local financial system and the financing opportunities for potential exporters. Alfaro et al. (2004; 2010) provide a theoretical model which explains the importance of sound domestic financial conditions for the realization of backward linkages through FDI inflows. More specifically, only financially non-constrained firms can become suppliers for MNCs and thus benefit from vertical spillovers (Javorcik & Spatareanu, 2008). According to Hermes & Lensink
(2003) “FDI and domestic financial markets are complementary with respect to enhancing the
process of technological diffusion, thereby increasing the rate of economic growth” (p. 147).
Having said that, it is rational to postulate that trade-induced spillovers are also conditioned by the access to finance for domestic firms, the stability of the banking sector and the availability of non-baking sources of corporate finance such as venture capital and a developed private bond market. Finally, the importance of the functioning of the domestic financial sector as a conduit for productivity spillovers through trade and FDI is also justified within the context of the National and Regional Systems of Innovation theory (Cooke & Morgan, 1998; Lundvall, 1992; Nelson, 1993) which captures all aspects of economic, social and institutional performance in a certain region that shapes its capacity to assimilate knowledge created outside its barriers. Crescenzi & Rodriguez-Pose (2011) identify the attributes of the local
innovation system as greater determinants for innovation output than the region’s own R&D
intensity. In the sense that there exists a social filter (Boschma, 2004; Rodriguez-Pose, 1999) shaped by contradicting forces (Crescenzi & Rodriguez-Pose, 2011) which determine to a large extent the dissemination of external knowledge and hence spur domestic productivity, the depth and governance of the financial system can be viewed as an integral part of this process.
4According to Barnard and Cantwell, (2006) “Even if knowledge originates elsewhere or is carried by external actors,
the receiving node has to play an active role to animate and recreate that knowledge in a new context”.
5 The access of domestic firms to ample sources of finance, bearing in mind the uniqueness of financing innovative projects (Hall & Lerner, 2010; EIB, 2018) is pivotal for the positive externalities from trade and MNC presence to culminate and for the enhancing effect on domestic productivity.
3. Literature Review
The empirical literature on technology transfer and knowledge spillovers has expanded exponentially after the theoretical foundations of endogenous growth theory in the latter part of the 20th century. Scholars have attempted to measure the extent to which external
knowledge enhances domestic productivity growth and the mechanisms which act as catalysts in the process. As elaborated by Keller (2002; 2004) the dominant approach relies on the construction of foreign knowledge stocks following the seminal contribution of Coe & Helpmann (1995) and incorporating them in reduced form equations for some measure o domestic (or sectoral productivity). The coefficient of this foreign knowledge term is interpreted as the partial elasticity of domestic productivity (usually TFP) with respect to knowledge created outside national boundaries. Nonetheless, the foreign knowledge component must be constructed through a weighted average scheme of all trading partners’
knowledge stock. The most common weight in the literature is the ratio of bilateral
intermediate imports over total imports or partner GDP, hence the term “trade-growth
literature” coined by Keller (2004). The inclusion of the import-weighted foreign knowledge stock has yielded significant positive coefficients in numerous studies (Keller, 2002; Lee, 2005; Coe et al, 2008; Drivas et al., 2016) thus pointing to the existence of positive productivity externalities available through international trade.
Having said that, long-term capital flows in the form of FDI are postulated to act as conduits for knowledge transfer insofar as the Multinational Corporations (MNCs) that undertake them possess higher levels of technology and organizational skills (Javorcik, 2004). Traditionally, scholars distinguish between horizontal spillovers (within the same sector or industry) and vertical spillovers, which in turn are divided into backward and forward linkages (Gorg and Strobl, 2005). Horizontal positive spillovers can occur through imitation (reverse engineering) from domestic firms and local employees leaving the multinational to start their own enterprise (Aitken and Harrisson, 1999). Empirically, the studies seek to quantify these FDI-induced knowledge spillovers using sectoral data productivity combined with the presence of inward FDI flows in that sector as well as upstream and downstream sectors to capture horizontal and vertical spillovers. A growing body of empirical work points towards the establishment of
6 technology transfer through the operations of MNCs6 with the most robust results referring to
the positive vertical spillover effects7 of FDI flows (Javorcik, 2004; Gorodnichenko et al, 2014;
Blalock & Gertler, 2008; Stancik, 2007; Gorg et al., 2008; Javorcik & Spatareanu, 2008). A meta-analysis for transition economies by Iwasaki & Tokunaga (2016) reveals that there is significantly greater support in the literature for certical FDI spillovers through backward linkages than horizontal and forward vertical linkages (see for example Javorcik & Spatareanu, 2005; 2008; Gorodnichenko et al., 2020). The record is much more ambiguous when one turns to horizontal spillovers stemming from FDI presence in a specific industry/sectors as the negative competition effect sometimes proves more powerful thus reducing overall productivity and innovation performance (Aitken and Harrisson, 1999; Abraham et al., 2007; Javorcik & Spatareanu, 2008; Kosova, 2010). Existence of positive intra-industry spillovers through demonstration effects and labor turnover is documented mostly in studies concerning advanced economies (Haskel et al., 2007; Keller & Yeaple, 2009). Apart form the aforementioned methodology, the transmission mechanism of FDI flows has been incorporated in the trade-growth literature and bilateral FDI flows have been used to construct the weights for the levels of foreign R&D stock to create the measure of external knowledge. The results are mostly in favor of the notion of international knowledge transmission of knowledge (van Plottensberg & de la Potterie, 1999; Lee, 2005; Seck, 2012; Drivas et al., 2016) although the horizontal and vertical spillover effects cannot be disentangled due to the nature of the underlying data.
Finally, a recent strand of literature acknowledges the salient impact of face to face interactions in the dissemination of external knowledge (Feldman, 2000) and considers the mobility of high-skilled personnel as a vessel for knowledge transfer across national borders. The influential work of Miguelez (2009) underscores the role of the migration of inventors8 in the transmission
of new ideas and the boost on innovation capacity of the destination region. According to the theory. job movements enable an inventor to take advantage of knowledge - not only codified, but also tacit - accumulated by other inventors in their past jobs and share it in later jobs. A number of studies have extensively investigated the migration of inventors as a potential channel of market-generated knowledge diffusion with the effects corroborating the theoretical underpinning to a large extent (Kim & Marschke, 2005; McNeil, 2005; Breschi & Lissoni, 2009 Le, 2010; Guiri & Mariani, 2013; Gagliardi, 2015). Nonetheless, it should be noted that the empirical exercise to measure this effect is challenging since national systems of innovations and, hence innovative performance of a country or region act as pulling factors for the movement decisions of inventors (Florida, 2002; Argawal et al., 2006; Mellander & Florida, 2007; Miguelez & Moreno, 2014).
6 Crespo & Fontoura (2009) provide a comprehensive survey of the relevant literature. 7 See Havranek & Irsova (2011) for a meta-analysis on the subject.
7 Complementary to the vigor of the transmission mechanism, the incidence and magnitude of the knowledge spillovers depend on the absorptive capacity of the firm, region or country (Griffith et al, 2003). According to Crescenzi & Rodriguez-Pose (2011), the integration of own R&D efforts, external knowledge transmitting through the various channels and local absorptive capacity shape the framework of innovation in a region. The empirical literature on knowledge spillovers has identified an array of local traits that constitute a region or country prone to innovation through the absorption of external technology9. The role of domestic human capital
is underscored as a major mediating factor in a number of studies irrespective of the transmission channel (Engelbrecht, 1997; Chiang, 2005; Coe et al., 2008; Criscuolo & Narula, 2008; Madsen, 2014; Tang & Zang, 2016) as well as own R&D and innovation performance of the region (Guellec & de la Potterie, 2004; Aldieri & Cincera, 2007; Lin & Saggi, 2007; Gorodnichenko et al, 2014). Moreover, the overall institutional functioning of the recipient economy shapes the pre-requisites for the absorption of external knowledge10. Numerous
studies have focused on the conducive role of infrastructure (Tang & Zang, 2016; Malerba et al., 2007), ease of doing business (Coe et al., 2008; Seck, 2012) and intellectual property rights (Crespo & Fontoura, 2009; Gorodnichenko et al., 2014), among others, thus pointing to the non-linear nature of the spillover procedure. In the same vein, many scholars account for the role of the domestic financial development as a channel for FDI-induced productivity spillovers to find significant support to their hypotheses (Hermes & Lensink, 2003; Desai et al, 2005; Blundell-Wignall & Roulet 2017). The efficiency and depth of domestic financial institutions matters for the commercialization of positive externalities associated with trade and FDI flows (Djankov & Hoeckman, 1999; Louri & Dimeli, 2001; Campos & Kinoshita, 2008).
4. Data and Methodology
4.1 Stylized Facts
In order to empirically gauge the magnitude of cross-border knowledge spillovers and the potential financial development thresholds that act as absorptive capacity we use data for a balanced panel of 23 OECD economies from 2005 to 2016. The dependent variable is domestic innovation production , which is proxied by the number of patent applications filed under the Patent Cooperation Treaty (PCT) in a certain country per year following Acs et al. (2002), derived from OECD's Directorate for Science, Technology and Industry database. In addition, we
9 See Crespo & Fontoura (2009) for a review on the shaping of absorptive capacity in the case of FDI.
10According to Louri & Dimeli (2004) “Their (spillovers) magnitude and scope depend on the development stage of the economy, particular characteristics of the host markets, the structure of industries, institutional factors, trade
8 include Multi-factor Productivity (MFP) as the dependent variable in some specifications, defined as an index (2010=100) drawn from the OECD Main Statistics Database. Knowledge stocks, domestic and foreign, are approximated by perpetual inventory method using R&D data
extracted from OECD’s Main Science and Technology Indicators (PPP USD).11 Furthermore,
inward FDI stock and flows are derived from the OECD's International Direct Investment Statistics under Benchmark Definition BMD312, while data for countries' Gross Fixed Capital
Formation from the OECD's Annual National Accounts. As there is no single metric of financial sector development, the study uses an array of financial development indicators compiled by the IMF and the World Economic Forum. Details on the variables and their definitions are provided in Appendix A2.
As show in Graph 1, the period under scrutiny is characterized by poor to modest overall productivity growth once put in a historical perspective (Gordon, 2016). Decomposing the dataset with reference to the 2008 financial crisis it is notable that average productivity growth is zero or negative for many economies. With the notable exception of Ireland, no country has experienced a surge in productivity growth compared to the pre-crisis period. Nonetheless, there is substantial cross-country variation in productivity growth rates within the group of advanced economies which is valuable from an empirical perspective since MFP is our main dependent variable. Innovative activity as measured by patents13 (in terms of output) is not
uniform across the globe or even across advanced economies (see Figure A1 in the Appendix). As underscored by Feldman and Kogler (2010) the creation of knowledge and the advances in new technologies in production is spatially concentrated despite the advances in communication technologies and the increased interdependence in the globalized economy. Innovative firms and sectors tend to be geographically fragmented (Botazzi and Peri, 2003; Audretsch and Keilbach, 2008; Deltas and Karkalakos, 2013) owing, to a large extent, to the importance of non-codified knowledge and face-to-face interactions (Soete, 2011). As can de observed in Table 1 the distribution of patents across countries and years is highly skewed with USA, Japan and South Korea dominating the field throughout the selected years in absolute numbers.
11The main idea of the perpetual inventory method is the construction of yearly R&D stocks by adding each year's
R&D expenditures and subtracting each year's depreciation of existing stock by a specific rate. We construct own and foreign country's R&D stocks by using a 15% depreciation rate. As in conventional literature, we have tried different depreciation rates, e.g., 10%, and 20%, with overall similar results.
12 The most recent vintage of OECD FDI data (BMD4) accounts for the presence of Special Purpose Entities (SPEs), however the availability of bilateral data prior to 2013 is very scarce. Nonetheless, the importance of addressing the measurement issue in the case of FDI flows net of the presence of Special Purpose Entities (SPEs) is underscored in Dellis et al (2020). The robustness checks attempt to gauge FDI inflows more accurately, albeit with the cost of fewer observations in the sample.
13There is no perfect metric for innovation and relying on patents poses caveats (see Argente et al., 2020), however
9
Table 1: Descriptive Statistics
Mean Median min max St.Dev
MFP Index (2010=100) 100.334 100.195 84.66 109.907 3.003
MFP growth .186 .261 -6.3 8.304 1.739
Patents under PCT 6709.182 1879.92 37.789 58934.27 12374.91
Patents per Population .148 .126 .008 .361 .092
Patents % GDP .004 .003 0 .01 .002
log Domestic R&D Stock 24.87 24.867 21.816 28.412 1.485
log Foreign R&D Stock (FDI) 8.865 9.118 3.115 12.069 1.607
log Foreign R&D (Capital Imports) 21.623 21.663 18.919 24.18 1.08
Financial development index (IMF) .76 .762 .5 1 .103
Financial institutions index (IMF) .807 .821 .569 1 .102
Financial markets index (IMF) .696 .718 .349 1 .147
Financial institutions depth (IMF) .738 .721 .282 1 .178
Financial Markets Index (WEF) 4.818 4.943 2.524 6.169 .711
Financial Efficiency Index (WEF) 4.475 4.585 2.238 5.814 .704
Private Credit % GDP (WB) 111.404 104.34 48.892 212.901 35.505
Data from the European Commission note the lagging performance of the European economy in R&D intensity and innovation compared to the US, Korea and Japan (European Innovation Scoreboard, 2018). Moreover, within the EU innovation performance is fragmented with no signs of convergence looking at patents per capita (see Veugelers, 2017). These developments raise the question on whether foreign knowledge can enhance productivity in laggard countries through the bilateral relationships in the fields of trade and FDI flows. The data on the foreign R&D stock underline the increased importance of this specific source of technology (Graphs 2 and 3), albeit with a small plateau phase the year after the eruption of the financial crisis. The revival in trade and FDI flows14 after 2009 provide with larger stocks of foreign R&D under both
weighting schemes. The trade-related flows are significantly larger than the FDI-weighted external knowledge stocks, however both variables exhibit a degree of persistence as countries occupying the top places among the OECD group do not change over time. Foreign R&D stock based on FDI weights shows a trend of reduced dispersion after 2012, with the Greek economy however remaining at the last position in the relevant table throughout the course of these 12
14 FDI-weighted foreign R&D stock uses bilateral FDI flows in absolute terms, since the data refer to net flows and can take negative values as well. For reasons of robustness we also use a three-year moving average of these flows in our estimations.
10 years15. More specifically, the 5 highest pair-year observations in terms of bilateral FDI flows
are documented in 2015 and 2016 with USA being the host economy in all of them and with flows that go beyond 350 billion USD per year compared to the sample average of 30 billion when we account for all firms operating in the host economy . Amongst them, inflows from Luxembourg16 in 2015 reached the highest value in the sample of 182 billion followed by Swiss
FDI in the US from 2016 at 72 billion.
Graph 1: Multifactor Productivity Growth
Among the highest capital goods transactions USA is the host economy in the top 17 country-pair observations, while the next three places refer to Canadian capital imports from the United States. Imports of Chinese capital goods in the USA surged from 75 USD billion in 2013 to almost 900 billion in 2015 and 201617.
15 It requires mentioning the FDI flows to Greece have increased substantially the years following 2016 (Bank of Greece, 2020).
16 Data on FDI flows are to be approached with caution, especially for countries with a high SPE presence such as Luxembourg and the Netherlands (see Dellis et al., 2017 for a discussion).
11
Graph 2: Foreign R&D Stock – FDI Channel
It is, therefore, no surprise that the US economy steadily receives the lion’s share of external
knowledge through the trade of intermediate capital goods (the top observations in Graph 3) and is notably followed by Germany and the United Kingdom. The upward trend in Greek foreign knowledge stock from the trade channel came to an abrupt stop in 2008 and has been stabilized in the bottom decile of the distribution for the years that followed. The aggregate value of capital imports for the Greek economy dropped sharply from 11 billion in 2009 to
marginally above 5 billion in 2005 reflecting the sharp drop in the country’s GDP following the
12
Graph 3: Foreign R&D Stock – Trade Channel
Despite the fact that there is no single metric for the development and effectiveness of the financial system, the variables and indicators available for the IMF, the WEF and the World Bank provide with some stylized facts regarding the position of the economies in the sample. Among the composite financial development indexes, there is no pronounced heterogeneity as shown Graph 4, however there exists a fragment between the leaders and laggards with the latter group composed primarily of transition economies. The last decade of the 20th century
marked a rigorous financial development environment for high- and low-income OECD economies and was noteworthy in the peripheral EU countries (Spain, Portugal, Greece, Ireland). The global financial crisis kept this development to a halt and by 2010 led to a decrease in the IMF financial development indicator particularly in the economies of the periphery. When looking at specific indicators we can detect some variation in the behavior of the components of the financial system as can be seen in Graph 5 which plots the evolution of non-performing loans in certain EU economies. Even values close to 10% of total loans for Italy are significantly higher than the sample averages (mean 4.3%, median 3.1%) once we exclude the outliers (Greece and Cyprus). The burden on non-performing loans lies heavy on the financial conditions for SMEs especially in Greece and hampers the growth potential (Bank of Greece, 2019).
13
Graph 4: Financial Development Index
Another area of divergence within the advanced country group is the depth f the financial system in terms of the availability of options for corporate external financing. Stock market capitalization was 143% of GDP in the US, 99% in Japan ,67% in Spain and 22% in Greece for 2016, thus indicating a very diverse space of equity financing in the data. The same conclusions apply when one turns to the WEF indicator that captures the availability of venture capital, where data for 2015 reveal a score of mere 1.8 for the case of Greece and 2.1 for Italy (scale of 1 to 7, mean value 3.4) with no signs of improvement during the period in question . The degree of variation within the OECD country group has increased after the financial crisis of 2008-09 and thus provides with a fruitful set of indicators that can be used as proxy for the absorptive capacity of an economy that expects to gain from trade and capital flows.
14
Graph 5: Non-Performing Loans
4.2 Empirical Specification
The empirical methodology follows the trade-growth literature (Coe & Helpman, 1995; Keller, 2004) based on the theoretical premise of the Knowledge Production Function18 (Grilliches, 1986; Audretsch & Feldman, 1996). In the same vein as Drivas et al. (2016) both channels of external technology are included in the estimated equation as possible inter-dependencies across different channels and omitted factors (e.g. technology shocks) when estimating single equations of knowledge flows could hamper the efficiency of the estimates (Drivas et al, 2014) Our baseline specification is the following
15
𝐹𝑖𝑡 = 𝑎𝐷𝑙𝑛𝑅𝐷𝑖𝑡𝐷+ ∑2𝑗=1𝑎𝑗𝐹𝑙𝑛𝑅𝐷𝑖𝑗𝑡𝐹 + 𝛾𝐼𝑖𝑡 + ∑2𝑗=1𝛿𝑗𝑓𝑙𝑛𝑅𝐷𝑖𝑗𝑡𝐹 ∗ 𝐼𝑖𝑡 + 𝛼𝜄+ 𝑢𝑖𝑡 (1)
The dependent variable (Fit) is the number of patents normalized by GDP or population of the
host economy or MFP. We focus on patents to gauge innovative activity of the recipient economy following a bevy of empirical studies (Cantwell & Iammarino, 1998; Bottazi & Peri, 2005, Drivas et al, 2016; Crescenzi et al, 2020) keeping in mind the drawbacks highlighted inter alia in Archibugi (1992)19.The coefficient of interest is αf which measure the partial elasticity of
local productivity with respect to the foreign R&D stock (as constructed using import and FDI weights). Both external knowledge variable are interacted with an institutional dummy (Iit)
which takes the value of 1 if institutional performance is high in the respective country-year observation and 0 otherwise to capture the non-linear effects of foreign R&D stock due to domestic absorptive capacity. Finally, all specifications include country fixed effects and time fixed effects where stated. The models with continuous dependent variables are estimated with OLS and standard panel estimation techniques, however emphasis is given in the Dynamic and Fully Modified OLS models (DOLS and FMOLS) once we delve into the time series properties of the underlying variables. After establishing panel cointegration (see Results Section) through the appropriate testing procedures we report FMOLS and DOLS results which to utilize the information concerning the long run relationship and allow the short run dynamics to be potentially heterogeneous (Seck, 2012). As a robustness exercise we estimate regressions with the number of patents as the dependent variable using the Negative Binomial Model.
In addition, we allow for potential endogenous thresholds in the effect of domestic financial development with the estimation of the Panel Threshold Models (Hansen, 1997; Caner & Hansen, 2004). 𝐹𝑖𝑡 = 𝑎𝐷𝑙𝑛𝑅𝐷 𝑖𝑡𝐷+ ∑2𝑗=1𝑎𝑗𝐹𝑙𝑛𝑅𝐷𝑖𝑗𝑡𝐹 𝐼(𝑄𝑖𝑡 < 𝛾) + ∑ 𝛽𝑗 𝑓 2 𝑗=1 𝑙𝑛𝑅𝐷𝑖𝑗𝑡𝐹 𝐼(𝑄𝑖𝑡 > 𝛾) + 𝛼𝜄+ 𝑢𝑖𝑡 (2)
I is the indicator function to distinguish between the two regimes, Qit is the value of the
respective financial or institutional variable and γ is the endogenously determined threshold value. The difference between coefficients αf and βf and its statistical significance provides
19 For example, patented innovations represent only a fraction of total innovative output and the intrinsic value of each patented innovation is not equal.
16 information on the existence of threshold values of domestic financial variables in the knowledge dissemination process.
5. Results
Prior to presenting the results from the empirical estimation we must turn to the time-series properties of the underlying variables. Applying the proper panel stationarity tests, we can then infer whether there exists a co-integrating relationship among the variables. If this is the case, it is preferable to use the DOLS or FMOLS estimators, which have similar asymptotic properties and improve the simple properties of the OLS estimator (Seck, 2012). Following Pesaran (2007) we deploy the CIPS panel unit root test which is robust to cross-sectional dependence in the data. The test for cross-sectional dependence in the data (Pesaran & Hashem, 2006) rejects the null hypothesis of independence for all the series in question (MFP, patents, domestic R&D stock, foreign R&D stock), hence it is necessary to use a stationarity test which accounts for cross-sectional dependence. Table 2 presents the result for the dependent and independent variables. The null hypothesis of a unit root is not rejected for any of the series except for the foreign R&D stock based on the FDI weighted average. The results of the conventional panel unit root tests20 are presented in the Appendix. Having said that, table 2 presents the results
for the Pedroni Cointegration tests (2001). Under the null hypothesis the test statistic for all categories follows the standard normal distribution, hence we reject the null of no cointegration in the underlying data and proceed with the DOLS estimations
Table 2: Panel Unit Root Test (CIPS)
log MFP log Patents/Pop log Patents/GDP log R&D Domestic log Foreign R&D Trade log Foreign R&D FDI
-1.3235 -0.0602 -1.7209 -0.9228 -1.5067 -2.3054
Critical Values are: -2.07 (10%), -2.17 (5%) , -2.34 (1%) All tests include 2 BG lags
17 Table 3: Pedroni Panel Cointegration Test
Statistic Panel Group
v -1.178
rho 2.696 4.625
t -7.342 -8.573
Adf -3.513 -4.845
Table 4 depicts the results from the baseline estimations with the linear form of the patent variable (scaled by population and GDP). In columns (1) and (2) the domestic R&D stock emerges as a major determinant of patenting activity with substantially high and significant partial elasticity, whereas only the R&D stock through trade of capital goods exerts positive effects albeit with a smaller elasticity.
18 Table 4: Baseline Regressions – Dependent Variable: Patents/GDP
1 2 3 4 5 6 VARIABLES Patents/Populatio n Patents/GD P Patents/Populatio n Patents/GD P Patents Patents
DOLS DOLS DOLS DOLS NB NB
log Domestic R&D 0.483*** 0.194*** 0.910*** 0.718***
0.275** *
0.279** *
(0.000) (0.005) (0.000) (0.000) (0.000) (0.000)
log Foreign R&D FDI -0.025*** -0.016*** 0.048*** 0.068***
0.037** *
0.045** *
(0.000) (0.007) (0.000) (0.000) (0.001) (0.001)
log Foreign R&D Imports 0.304*** 0.096* 0.046* -0.312*** -0.004 -0.009
(0.000) (0.077) (0.065) (0.000) (0.932) (0.856) Import Share 0.053*** 0.004 0.122** * 0.104* (0.000) (0.600) (0.088)
log Foreign R&D FDI* Imp Share -0.001*** -0.001*** -0.020
(0.000) (0.000) (0.403)
log Foreign R&D FDI* Imp Share -0.001*** 0.001* 0.010
(0.000) (0.079) (0.383)
Constant -20.808*** -12.933*** -22.038*** -18.531*** -2.568 -2.643
(0.000) (0.000) (0.000) (0.000) (0.115) (0.111)
Observations 206 206 233 233 219 219
R-squared 0.999 0.999 0.999 0.999 - -
Country FE Yes Yes Yes Yes Yes Yes
Year FE No No No No No No
LR Statistic - - - - 54.95 55.72
*** p<0.01, ** p<0.05, * p<0.1 2 Lags and 2 Leads of
independent variables included bartlett kernel applied
Columns (3) and (4) include the import share over home country GDP as in Coe et al. (2008) and show a positive effect of both channels in patents per head (Column 3). In addition, Columns (5) and (6) report the coefficients from the count regressions with the number of patents as the dependent variable. Both models refer to Negative Binomial rather than Poisson estimation as the LR test statistic rejects the null hypothesis of equi-dispersion21. The FDI-induced foreign
knowledge component is robust and has a positive effect on the incidence of patents in these
19 estimations while the trade related foreign R&D stock does not appear to be significant. The partial elasticity of the foreign knowledge stock ranges from 0.04 to 0.07 in these specifications in line with the findings by Coe et al (2008) and Poldahl (2012), and slightly greater than the implied results of Lee (2005) and Malerba et al. (2007).
Table 5: DOLS Regressions with Absorptive Capacity – Dependent Variable: Patents/GDP
1 2 3 4 5 6 VARIABLES Financial Development (IMF) Financial Institutions Development (IMF) Financial Institutions Depth (IMF) Financial Markets Development (IMF) Financial Market (WEF) Private Credit % GDP log Domestic R&D 0.512*** 0.727*** 0.180* 0.526*** 0.437*** 0.532*** (0.007) (0.000) (0.093) (0.000) (0.003) (0.000) log Foreign R&D FDI 0.008 0.042*** 0.015 0.026*** 0.031** 0.013 (0.715) (0.000) (0.122) (0.004) (0.030) (0.111) log Foreign R&D FDI*Inst 0.013 -0.029 0.000 -0.075*** -0.053* 0.017 (0.701) (0.405) (0.972) (0.004) (0.051) (0.342) log Foreign R&D Trade -0.331*** -0.234*** -0.313*** -0.192*** -0.224*** -0.227*** (0.000) (0.000) (0.000) (0.000) (0.001) (0.000) High Institution -0.064 0.484 0.104 0.717*** 0.602* -0.000 (0.851) (0.134) (0.402) (0.004) (0.022) (0.999) Constant -12.089** -19.785*** -4.284 -15.641*** -12.392** * -14.760** * (0.018) (0.000) (0.127) (0.000) (0.001) (0.000) Observations 211 211 211 211 211 211 R-squared 0.997 0.997 0.997 0.997 0.997 0.997
Country FE Yes Yes Yes Yes Yes Yes
Year FE Yes Yes Yes Yes Yes Yes
pval in parentheses *** p<0.01, ** p<0.05, * p<0.1
2 Lags and 2 Leads of independent variables included
20
bartlett kernel applied
All R&D Stock Variables are measured with 1 Lag. Country Fixed Effects Jointly Significant at 1%
On top of the baseline regressions, we draw a first attempt on the non-linear effects of FDI-induced foreign knowledge by defining high institutional performance as the country-year observations that belong in the top quantile of their respective distribution. The possible non-linear relationship is examined at this preliminary stage through the inclusion of an interaction term of the foreign R&D stock with the indicator variable that takes the value of 1 in the case of high-quality financial institutions. Interestingly the measure stemming from the bilateral FDI flows interacted with domestic financial development appears to exert a negative influence on patents in all specifications, as depicted in Table 5 thua corroborating the findings of Havranek & Irsova (2011) . By contrast, the relationship is reversed once we look at the effect on MFP in Table 6. The negative effect of MNC presence in the economy, perhaps stemming from adverse competition effects (Aitken & Harrison 1999; Haskel et al, 2001) is significantly ameliorated in four out of six specifications through the prevalence of sound financial institutions. The overall effect is still marginally negative, with the exception of the effect of domestic credit (last column). The domestic R&D stock and trade -weighted foreign stock are significantly growth augmenting with the partial elasticities corroborating previous empirical findings (Coe & Helpmann, 1995; Seck, 2012; Farcasso & Marzetti, 2015)
Aside from using exogenously determined thresholds for the financial variables, we allow for the value of the cut-off point to be endogenously determined from the data. Table 7 presents the results from the Panel Threshold model based on the theoretical work of Hansen (1999; 2004). We allow for the coefficient of the external knowledge stock to differ across values based on an endogenously determined threshold value of the financial variable in question. Looking at the results in Table 7 referring to patents as the dependent variable, it is notable that in five out of six specifications the effect of FDI-weighted foreign R&D is amplified after a certain financial development threshold22. Moreover, in the case of Financial Institutions Depth,
the positive effect of external knowledge is statistically significant only after the endogenously determined threshold value (Column 3). The existence of a threshold value is statistically significant at the 10% level for all but one specification, whereas the threshold levels lie below the respective sample means of the chosen financial variables. The results corroborate the previous findings on the importance of own R&D in the process of increasing productivity.
22 Estimations with two endogenously determined thresholds yield insignificant results for the second threshold and are not tabulated.
21 Table 6: DOLS Regressions with Absorptive Capacity – Dependent Variable: MFP
1 2 3 4 5 6 VARIABLES Financial Development (IMF) Financial Institutions Development (IMF) Financial Institutions Depth (IMF) Financial Markets Development (IMF) Financial Market (WEF) Private Credit % GDP
log Domestic R&D 0.182*** 0.155*** 0.208*** 0.178*** 0.218*** 0.152*** (0.000) (0.000) (0.000) (0.000) (0.000) (0.000) log Foreign R&D FDI -0.022*** -0.014*** -0.020*** -0.015*** -0.017*** -0.017***
(0.000) (0.000) (0.000) (0.000) (0.000) (0.000) log Foreign R&D FDI*Inst 0.014*** -0.016*** 0.011*** -0.011 0.019*** 0.029***
(0.000) (0.001) (0.000) (0.347) (0.000) (0.000) log Foreign R&D Trade 0.049*** 0.103*** 0.065*** 0.076*** 0.059*** 0.083***
(0.000) (0.000) (0.000) (0.000) (0.000) (0.000) High Institution -0.114*** 0.128*** -0.103*** 0.120 -0.234*** -0.210*** (0.000) (0.003) (0.001) (0.304) (0.000) (0.000) Constant -0.851 -1.393*** -1.735** -1.351 -1.915*** -0.869 (0.101) (0.000) (0.026) (0.179) (0.000) (0.153) Observations 209 209 209 209 209 209 R-squared 0.871 0.898 0.862 0.863 0.884 0.888
Country FE Yes Yes Yes Yes Yes Yes
Year FE Yes Yes Yes Yes Yes Yes
pval in parentheses
*** p<0.01, ** p<0.05, * p<0.1
2 Lags and 2 Leads of independent variables included bartlett kernel applied
All R&D Stock Variables are measured with 1 Lag. Country Fixed Effects Jointly Significant at 1%
22 Table 7: Threshold Regressions23– Dependent Variable: Patents/GDP
One Threshold Regression
1 2 3 4 5 VARIABLES Financial Development (IMF) Financial Institutions Development (IMF) Financial Institutions Depth (IMF) Financial Markets Development (IMF) Financial Market (WEF)
log Domestic R&D 0.654*** 0.707*** 0.616*** 0.583*** 0.517*** (0.000) (0.000) (0.000) (0.000) (0.000) log Foreign R&D Trade -0.163*** -0.240*** -0.222*** -0.201*** -0.110**
(0.001) (0.000) (0.000) (0.000) (0.026) log Foreign R&D FDI < Threshold 0.023** 0.022** 0.017 0.018* 0.030***
(0.033) (0.037) (0.110) (0.079) (0.004) log Foreign R&D FDI > Threshold 0.030*** 0.038*** 0.036*** 0.033*** 0.009
(0.009) (0.001) (0.001) (0.002) (0.369) Constant -19.244*** -18.874*** -16.969*** -16.579*** -16.766*** (0.000) (0.000) (0.000) (0.000) (0.000) Observations 143 143 143 143 130 R-squared 0.520 0.575 0.557 0.560 0.553 Number of cnt 13 13 13 13 13
Country FE Yes Yes Yes Yes Yes
Threshold Value 0.731 0.877 0.705 0.754 3.573
Threshold Test P-value 0.830 0.0600 0.100 0.0400 0.0600
pval in parentheses
*** p<0.01, ** p<0.05, * p<0.1
Bootstrap Estimation of Threshold after 100 Iterations
All R&D Stock Variables are measured with 1 Lag. Country Fixed Effects Jointly Significant at 1%
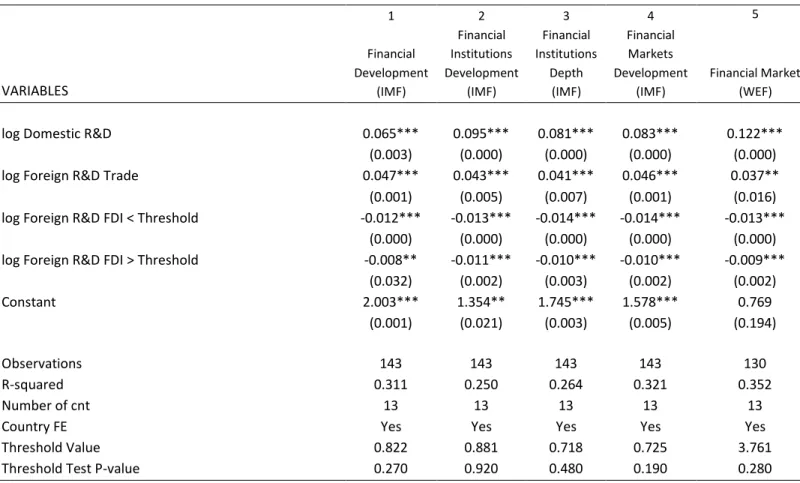
The forces behind productivity spillovers appear to be governed by different principles based on the findings presented in Table 8. Using total factor productivity as the dependent variable, only trade-induced foreign knowledge has growth-enhancing effects with the coefficients lying at the high end of the respective literature summarized above. The presence of MNCs reduces domestic productivity, albeit with a smaller intensity after the threshold level of domestic financial development except for private credit. This result is in line with the conclusions met by
23 Panel Threshold regressions require balanced panels, hence this set f results refers to 13 countries form the sample.
23 Aitken & Harrison (1999) and Havranek & Irsova (2011) and could reflect the fact that we have not distinguished between horizontal and vertical spillovers rather included total FDI inflows at the country level. Having said that, the results from Tables 7 and 8 could also point to the inherent specialty of the innovation-finance nexus (Hall & Lerner, 2010; Brown et al, 2013) whereby the increased risks of innovative production and the lack of adequate collateral in many cases reduce the availability of the necessary resources o promote innovation. Given a certain threshold of financial development increases the chances of domestic firms learning from products and processes embedded in FDI inflows and thus promoting local innovative output in the form of patents.
Table 8: Threshold Regressions24Dependent Variable: MFP
One Threshold Regression
1 2 3 4 5 VARIABLES Financial Development (IMF) Financial Institutions Development (IMF) Financial Institutions Depth (IMF) Financial Markets Development (IMF) Financial Market (WEF)
log Domestic R&D 0.065*** 0.095*** 0.081*** 0.083*** 0.122*** (0.003) (0.000) (0.000) (0.000) (0.000) log Foreign R&D Trade 0.047*** 0.043*** 0.041*** 0.046*** 0.037**
(0.001) (0.005) (0.007) (0.001) (0.016) log Foreign R&D FDI < Threshold -0.012*** -0.013*** -0.014*** -0.014*** -0.013***
(0.000) (0.000) (0.000) (0.000) (0.000) log Foreign R&D FDI > Threshold -0.008** -0.011*** -0.010*** -0.010*** -0.009***
(0.032) (0.002) (0.003) (0.002) (0.002) Constant 2.003*** 1.354** 1.745*** 1.578*** 0.769 (0.001) (0.021) (0.003) (0.005) (0.194) Observations 143 143 143 143 130 R-squared 0.311 0.250 0.264 0.321 0.352 Number of cnt 13 13 13 13 13
Country FE Yes Yes Yes Yes Yes
Threshold Value 0.822 0.881 0.718 0.725 3.761
Threshold Test P-value 0.270 0.920 0.480 0.190 0.280
pval in parentheses
*** p<0.01, ** p<0.05, * p<0.1
Bootstrap Estimation of Threshold after 100 Iterations
All R&D Stock Variables are measured with 1 Lag. Country Fixed Effects Jointly Significant at 1%
24 Panel Threshold regressions require balanced panels, hence this set of results refers to 13 countries form the sample.
24
6. Policy Implications and the case of Greece
In the case of Greece, resolution of the commercial banks’ balance sheets is the number one
challenge as identified by the Bank of Greece in the 2017 Governor Report (Bank of Greece, 2018). The results of the previous section underline the importance of the restoration of the domestic financial system for the bolstering of absorptive capacity as well. The Greek economy is not close to the global technological frontier in any sector (EIB, 2018), however shares the traits of a middle-income country with substantial gains to be reaped through technology transfer. Combined with the efforts to integrate domestic firms in reshaped Global Value Chains in the wake of the COVID-19 pandemic needs to be coupled with the deepening and re-building trust in the financial system the through the implementation of necessary reforms (Bank of Greece, 2019). Table 9 clearly depicts the ground to be covered in order for the Greek economy to reach the financial variable thresholds stemming from the empirical results25. The last
column calculates the ‘distance to frontier’ measure with the threshold value being set to 100.
With the notable exception of the World Bank indicators for private deposits and liquid liabilities, the level of the relevant financial variables stands between 50-75% of the threshold value in most cases (see also Graphs A3 and A4 in the Appendix). The latter implies that there is considerable action to be taken to increase the absorptive capacity of the economy and maximize the growth-enhancing effects of FDI inflows. The reform process can be emboldened by regional policy coordination and ongoing objective of the EU. More specifically, enhanced diversity funding sources is at the epicenter of the policy discussion in the EU with the proposed introduction of the Capital Markets Union (CMU) which is aimed to complement the Banking Union.26 This initiative is aimed to provide complementary funding to bank lending across EU
countries thus facilitating capital accumulation irrespective of the firms’ location. The data
reveal that the score of the Greek financial system is below the respective threshold variables in almost all institutional categories. Consequently, the ability to benefit from technological advanced created outside the national level can be invigorated through improvements in the financial systems combined with a set of reform policies addressed to the domestic R&D production.
The aforementioned conclusions are in line with one of the main policy targets outlined in the IMF’s Global Financial Stability Report (2017) which highlights that “Policymakers and regulators should fully address crisis legacy problems and require banks and insurance companies to
25 The values for the Greek economy refer to 2016, except for the World Bank Indicators where the latest available data is for 2015.
26In her speech given for the “EURO at 20” joint Conference in Dublin (June 2018) Managing Director of the IMF
Christine Laggard underscored that “[…] the euro area needs truly integrated financial and capital markets that allow
25
strengthen their balance sheets in advanced economies. This includes putting a resolution framework for international banks into operation, focusing on risks from weak bank business models to ensure sustainable profitability, and finalizing Basel III”. That said, policymakers should keep in mind that the rapid de-regulation preceding the financial crisis had adverse effects on the stability of the financial system. Hence, the liberalization process aiming at dismantling rigidities should be coupled with the implementation of necessary regulations and safety nets (IMF, 2017). In addition, the emergence of financial institutions depth as a robust determinant in the results highlights the importance of private sector credit and pension fund assets27for the availability of diverse sources of funding for domestic enterprises (ECB, 2017).
Working towards amplifying the set of institutions able to provide capital contributes to efficient and flexible domestic corporations, which in turn can collaborate with MNCs and deliver economic growth. As stated in Section 2.2 the existence and quality of domestic clients and suppliers skews foreign capital towards the host economy.
Table 9: Greece and Threshold Levels
Indicator Greece Threshold Level Distance to Threshold
Financial Market Index (WEF) 2.52 3.20 78.78
Financial Efficiency Index (WEF) 2.24 3.57 62.65
Venture Capital Index (WEF) 1.81 2.75 66.04
Bank Soundness Index (WEF) 2.74 5.67 48.29
Bank Deposits % GDP 94.93 98.18 96.69
Liquid Liabilities % GDP (WB) 99.54 98.18 101.38
Private credit by banks % GDP (WB) 115.04 101.30 113.56
Financial Development Index (IMF) 0.54 0.73 74.14
Financial Institutions Index (IMF) 0.57 0.88 64.90
Financial Markets Index (IMF) 0.50 0.55 91.66
Financial Institutions Depth (IMF) 0.33 0.70 46.22
Financial Institutions Access (IMF) 0.55 0.94 58.48
Financial Institutions Efficiency (IMF) 0.76 0.62 122.71
Financial Markets Depth (IMF) 0.51 0.75 67.94
Financial Markets Access (IMF) 0.58 0.52 111.84
27The indicator includes private credit, pension fund assets, mutual fund assets and insurance premia as a percentage of GDP (Svirydzenka, 2016).
26
7. Conclusion
In this paper we use data for 23 OECD economies to evaluate the non-linear effect of knowledge and technological advances developed outside national boundaries as postulated by the theory of knowledge spillovers (Grilliches, 1979; Aghion & Howitt, 1992, Coe & Helpmann, 1995). In the vein of the trade-growth literature we measure the effect of the foreign R&D stock weighted by bilateral capital goods imports and FDI flows. In addition, we account for domestic absorptive capacity (Coe & Levinthal, 1989) defined by the level of financial development of the host economy. Given the lack of a universally acclaimed variable to measure the concept of financial development we use a range of financial variables from the IMF, the World Economic Forum, and the World Bank. On top of standard econometric techniques and controlling for the existence of panel cointegration among the underlying variables, we use Panel Threshold analysis allowing for the cut-off point of financial performance to be endogenously determined. Our results indicate that trade-induced productivity spillovers are significant and robust across specifications, whereas foreign R&D appears to have a negative effect through the intermediate imported inputs channel. The results on the FDI-weighted foreign knowledge stock indicate that the depth and efficiency of the recipient country financial system can be viewed as a factor of absorptive capacity thus mediating the positive externalities form MNC presence. Most of the financial variables appear to facilitate knowledge spillovers above a certain threshold irrespective of that threshold being exogenously or endogenously determined. One should apply caution to these results, considering data issues concerning “true” bilateral FDI flows according to the OECD BMD4
definition. Nonetheless, a fruitful policy lesson for financially strained economies is that learning from the technological frontier to foster innovative activity can be more feasible in the context of a sound and developed financial system. In the case of the Greek economy, the ongoing process of structural reforms aiming at the reinvigoration of the domestic financial system and the incremental completion of the Banking and Capital Markets Union could serve as a conduit for speeding the catch-up process to the technological frontier.
27
References
Acemoglu, D. and Robinson, J. (2012). Why Nations fail. The origins of power, prosperity and poverty. Currency.
Acs, Z. J., Anselin, L., Varga, A. (2002). Patents and innovation counts as measures of regional production of new knowledge. Research Policy 31(7)
Aitken, B.J., and Harrison, A.E., (1999). Do domestic firms benefit from direct foreign investment? Evidence from Venezuela. American Economic Review, 89
Alcacer, J., Gittelman, M., (2006). Patent citations as a measure of knowledge flows: The influence of examiner citations. Review of Economics and Statistics 88(4).
Alfaro, L., A. Chanda, S. Kalemli-Ozcan, and S. Sayek (2004). FDI and Economic Growth: The Role of Local Financial Markets. Journal of International Economics 64.
Alfaro, L., A. Chanda, S. Kalemli-Ozcan, and S. Sayek (2010). How Does Foreign Direct Investment Promote Economic Growth? Exploring the Effects of Financial Markets on Linkages. Journal of
Development Economics 91
Aghion, P., Howitt, P., 1992. A model of growth through creative destruction. Econometrica 60(2). Aghion, P., Howitt, P.,(2005). Growth with Quality‐Improving Innovations: An Integrated Framework, in
Aghion, P. and Durlauf, S. N. (Ed), Handbook of Economic Growth. Amsterdam: Elsevier.
Archibugi, D. (1992). Patenting as an Indicator of Technological Innovation: A Review. Science and Public Policy.
Audretsch, D., Stephan, P., 1996. Company-scientist locational links: The case of biotechnology.
American Economic Review 86(3).
Audretsch, D., & Feldman, M. (1996). R&D Spillovers and the Geography of Innovation and Production. The American Economic Review, 86(3).
Baldwin, R. (2016). The Real Convergence. Information Technology and the New Globalization, Harvard University Press.
Barnard, H., Cantwell, J., 2006. Knowledge in the theory of the Firm and MNC: asset or action? A commentary on Foss N. “Knowledge and Organisation in the Theory of the MNC. J. Manage. Governance
10 (1).
Blalock G. , Gertler P. J. (2009). Welfare gains from foreign direct investment through technology transfer to local suppliers. Journal of International Economics.
Blundell, R. and Bond, S. (1998). GMM Estimation with Persistent Panel Data: An Application to Production Functions. The Institute for Fiscal Studies Working Paper, W99/4.
Bottazzi, Laura and Peri, Giovanni, (2003)., European Economic Review, 47.
Boschma, R. (2004). Competitiveness of Regions from an evolutionary perspective. Regional Studies
38(9).
Branstetter, L. (2000). Is foreign investment a channel of knowledge spillovers? Evidence from Japan’s
28
Branstetter, Lee. (2001). Are Knowledge Spillovers International or Intranational in Scope? Microeconometric Evidence from the U.S. and Japan. Journal of International Economics, 53.
Brown, J., Martinsson, G., Petersen, B., 2012. Do financing constraints matter for R&D? European
Economic Review 56(8).
Cantwell, J. & S. Iammarino (1998). MNCs, Technological Innovation and Regional Systems in the EU: Some Evidence in the Italian Case. International Journal of the Economics of Business, 5:3.
Coe, David, Elhanan Helpman, and Alexander Hoffmaister (2008). International R&D Spillovers and Institutions. CEPR Working Paper , 6882
Coe, David, Elhanan Helpman, and Alexander Hoffmaister (1997). North-South spillovers. Economic Journal 107
Coe, D and Helpman, E. (1995). .International R&D Spillovers. European Economic Review 39(5):859-887 Cohen, W., and D. Levinthal (1989). Absorptive capacity: a new perspective on learning and innovation.
Administrative Science Quarterly 35.
Crescenzi, R. & Rodriguez-Pose, A. (2011). Innovation and Regional Growth in the European Union.
Springer.
Cooke, P. & Morgan, K. (1998). The association economy: Firms, regions and innovation. Oxford University Press.
Dellis, K, Sondermann, D and I. Vansteenkiste, 2017.Determinants of FDI Inflows in Advanced Economies: Does the Quality of Economic Structures Matter? ECB Working Paper 2066.
Dellis, K. Sondermann, D. & I. Vansteenkiste (2020), Drivers of Genuine FDI Inflows in Advanced Economies, The Quarterly Review of Economics and Finance.
Deltas, G. and Karkalakos, S. (2013). Similarity of R&D Activities, Physical Proximity and R&D Spillovers. Regional Science and Urban Economics
Drivas, K., Economidou, C. and Karkalakos, S. (2014), "Spatial Aspects of Innovation Activity in the US", Journal of the Knowledge Economy
Easterly, W. (2013). The Tyranny of Experts: Economists, Dictators, and the Forgotten Rights of the Poor. Basic Books
European Investment Bank (2018). Investment Report 2018/2019 – Retooling Europe’s Economy.
Fagerberg, J. (1994). Technology and International Differences in Growth Rates. Journal of Economic
Literature 32.
Gorg, H., and E. Strobl (2005). Spillovers from foreign firms through worker mobility: an empirical investigation. Scandinavian Journal of Economics.
Gorodnichenko, Y. , Svejnar, J. , Terrell, K. ,2014. When does FDI have positive spillovers? Evidence from 17 transition market economies. J. Comp. Econ 42
Gorodnichenko, Yuriy & Svejnar, Jan & Terrell, Katherine, 2020. "Do foreign investment and trade spur innovation?," European Economic Review, vol. 121
29
Griffith, R., S. Redding, and H. Simpson (2003). Productivity Convergence and Foreign Ownership at the Establishment Level. CEPR Working Paper
Griliches Z. (1992) The search for R&D spillovers. Scandinavian Journal of Economics, 94
Griliches, Z. (1979). Issues in assessing the contribution of research and development to productivity growth. Bell Journal of Economics, 10
Griliches, Z. (1979) . Productivity, R&D and Basic Research at the Firm Level in the 1970s. Amer- ican
Economic Review.
Grossman, G., and E. Helpman (1991). Innovation and Growth in the Global Economy. MIT Press. Hadri, K. (2000). Testing for stationarity in heterogeneous panel data. Econometrics Journal, 3 (2).
Hall, B.H. and Lerner, J. (2010). Financing R&D and innovation”. In B. H. Hall and N. Rosenberg (eds),
Handbook of the economics of innovation, Volume 1.
Harrison, A.E., Love, I., McMillan, M.S., 2004. Global capital flows and financing constraints. Journal of Development Economics 75 (1).
Haskel, J.E. , Pereira, S.C. , Slaughter, M.J. , 2007. Does inward foreign direct investment boost the productivity of domestic firms? Rev. Econ. Stat. 89 (3),
Jaffe, A. (1986). Technological opportunity and spillovers of R&D: Evidence from firm’s patents, profits,
and market value. American Economic Review, 76(5).
Jaffe, A. (1988). Demand and supply influences in R&D intensity and productivity growth. Review of
Economics and Statistics, 70(3).
Jaffe, A. and M. Trajtenberg (1998). . International Knowledge Flows: Evidence from Patent Citations.
NBER Working Paper, 6507
Jaffe, A. and M. Trajtenberg (2002). Patents, Citations and Innovations: A Window on the Knowledge
Economy. Cambridge: MIT Press.
Jaffe, A., M. Trajtenberg and R.Henderson (1993). . Geographic Localization of Knowledge Spillovers as Evidenced by Patent Citations. Quarterly Journal of Economics 108
Javorcik, B.S. (2004). Does Foreign Direct Investment Increase the Productivity of Domestic Firms? In Search of Spillovers through Backward Linkages. American Economic Review, Vol. 94(3)
Javorcik, B.,Wei, S., 2009. Corruption and cross-border investment in emerging markets: Firm-level evidence. Journal of InternationalMoney and Finance 28.
Javorcik,BS and M Spatareanu (2008). To share or not to share: Does local participation matter for spillovers from foreign direct investment?Journal of development Economics.
Jones, C andRomer, P. (2009). The new Kaldor Facts: Ideas, Institutions, Population and Human Capital.
NBER Working Paper Series
Keller, W. (2004) International Technology Diffusion. Journal of Economic Literature
Keller, Wolfgang (2002a). Geographic localization of international technology diffusion. American
Economic Review, 92
Keller, Wolfgang (2002b). Trade and the transmission of technology. Journal of Economic Growth