Performance and Environment Monitoring for Whole-System
Characterization and Optimization
Robert W. Wisniewski
‡Peter F. Sweeney
‡Kartik Sudeep
‡Matthias Hauswirth
§¶Evelyn Duesterwald
‡Calin Cascaval
‡Reza Azimi
∗†Abstract
As performance advances achievable through chip fabri-cation technology are reaching their limits, other areas of system design need to be explored. Several differ-ent possibilities exist. Our research in the context of the DARPA HPCS project PERCS [11] aims at an infrastruc-ture to characterize and understand the interactions be-tween hardware and software and to affect optimizations based on those characterizations. To achieve this, we have designed and implemented a performance and environ-ment monitoring (PEM) infrastructure that vertically in-tegrates performance events from various layers in the ex-ecution stack. The performance understanding achieved with PEM can be used to help tune application behavior on existing systems or potentially to improve future archi-tecture designs by analyzing the PEM data collected on a whole system simulator while varying architecture char-acteristics.
We have developed an architecture for continuous pro-gram optimization (CPO) to assist in, and automate the challenging task of performance tuning a system. CPO utilizes the data provided by PEM to detect, diagnose, and eliminate performance problems. We designed and im-plemented a PEM prototype that feeds the vertical event stream to a performance visualizer, our first PEM client. This paper describes the CPO architecture, how PEM in-teracts with CPO, an experiment using the PEM visual-ization client to understand data gathered across multiple layers of the system, and how that data was used to posi-tively affect system performance.
¶University of Colorado at Boulder
‡IBM T. J. Watson Research Center. Work supported by Defense
Advanced Research Project Agency Contract NBCH30390004
†University of Toronto
1
Introduction
The need for increased performance and functionality has created a complex system stack consisting of multiple ex-ecution layers. Each layer in itself is complicated and challenging to understand. Understanding performance that involves multiple layers requires considerable exper-tise and sophisticated tools. For example, hardware re-sources may be added to or removed from the system dy-namically, current machines run a disparate and varying set of applications, and even single applications may go through phases with different performance behavior and resource requirements. To obtain good system perfor-mance in these complex environments an infrastructure that provides vertical integration of events from the hard-ware layer through the application is needed.
We have developed a performance and environment mon-itoring (PEM) infrastructure that supports understanding the interactions between hardware and software and al-lows us to make optimizations based on those characteri-zations. These optimizations could take the form of archi-tectural design improvements achieved by varying hard-ware characteristics on a simulator with PEM providing data on the total system performance and details of the ef-fects on components of the entire execution stack. For ex-ample, we have begun work on evaluating a new memory model in PERCS, IBM’s prototype for the DARPA HPCS effort [11]. Although this paper does not focus on us-ing PEM for evaluatus-ing potential architecture design, we believe PEM provides architects a crisper view of how a particular feature affects program behavior.
Another optimization approach supported by PEM is ver-tical performance tuning across execution layers. The PEM infrastructure provides data about the interaction of hardware and software, and of all the layers within the software. In order to be effective in a complex environ-ment, a performance tuning infrastructure must be able to not only gather data from all the layers of the execution stack, but must also be able to continuously react to
per-formance problems as they arise throughout the lifetime of an application and system.
We have developed a software architecture for continuous program optimization (CPO) as an approach to help auto-mate the challenging task of performance tuning. In CPO, performance tuning is a continual process of feedback-directed adaptation along two dimensions: (1) adapting applications to their current execution environment and (2) adapting the execution environment to enhance appli-cation performance.
CPO may be conceptualized as two phases: monitoring and optimizations. Monitoring involves obtaining and an-alyzing performance information at varying granularities and across layers of the system. Optimization involves us-ing the information to affect changes in the application or system. Examples include: compiler JIT (Just In Time) optimizations [5], hot swapping operating system compo-nents [3], redistributing application workloads, etc. While CPO is conceptually divided into two phases, both are continually occurring to evaluate the effectiveness of tun-ing and to instantiate adjustments as needed.
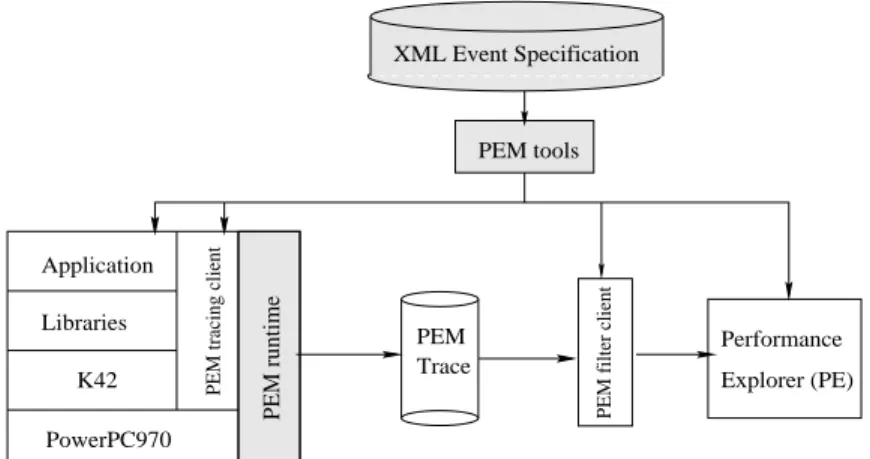
The PEM infrastructure, which is the focus of this paper, is a crucial part of the CPO architecture as illustrated in Figure 1(a). Each participating execution layer emits its performance events into PEM, which provides an inte-grated view of performance to PEM clients. These clients are the modules that consume events, compute correla-tions between events from different layers and implement specific CPO tuning scenarios.
PEM consists of several components. There is a specifi-cation component that defines the events to be monitored. As described in Section 3.1, we chose XML as the speci-fication language to provide a language-independent way to attach semantic meaning to the event definition. Another reason to use XML is to facilitate the construc-tion of PEM tools, which present the second component of PEM. Described in Section 3.2, PEM tools produce inter-faces and stubs that tailor the generic specification to spe-cific needs of the implementation of PEM clients. Also part of the tools are filters that convert the PEM event stream (optimized for fast event generation) into other for-mats, for example, a visualizer stream format.
The final component of PEM, described in Section 3.3, is the PEM runtime which is an implementation of the spec-ification on a given system. We implemented the PEM runtime on the K42 open-source research operating sys-tem [14]. K42 already has a significant performance mon-itoring infrastructure [25] and provides an easy prototyp-ing environment. Further, K42 was designed to be scal-able and contains support for hot swapping [22], a useful feature for CPO. As we develop experience with the PEM
infrastructure, the successful portions can be implemented on other operating systems, and work has begun to inves-tigate porting it to AIX and Linux.
Figure 1(b) shows our prototype implementation of the PEM infrastructure on PowerPC970 along with a PEM visualization client to display the collected PEM event stream. We have written an XML specification and used it to monitor events from the hardware, operating system, libraries, and applications. The visualization client con-sists of the Performance Explorer (PE) visualizer, and two PEM clients generated by our PEM tools: one online trac-ing client to log the monitored events and produce a PEM trace, and a filter client that converts the PEM event trace into the format expected by PE.
We have used the PEM infrastructure and visualization client to study and improve the behavior of one of the ASCI Purple benchmarks, UMT2K [2]. In a short pe-riod of time, using the PEM infrastructure, we analyzed the performance of UMT2K, determined a performance deficit, implemented an environment optimization, re-evaluated the performance, and fine tuned the optimiza-tion. We present this experiment in Section 4.
2
The CPO Approach
Continuous Program Optimization is an architecture to as-sist in and automate the challenging task of performance tuning. In CPO, performance tuning is viewed as a con-tinuous process of feedback-directed adaptation along two dimensions: (1) adapting the application to its current ex-ecution environment and (2) adapting the exex-ecution envi-ronment to optimally enhance application performance. While the idea of feedback-directed optimization is not new, CPO extends it to a more dynamic, negotiation-based optimization process. Optimizations are imple-mented through agents that are instances of PEM clients. These CPO agents model the application behavior based on performance data, which may come from all layers of the hardware and software through PEM. Based on these performance models, CPO agents negotiate resources that may either directly enhance performance or do so indi-rectly, by enabling further code adaptations. The CPO agents implement performance tuning by continuously executing the following steps:
1. Base monitoring: Use models of expected perfor-mance to detect perforperfor-mance deviations and bottle-necks.
2. Tuning: Apply the optimization with the highest ex-pected benefits based on the performance modeling
Libraries K42 PowerPC970
(b)
PEM filter client
(a) Application Application Explorer (PE) OS VM/Libs Hardware/Simulator Performance PEM
PEM tracing client
PEM runtime XML Event Specification PEM client PEM runtime XML Event Specification Trace
PEM tools PEM tools
Figure 1: Overview of CPO: (a) the PEM infrastructure and (b) the PEM visualization client. given the currently available resources; negotiate
ad-ditional resources with other software layers, and if resources are granted, apply further optimizations.
3. Validation monitoring: Continuously monitor and validate that the optimizations performed meet the projected benefits.
To ensure progress, CPO agents maintain the history of past optimizations and their projected and actual perfor-mance metrics.
Specific instances of CPO adaptation include: (a) tuning of compiler optimization heuristics in a Java JIT com-piler, such as inlining policies, loop unrolling and tiling parameters, etc.; (b) tuning of scientific, e.g., linear alge-bra [21, 24, 10] and communication lialge-braries to adapt to the actual application usage; (c) selecting different algo-rithms to solve a specific problem based on the character-istics of the input data set [16]; (d) environment adaptation such as the tuning of Java Virtual Machine (JVM) compo-nents (heap size and garbage collection policies), tuning operating system resources such as memory available for the JVM, or changing the page size for different regions of memory allocated to an application [19]; and (e) modi-fying the operating system page replacement policy based on application’s memory usage patterns [22].
There may be several CPO agents active concurrently, and their resource requirements may be conflicting. The com-mon PEM infrastructure is a means for resolving poten-tial conflict by providing each agent with a view of per-formance events across the entire system. Through PEM, CPO agents can coordinate their activities by monitoring the system for performance events issued by other agents.
3
PEM Infrastructure
PEM is the backbone of our vertical monitoring infras-tructure. This section discusses its three components in more detail.
3.1
XML Event Specification
The first component of PEM consists of a repository of XML event specifications that defines the monitoring scope. The XML specification of an event defines the event semantics and may contain several fields to describe specific event attributes. The XML event specification provides a unified location for encoding event semantics. For example, the fact that a send and a receive event in a library (such as MPI) establish a communication pair based on a common communication port identifier consti-tutes semantic information. Any two such events will be linked, even though the ports may differ between pairs of events. Figure 2 shows an example, in XML, of encod-ing the event of readencod-ing the contents of hardware perfor-mance counters. The specification specifies the context of the event and lists several fields defining data that will be stored with the event.
We have written an XML specification containing sev-eral hundred hardware, operating system, and application layer events. Besides the benefits of readability and avail-ability of XML parsers that can be used to build tools, we chose to use XML to satisfy several crucial design re-quirements:
• Language-independent support for building tools to
aid in the development of PEM clients, as explained in the next section;
<event name=’HW::HWPerf::HPMsAndPC’
description=’Hardware counter events and program counter for threadId’> <layerId value=’HW’ />
<classId value=’HWPerf’ /> <specifier value=’HPMsAndPC’ /> <fields>
<field name=’pc’ type=’uint64’
description=’program counter’ /> <field name=’threadId’ type=’uint64’
description=’kernel thread id’ /> <field name=’counterValues’ type=’list’
eltType=’uint64’
description=’counter values.’ /> </fields>
</event>
Figure 2: Example of an XML event specification
• Flexibility to add and modify events and their
seman-tics. Additional execution layers that produce new events (e.g., new libraries) can easily be integrated into PEM by adding new event specifications into the repository;
• Documentation. Having a single place with explicit
field names and descriptions for entities stored in an event record encourages developers to better docu-ment event semantics.
3.2
PEM XML Tools
We have implemented a set of tools that take the XML specification as input and generate language-specific in-terfaces and stubs. We currently support the C, C++, Java, and Fortran languages. The tool set contains three classes of tools:
1. Instrumentation tools 2. PEM runtime tools 3. Client-specific tools
The first class of tools facilitates instrumentation of the execution layers to emit event notifications to PEM. The tools automatically generate language-specific header files for the instrumentation interface.
The second class facilitates the development of the PEM runtime, for example, the K42-based implementation. These tools generate the header files and stubs for event record definition and the interfaces that are implemented by the PEM runtime.
The third class facilitates the development of PEM clients by tailoring the generic event specification to the specific needs of a client. Both, the PEM runtime and the PEM clients are concerned with event streams. However, the requirements of how the event stream should be structured may be very different between the PEM runtime (i.e., the event generating agent) and PEM client (i.e., the event consuming agents).
Event generation is best implemented as a raw event
stream that minimizes the information contained in each
event record so as to log events as quickly and as space-efficiently as possible. Contextual information, such as the currently executing process and thread ID, is omitted since it can be recovered from previously logged raw con-text switch events.
In contrast, event consumption in PEM clients is typically based on an interpreted event stream. Interpretation of the event stream is needed to implement client-specific filter-ing. During interpretation, relevant contextual informa-tion that was omitted from individual raw event records is recovered based on client-specific semantic criteria. For example, consider our visualization client; the client acts as a bridge between the raw event stream coming from PEM and the event requirements of the visualizer, performance explorer (PE). PE provides a rich GUI for se-lecting and configuring various views of the event stream. To efficiently support this GUI, PE expects complete con-text information to be available in every record in the vi-sualization event stream.
To accommodate PE requirements, the visualization client translates the raw PEM event stream into a context-enriched visualization stream for PE. The semantic infor-mation about what constitutes the event context is fully contained in the XML event specification. Thus, we were able to write a client-specific tool to automatically gener-ate the translation code, in this case Java class files.
3.3
PEM Runtime on K42
We implemented the PEM infrastructure for gathering event information from all layers of the system, leverag-ing the efficient tracleverag-ing facility in K42 [14, 25]. Because vertical event integration is one of the goals, we imple-mented a single shared buffer across all layers of the sys-tem. On a per-processor basis, the buffer provided a sin-gle, shared, monotonically time increasing log of events. This was accomplished by mapping the event buffer and control structures into the address space of each process. The event buffer is implemented as a circular set of smaller buffers. The event control structure maintains an index that points to the current offset in the currently
0
proc A B A proc B B2
3
current index current index current index current index current index1
Figure 3: Illustration of lock-free event logging
active buffer. The event buffer supports variable length events [25]. Advantages of using variable length events include the efficient logging of short events without re-quiring special continuation events for logging longer events. Our PEM runtime implementation uses atomic primitives to achieve an efficient lock-free multiprocessor implementation of variable length events.
Conceptually, each process attempts to reserve sufficient space in the buffer for the event it intends to log. Once the process makes a successful reservation, it may proceed to log its data. To reserve space, a process attempts to atomi-cally increment the current index using acompare and
store operation. The process that successfully
incre-ments the index (as determined by the return value of the
compare and storeoperation) has the right to
pro-ceed to log data into the buffer. Failing processes retry. Figure 3 shows the lockless event logging for two pro-cesses, A and B. In step 0, the current index shows the initial configuration. In step 1, both A and B read the cur-rent index and attempt to atomically increment the curcur-rent index by the size of the event being logged. The winner, in this case process B, will log the event immediately follow-ing the old current index (step 2). This will be followed by process’s A data, assuming no other competing processes attempt to log more data (step 3). Because it is important to guarantee monotonically increasing timestamps, pro-cesses must re-determine the timestamp during each at-tempt to atomically increment the index. If the timestamp was not determined as part of the atomic reserve operation then that process may be interrupted by another process that succeeds in reserving the next slot in the buffer, but obtains an earlier timestamp.
The memory for logging events is logically divided into buffers. The size of each buffer in K42 determines the alignment boundary for allowing random access into the buffer space even with variable length events. Once a buffer is full, the logging facility proceeds to the subse-quent buffer, and the previous buffer is available to be written out (to disk or network).
4
Preliminary Experiments
This section presents our first experience using PEM and a visualization client to understand performance events across execution layers and to improve the performance of an application using the event information. Although be-low we describe a manual process, it is only the first step towards understanding what data needs to be collected and what event patterns need to be detected to automate this process in the CPO framework.
We have collected a PEM event trace for UMT2K, one of the PERCS scientific applications, running on K42 on a Power Mac G5 with PowerPC970 processors [1]. The UMT2K application, written in a mix of C and Fortran, is a 3D, deterministic, multi-group, photon transport code for unstructured meshes [2]. We have collected events across the following execution layers:
• Application Layer: The core of UMT2K takes place
in a nested loop and we instrumented the code to emit phase marker events that indicate the iterations in the loop nest. In a CPO scenario, the compiler automat-ically inserts application markers to delineate opti-mization regions, such as loops;
• Operating System Layer: K42 was instrumented to
emit a variety of operating system events, such as context switches, system and kernel calls, locking and synchronization events, and page faults;
• Hardware Layer: Power Mac G5 provides a rich set
of hardware performance counter events. Among others, we collected: Instructions completed Per Cy-cle (IPC),L1 data cache load misses (L1 misses), data TLB misses (TLB misses), and data ERAT (Effective-to-Real Address Translation) table misses (ERAT misses).
4.1
Initial Run
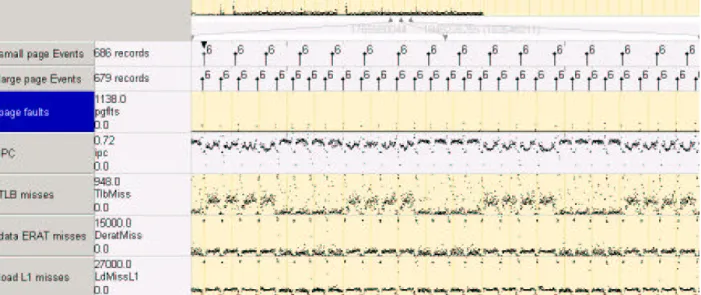
Figure 4 shows a view of the UMT2K event trace in PE. The X-axis represents time and the six event plots show data for a selected interval. The overview plot at the top of the figure shows the entire run and the arrows indicate the interval that was selected. As illustrated by this snap-shot, the power of PEM is the vertical integration it pro-vides. Within the same framework we can analyze appli-cation, library, virtual machine (if applicable), operating system, and hardware events. The strip entitled ”most loop” shows the application markers for the inner-most loop (phase 6). Each marker indicates the beginning of a loop iteration. The remaining strips show frequency
Figure 4: Initial Run: PE view of UMT2K across execution layers for small pages.
plots, where the Y-axis indicates the frequency of events every 4 million cycles. The first frequency plot shows an OS event: the number of page faults. The next strips show hardware events: the IPC, L1 misses, TLB misses, and ERAT misses. This is just one of the multiple views PE provides, and we show only a sample of the data events that PEM collects.
4.1.1 Periodicity Across Layers
The first observation is the periodic pattern of the metrics during execution. The application phase markers show that this pattern is correlated with the innermost loop. The periodic pattern persists across across execution layers. It has been observed that similar periodic patterns tend to persist across hardware counter events [9] and the looping structure of the program was assumed to be the cause of periodicity. PEM provides the necessary infrastructure to pinpoint the exact loop that is correlated with the observ-able periodic patterns. Moreover, PEM illustrates that the periodic pattern is not limited to hardware counter events and extends into operating system software events, such as page faults.
4.1.2 Event Correlation
The second observation is the correlation of the behavior within each periodic phase (i.e., within each loop itera-tion). Figure 4 shows a strong inverse correlation between TLB misses and IPC. As TLB misses rise during each it-eration IPC goes down, suggesting that TLB miss behav-ior is a strong factor in overall application performance. There is also a visible inverse correlation between page faults and IPC. At the beginning of each loop iteration, there is a sudden rise in page faults along with a drop in IPC.
4.1.3 Persistent Page Faults
The final observation is the persistent occurrence of page faults. Over the entire UMT2K run 12,227,841 page faults occurred. As the view in Figure 4 shows each iteration triggers a new rise in page faults to load the next iter-ation’s working set. Closer inspection of the page fault events and their attributes, which include the faulting ad-dress, showed that each iteration of the innermost loop traverses a large address range. At the beginning of each iteration, a number of large data structure in the range of 8-10MB is allocated, initialized, and then processed. This pattern pointed to a potential optimization: mapping the traversed data structures to large pages to avoid excessive page faults.
4.2
Second Run with Large Page Mapping
The Power Mac G5 CPU offers two page sizes: small 4KB pages (default) and large 16MB pages. For our second run we tried to eliminate excessive page faults by mapping the important data structures in UMT2K to large pages. The application markers indicate that the majority of page faults were generated from the innermost loop. We used these markers to identify the relevant data structure in the code and mapped each of them to a large page. We then reran UMT2K to collect a second event trace.
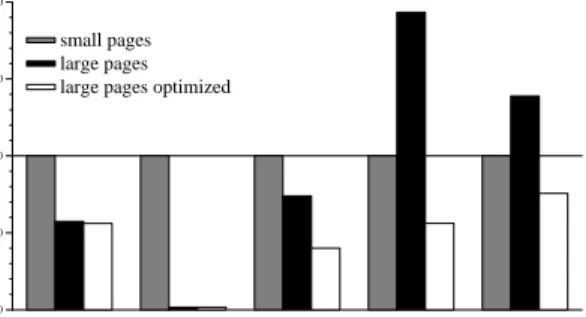
Figure 6 shows the resulting performance improvement over the initial small page run (bar entitled ”large page”). Page faults are virtually eliminated and execution time is reduced by 42%. Examining only the effects on page faults, our simple strategy for mapping large pages would appear to be successful. However, since PEM provides events from the entire stack, we were able to evaluate the impact of this optimization on other layers before declar-ing success. Movdeclar-ing to large pages should reduce the TLB pressure since fewer pages are touched over the entire run. Figure 6 shows a corresponding reduction in TLB misses. However, the figure also shows some inadvertent side ef-fects of our optimization. Both ERAT and L1 misses were significantly increased. L1 misses were increased by 34% and ERAT misses by 93%.
To illuminate this performance phenomenon further, con-sider Figure 5 showing the PE view of the second run for the same time interval as in Figure 4. The topmost appli-cation marker bar is copied from Figure 4 to allow com-parison between the two runs. As can be seen from the phase marker strips, the initial run completes 16 loop iter-ations while the second run completes 29 iteriter-ations in the same interval. The faster iteration completion time corre-sponds to the 42% overall execution time speedup. Figure 5 shows that drop in IPC at iteration boundaries is less pronounced in the second run, most likely a re-sult of the eliminated page faults at iteration boundaries. The inverse correlation between IPC and TLB misses is less visible because TLB misses have been reduced and are now more visually dispersed. The important observa-tion in comparing the two runs are the new bands of high ERAT and L1 misses at the beginning of each iteration that were not present in the initial run. These additional bands of misses are the cause for the significant overall increase in L1 and ERAT misses seen in Figure 6. Our optimization strategy for mapping large pages did not change the application’s memory access patterns. Thus, the only plausible explanation for the additional ERAT and L1 misses were conflicts. We therefore refined our initial naive implementation of large page allocation.
Time page faults TLB misses ERAT misses L1 misses 0 50 100 150 200 % of small pages small pages large pages large pages optimized
Figure 6: Performance of UMT2K with large pages rela-tive to small page performance.
4.3
Third Run with Optimized Large Page
Mapping
Our initial strategy for mapping large pages allocated each data structure accessed in the inner loop on a separate large page. The loop iterations proceed by accessing the same elements of several large arrays in each iteration. Large pages are aligned on 128-byte boundaries which is the size of a cache line. Thus, accessing the same el-ements of different arrays (aligned at large page bound-aries) increases the potential for conflicts in the L1 cache. A similar explanations holds for the additional ERAT misses. Large pages are also aligned at 4KB boundary, which is the indexing granularity for the ERAT table. We devised an optimized mapping strategy to stagger the starting addresses of the data structures mapped to the 16MB pages to avoid these conflicts. With this opti-mization, the same elements from different pages are no longer address-aligned, thereby avoiding conflicts in the L1 cache and the ERAT table.
The data in Figure 6 for the optimized large page run con-firms that the staggering strategy significantly reduced the L1 and ERAT misses. In fact, by proactively avoiding alignment conflicts, we improved the ERAT and L1 cache miss behavior over the initial run. Execution time was further reduced by 3%.
4.4
CPO Approach to Large Page Mapping
In summary, our experiment emphasizes the importance of evaluating performance across execution layers. With-out understanding the performance effects of our adjust-ments across both the operating system and the hardware layer we would not have been able to detect the adverse performance side effects of our initial large page mapping
strategy.
So far, we have used PEM and the visualization client to manually tune application performance. Our goal in CPO is to develop PEM clients that automate the adjustments, such as the migration to large pages.
We are currently designing the details of the three CPO steps described in Section 2 for the large page scenario. Initially, we are planning to implement the migration to large pages across runs. In this model, base monitoring is implemented during an initial training run. The migration to large pages is implemented offline, between runs, and validation monitoring is implemented in a light-weight fashion as a permanent component of application execu-tion.
The base monitoring uses PEM to keep track of memory access and paging behavior as the primary performance events affected by a change in page size. If a performance deficiency, such as an unusually high page fault or page ta-ble miss rate is detected, the PEM client switches to more detailed monitoring to identify the data structure that are candidates for large page mapping. One possibility we are currently pursuing is to use application markers for this process. In our experiment we manually inserted applica-tion markers into the code. However, markers may also be inserted by the compiler to mark important loops and regions where data structures are dynamically allocated (such as the innermost loop in UMT2K). By inspecting the memory access and paging behavior for specific ap-plication marker intervals, the PEM client identifies a pool of data structures that are likely to be the cause of the ob-served performance deficiency, analogously to what we did manually in our experiment for the innermost loop. By the end of the base monitoring run, the PEM client has produced a CPO log containing the pool of candidate data structures along with the monitor patterns that triggered their selection.
The base monitoring log is inspected by the compiler of-fline to implement the large page mapping by inserting the appropriate directive in the code. We are planning to implement validation monitoring with minimal overhead so that it can be a permanent component of the execution of the application. If the validation monitoring indicates a performance deviation from the intended effect, new CPO log information is generated to trigger further offline tun-ing.
We are currently working on the many details that have to be developed in order to implement this CPO large page scenario.
5
Related Work
There has been considerable work in tracing for under-standing kernel (LTT [26], KernInst [23], K42 [25]) and application behavior (Paradyn [17], SvPablo [8]). In ad-dition, DTrace [6] and CrossWalk [18] allow event collec-tion across system call boundaries. OProfile is a profiler for Linux for system-wide sampling of hardware perfor-mance counters [7]. Most of the previous work focuses on off-line data collection and post-mortem visualization. The main contribution of this paper is an infrastructure for vertical monitoring and on-line optimization. In addition to previous work, we enable data collection seamlessly across multiple layers of hardware and software. Our sys-tem is also designed to allow data to be processed on-line. If off-line traces are desired, we showed how a simple client can be written to extract the data from the collec-tion stream.
Other performance visualization tools include: Intel’s VTune [13], SGI’s SpeedShop [27], Apple’s Shark [4], and Paraver [20]. Kimelman et al. [15] present PV, a performance visualization infrastructure focused on pre-senting temporal information from multiple levels of the system. Hauswirth et al. [12] show that for understand-ing modern, object-oriented systems, a vertical approach to performance understanding across system layers is im-portant. Much of the visualization functionality provided by their visualizer PE is present in any of the above tools and we could have chosen a different visualization tool to support our work on PEM.
6
Conclusions
We presented a Continuous Program Optimization (CPO) architecture to allow automatic tuning of application per-formance in today’s complex hardware and software en-vironment. The focus of this paper was on the Per-formance and Environment Monitoring (PEM) aspect of CPO that vertically integrates and analyzes performance events from the various layers of the execution stack. We presented our XML specification for describing PEM events and our implementation of the PEM infrastructure on K42, a prototype open-source research operating sys-tem.
We then showed how we used this infrastructure to detect and improve the performance of UMT2K, a scientific ap-plication. Through this experiment, we showed the ben-efits of the vertical integration PEM provides. Work is on-going to take the manual process and integrate into the automatic CPO infrastructure.
References
[1] Apple computer power mac g5. http://www.apple.com/powermac. [2] The asci purple bench. http://www.llnl.gov/asci/purple/
bench-marks/limited/umt/umt1.2.readme.html.
[3] J. Appavoo, K. Hui, M. Stumm, R. Wisniewski, D. da Silva, O. Krieger, and C. Soules. An infrastructure for multiprocessor run-time adaptation. In WOSS - Workshop on Self-Healing
Sys-tems, 2002.
[4] Apple. Shark. http://developer.apple.com/tools/performance/. [5] J. Aycock. A brief history of just-in-time. ACM Comput. Surv.,
35(2):97–113, 2003.
[6] B. M. Cantrill, M. W. Shapiro, and A. H. Leventhal. Dy-namic instrumentation of production systems. In USENIX
2004 Annual Technical Conference, Boston, MA, June 2004.
http://www.usenix.org/events/usenix04/tech/general/cantrill.html. [7] W. E. Cohen. Multiple architecture characterization of the linux
build process with OProfile. In Workshop on Workload
Character-ization, 2003.
[8] L. A. DeRose and D. A. Reed. SvPablo: A multi-language architecture-independent performance analysis system. In
Pro-ceedings of the International Conference on Parallel Processing (ICPP’99), Fukushima, Japan, September 1999.
[9] E. Duesterwald, C. Cascaval, and S. Dwarkadas. Characterizing and predicting program behavior and its variability. In Proceedings
of the Twelfth International Conference on Parallel Architectures and Compilation Techniques (PACT’03)), pages 220–231. IEEE
Computer Society Press, October 2003.
[10] M. Frigo and S. G. Johnson. FFTW: An adaptive software ar-chitecture for the FFT. In Proc. 1998 IEEE Intl. Conf. Acoustics
Speech and Signal Processing, volume 3, pages 1381–1384. IEEE,
1998.
[11] R. Graybill. High productivity computing systems. http://www.darpa.mil/ipto/programs/hpcs/.
[12] M. Hauswirth, P. F. Sweeney, A. Diwan, and M. Hind. Vertical profiling: Understanding the behavior of object-oriented applica-tions. In Proceedings of the 19th Annual ACM SIGPLAN
Confer-ence on Object-Oriented Programming, Systems, Languages, and Applications (OOPSLA). ACM Press, October 2004.
[13] Intel. VTune performance analyzers. http://www.intel.com/software/products/vtune, 2003.
[14] The K42 operating system, http://www.research.ibm.com/k42/. [15] D. Kimelman, B. Rosenburg, and T. Roth. Strata-various:
multi-layer visualization of dynamics in software system behavior. In
Proceedings of the Conference on Visualization (VIS’94), pages
172–178. IEEE Computer Society Press, October 1994. [16] X. Li, M. J. Garzaran, and D. Padua. A dynamically tuned sorting
library. In Proceedings of the International Symposium on Code
Generation and Optimization (CGO), Palo Alto, CA, March 2004.
[17] B. P. Miller, M. D. Callaghan, J. M. Cargille, J. K. Hollingsworth, R. B. Irvin, K. L. Karavanic, K. Kunchithapadam, and T. Newhall. The Paradyn parallel performance measurement tools. IEEE
Com-puter, 28(11):37–46, November 1995.
[18] A. V. Mirgorodskiy and B. P. Miller. CrossWalk: A tool for perfor-mance profiling across the user-kernel boundary. In International
Conference on Parallel Computing (ParCo), Dresden, Germany,
[19] J. Navarro, S. Iyer, P. Druschel, and A. Cox. Practical, transparent operating system support for superpages. SIGOPS Oper. Syst. Rev., 36(SI):89–104, 2002.
[20] Paraver. European Center for Parallelism of Barcelona, http://www.cepba.upc.es/paraver/.
[21] M. Pschel, B. Singer, J. Xiong, J. Moura, J. Johnson, D. Padua, M. Veloso, and R. W. Johnson. Spiral: A generator for platform-adapted libraries of signal processing algorithms. Journal of High
Performance Computing and Applications, Special issue on Auto-matic Performance Tuning, 18(1):25–41, 2004.
[22] C. A. N. Soules, J. Appavoo, K. Hui, R. W. Wisniewski, D. da Silva, G. R. Ganger, O. Krieger, M. Stumm, M. Auslander, M. Ostrowski, B. Rosenburg, and J. Xenidis. System support for online reconfiguration. In USENIX, pages 141–154, San Antonio, TX, June 9-14 2003.
[23] A. Tamches and B. P. Miller. Fine-grained dynamic instrumenta-tion of commodity operating system kernels. In OSDI 99: Third
Symposium on Operating Systems Design and Implementation,
pages 117–130, New Orleans, February 1999.
[24] R. Whaley and J. Dongarra. Automatically tuned linear algebra software. Technical Report UT CS-97-366, LAPACK Working Note No. 131, University of Tennessee, 1997.
[25] R. W. Wisniewski and B. Rosenburg. Efficient, unified, and scal-able performance monitoring for multiprocessor operating sys-tems.
[26] K. Yaghmour. Ltt web page. http://www.opersys.com/LTT/index.html.
[27] M. Zagha, B. Larson, S. Turner, and M. Itzkowitz. Performance analysis using the MIPS R10000 performance counters. Nov. 1996.