wis
(35;
POLICY RESEARCH WORKING PAPER
1352
Trade and Gro-wth
A deterioration of the terms oftrade or a dedine in world
in
Ecuador
demand has a pronouncednegative i-npact on Eacador's
A Partial Equilibrium View trade babance and thus
threatens growth T exterrnal hinancing cannot be
Jesko Hentschel obtained. This vulnerability
stens in part from low substiution elastcities for irnported factors of
production. Policies that lead to a dversification of expos-and higher pice
responsiveness for both imports and exports would reduce the vulnerability cf Ecuadors economy to exterrnal shocks
The World Bank
Iann America and the Caribbean, Country Department
m--Country Operations 1 Diviion
August 1994
Public Disclosure Authorized
Public Disclosure Authorized
Public Disclosure Authorized
Summary findings
When the outbreak of the debt crisis in 1982 halted Hentschel uses the econometrically specified model to private international capital flows to most developirg examine the connection berwecn imported factors of countries, it was not easy for Ecuador to cope with the production and output capacity. He analyzes trade changed international circumstances. Investments were balance responses to a terms-of-trade shock. a largely in imnported machinery as domestic capital goods devaluation, and an increase in world demand. production was in its infancy. Exports were concentrated Low trade elasticities on the import side make the in petroleum and several agricultural products and could economy vulnerable to external shocks. The low not be counted on to incrcase foreign exchange in the elasticities necessitate large relative price shifts (through short run. The trade balance was improved in the first devaluations) to improve the trade balance if growrh-half of the 1980s by reducing imports. reducing policies are to be avoided in times of scarce
Hentschel examines the behavior of the Ecuadoran foreign exchange.
economy in a period of scarce foreign exchange. A deterioration in rerms of trade has a pronounced He uses a small, economerrically specified -trade and negative impact on the trade balance- To rhe exrenr rhat growth" model of the Ecuadoran economy to illustrate trade elasticities remain low in the 1990s, events such as the importance of trade elasticities. He estimates rrade a commodity price decline, a renewed credit squeeze, or elasticities for Ecuador and integrates them into a small increased prorectionism against Ecuadoran exports
-simulation model of Ecuador's supply side- He uses a like the recent European Union quotas on banana nested constant-elasticity-of-substitution production imports - can translate into renewed domestic supply
function to derive factor input demands for two types of disturbances.
imported goods important in Ecuador: imported Policies that lead to a diversification of exports and intermediate goods and importcd machinery. higher price responsiveness for both imports and exports
Elasticity estimates of imported factors of production would reduce the vulnerability of Ecuador's economy to are very low. They characterize both types of imports as external shocks.
complements to domestic factors.
This paper - a product of the Country Operations 1 Division, Latin America and the Caribbean, Country Department III - is part of a larger effort in the region to understand the linkages between trade and growth in Latin Amcrican countries.
Copies of the paper are available free from tnc World Bank, 1818 H Streer NW, Washington, DC 20433. Please contact Dorothy Jenkins, room IS-057, extension 37890 (16 pages). August 1994.
hEkbe Research Working Policy Pr Serics dissemines the f dings of wok in progrnss to enurage te exchrnge rs of about deuelopmezt rssus An objective of thcesenes is to get the findings osrtqucHy, ercn if the presentations ar ca ksstn fully polisbcdL Tbc
papers carry te rncs of thc authors and sboul be uscd and circ<ecw"rdingly. The rfdngs, interprCataions. and cunclusions ar rbc
ar tbors' oum and should not be artribiaedl to the Vrorld Bangk its Executivc Board ofDirctrors, or any of its membecr couJntrics.
A Partial Equilibrium View' Jesko Hentschel
1. Introduction
When the outbreak of the debt crisis halted private international capital flows to most developing countries in 1982, Ecuador was not in an easy position to cope with the changed international circumstances. Foreign savings had been relied on heavily to finance capital formation during the late 1970s. Investments consisted largely of impored machinery as domestic capital goods production was in its infancy. Further, Ecuador's exports were concentrated in petroleum and several agricultural products and exports could not be relied on to increase foreign exchange availability. Instead, trade balance improvements in the first half of the l980s were achieved by a reduction in imports.
This paper examines the behavior of the Ecuadoran economy in a period of scarce foreign exchange. Parameters of significant importance in this context are the trade elasticities which determine to what extent relative price changes can be relied on to achieve trade balance improvements.
1 This paper is partly based on my PhD dissertation at dte University of Konstanz (Henrschel
economy is used to illustrate the importance of these trade elasticities. In the approach presented here, we derive factor input demands for two types of imported
goods - capital and intermediate -- from a nested Constant-Elasticity-of-Substitution
production function. Export elasticities are determined from a simultaneous estimation
of supply and demand. We simulate the reaction of the trade balance to a devaluation, a terms-or-trade shock and a sudden upward shift in the demand for exports. A
'growth - trade balance' curve is computed from the model which allows us to
compare trade balance reactions for various growth scenarios. "
The model is of a partial equilibrium nature with focus on the links between
disaggregate imports and growth.' The model only incorporates the supply side and does neither include demand or the financial sector. As we assume a
one-good-economy, investment is purely a function of relative prices. Other important variables
determining investment behavior - such as expected levels of inflation, overall
macroeconomic stability or portfolio decisions of the economic agents - are omitted.
The above restrictions limit the applicability of the results. The model is useful, however, in highlighting the importance of stuctral rigidities for the design of
macroeconomic adjustment policies.
The next section provides a short background on the economic situation of Ecuador at the beginning of the 1980s. Section 3 introduces the model and presents estimation results for the most important parameters. Based on the econometric specification, we simulate the reaction of the trade balance in various scenarios. The last section offers some concluding remarks.
2. Background
The oil boom of the 1970s turned Ecuador from a poor, primary-export dependent economy into a middle-income country with a stock of wealth in the form of oil reserves. But while the growth of the economy was oil-led at the beginning of the decade, it became largely debt-led in the second half. Growth of petroleum exports came to a stand-still towards the end of the 1970s while imports mushroomed. An industrialization strategy behind highly pmtective barriers had been started during the 1970s, leading to a capital-intensive industry which produced inefficiently when compared internationally. The protection structure and an overvalued exchange rate created incentives to use imported capital goods intensively for investments and it biased production in the manufacturing sector (16% of GDP in 1982) towards consumption and intermediate goods. Domestic capital goods production was in its
2 The motivation of the model is hence similar to import compression models, eg. dte one by
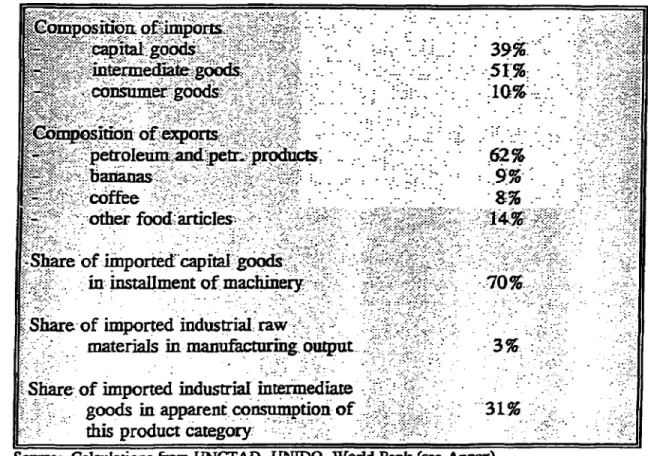
infancy and concentrated itn low-technology intensive processes. Consequently, Ecuador imported more than two-thirds of installed machinery in the years before the debt crisis started (see Table 1). Imported industrial intermediate goods also constituted a major supply of thic product category. Imports of consumer goods made
up hardly 10% of the total imfiport bill, leaving very little leeway to restructure import
expenditures in favor of productive factors in times of foreign exchange scarcity. Exports were highly concentrated in oil, bananas and coffee. The undiversified export base can be partly explained by the high discrimination against non-traditional exports which resulted from the high protection of domestic consumer goods industries and a strong appreciation of the Sucre accompanying the capital inflows and the oil-boom in the 1970s. Exports were relied on to finance necessary imports of capital and technology-intensive intermediate inputs. Domestic production was dominated by
the nontradables sector - it accounted for 58% of domestic value added in 1981.3
Table 1: Trade structure and indicators of import intensity of domesfic production before the debt crsis, 1979-1981
TCpsda o ---- :impor--*;-f
capitai
-go
39%-~~'''gods - 10
'~~~~~~~~~~~~~~~~1%
'
. -petroleumrand petr produs ' 62%'
.-- coffee -%
- otherfood>--ao--rlo-d,
S of imporcedcapital
g-in g-installmentof machg-inery=m- 70%
Share-of imported industrial raw' '
:= - - materials in manufacturing output - 3%.
Share of imported industrial intermediate
goods in apparent consumption of ---- 3- %
this product category.,
Source: Calculations from UNCTAD, UNIDO. Woxld Bank (see Annex).
The high current account deficits of 1981 and 1982 (15% and 18% of GDP, respectively) were not sustainable with the sharply reduced flow of private capital. A major improvement of the trade and current account was achieved but this forced adjustment fell almost entirely on imports. While export proceeds stagnated in 1983 and 1984 - although export-'taxes were lowered substantially -, import expenditures decreased by almost 40% compared to their 1981 level. This reduction of imports was partly due to a sharp increase in protective measures such as tariff increases and applications of quantitative restrictions. Further, large devaluations of the Sucre changed the relative price between imported and domestically prodhced goods. To what degree these changing relative prices were effective in affecting trade flows is explored below.
3. Structure of the model and estimation results
We analyze the linkages between domestic growth and merchandise trade in Ecuador in a partial equilibrium framework. Concentration lies on the suppiy-side of the economy, while aggregate demand and its determinants are not explored. The model captures only the real goods sector and leaves financial transactions and the monetary sector aside. Therefore, the output of the economy has to be viewed as 'potential' or 'capacity' production instead of being 'actual' output.
The structure of the model is presented in Box 1. A one-sector economy is assumed. Output is a function of four factors of production: imported inputs, labor, a 'domestic' capital stock and an 'imported' capital stock. A three-level nested production function is introduced. As depicted in equation 1, output of the economy is a function of imported inputs (Mw) and domestic value added (Y). The latter is generated by labor L and the aggregate capital stock J (equation 2)!4 Following Marquez (1984 and 1985) and Michalopoulos (1975), a distinction is made between
a domestically produced capital stock (Kd) and an imported one (Kf) which combine
to form the aggregate J (equation 3). Both parts of the production function system which incorporate an imported input are described by constant-elasticity of substitution functions (equations 1 and 3) while the domestic value added function (equation 2) is
assumed to be of a Cobb-Douglas type.5
4 The aggregate capital stock correspornds to Sato's (1967,1975) efficiency capiml stock.
5 Data on average man-hour employment in Ecuador could no; be obtined. Therefore the
elasticity of substitution between the aggregate capital stock and labor had to be restricted to one. Studies examining the functional relationship between capital and labor in developing countries generally find substantial substitutionpossibilities in most industries, often close to unity. Compare Laumas and Williams (1981), Morawee (1976) and Sines (1979).
Box 1: Model functions and variable definitions Aggregate Production
(1) Q = QCES Y, M m , t}
(2) y' = CD 1, L',Iti1
|(3) J JcEs. {Kd,. Kr,
t-Derived factor demands (cost minimization)
(4) Mkt,- MInt MY. PY, PtM&E(1+tMnX t}
(5) Kd. -= 14, {Y, PmMcaE(l +tidc, PQ, w, t}
(6) Kf -- K fY, PmQ4,E(l+t), P-v w
t-Cost: finctions (mark-up prcing)
(7) PQ ~PQ {PE(1.+t 1ilin)- FY
(8); Py= Py-WJ{P,t};
O0ther-imjoris
(9> -M.' M, - MF -{Y,- PMOE(I+t PQ
Exot upy and demnd. :0...
-: (102) Xs {Q'P. Px-E t (Ii) X- X I .P- E -efinitions .(13) P1 PJ{F0,MCaDE(l+MCP)t
Functions and depreciation parameter . price id of .MTat
CES Const Elasticity of Substitution. -PMW1 price inodexfM. ($)
-CD Cobb-Douglas price:mdexof Y (Sue-;
e--
depreciation rate (12.5%)- PQ price index of Qad oKbfSuc)--:P,- -:xport price: index ($)
Variables -EC Pw p rice index
* E nom. exchange rate, Suuc. per $ -Q -domesticoutput (coust. Sue)
EB exchange rate, base year value' t time index (tech progress)
j aggr. capital stock (const. Suc.) TB trade balance: ($)- M.
-Kd dom. capial stock (const. Suc.) , implicit import x on-
Kf imp. capital stock (const Suc.) tca implicit import tax on
L labor tMoth- implicit. import tax on
mbi-Mcp imp. capital goods (const. Suc.) -w wage rate index (Suc.)
mint imp. intermediates (const. Suc.) Xs- export supply (const Suc).
Mo other imports (const. Suc.) XD -export demand (const Suc.,
MV total import value ($) XV export value ($)
PJ price of efficiency capital stock Y dom. GDP (constL Suc..)
SuCe.)-Under the assumption that firms minimize costs of production subject to a given output constraint, derived demand curves for imported intermediate goods and the two capital stocks can be determined from the production function system (equations 4 to 6). We derive the cost functions corresponding to the production functions which allows us to endogenize two relevant domestic prices, namely the ones of gross output (PQ) and value added (Py) (equations 7 and 8). The effect of price changes of imported inputs on the domestic price level of value added and gross output, which reduce the real impact of nominal exchange rate devaluations, can hence be assessed. It should be pointed out that the price rise stems solely'from the supply-push effect and that it does not mirror shifts in the composition and level of aggregate demand or monetary assets.
We assume Ecuador to be small on the import side so that import prices are determined exogenously. Imports of intermediate goods are directly determined from the derived factor demand function while imports of capitml goods are deduced from the change in the stock of imported machinery, taking into account depreciation on past investment (14) 6 The residual import category ('other imports') consists mainly of consumer goods and constitutes a minor share in total imports. Demand for these goods is modelled as a function of domestic income and the relative price between this type of imports and the home-made goods (9).
Product differentiation is introduced on the export side. An export supply function is incorporated while staying witiln the framework of a one-sector economy (Melo and Robinson 1989). In contrast to the import side, the export price is not assumied to be determined exogenously which might seem to be an unusual assumption for a small country. However, for coffee and bananas (which constitute Ecuador's main exports besides oil), consumers tend to differentiate products by origin. As we assume a one-good economy, export demand is not product specific. Instead it is depicted as a function of the relative price between Ecuadoran products and the OECD price deflator on the one hand, and OECD real income level on the other. The export market is depicted by equations 10 to 12.
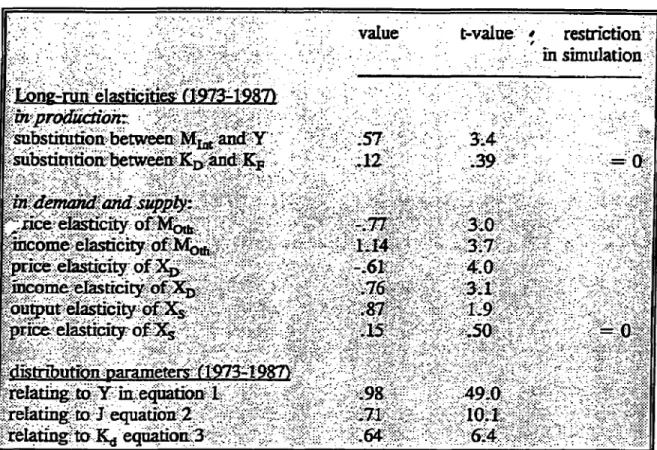
Distribution parameter and long-run elasticity estimates from non-linear simultaneous estimations are summarized in Table 2.7 Focus rests with the estimates
6 Capital stocks are calculated by inventory method assuming a depreciation rate of 12.5 %. A relatively wide dispersion of rates fbr developing counties are put to use in the literature. E.g., while Bergsten et al. (1985) assume an average zate of 20%, Keil and Marchese (1991) employ a 1255% rae as used inthis study- Field (1987, p.1285) and Ikemoto (1986, p.387) apply a rate of 10%. while the IMF (1989, p.66) posits a rate of 5%.
7 Estimations are carried out in several blocks: Block A: the demand for intemediate inputs (Mh) and the output price (PQ); Block B: demand for the two capital stocks and the GDP price deflator (Py); Block C: export supply and demand (XD and Py). The demand for other
of the elasticities of substitution for imported factors of production. Imported intermediate goods and domestic value added are found to be complements; the estimate of the elasticity of substitution between these two factors is 0.57. Price
Table 2: Selected elasticity and parameter estimates
value; t-vilue: restriction'
mn simulation::
lo-ng-mNlelasticities.f(1973
987)
chngesdoaffcti fco-nuoeatosnste:umt ssgilanydfeetfo
bsubsttion M an Y between 57tw 3ca4pi
substivitiornd,etweeakerad 12 39 0
W4.- '9 -4-
--8nce elastuicit o Mothi
r
io
0.66coM tru elatiit aruze18)ad ofauly, (197 [4pu 37ogru s eo h
Yi
elasticity of Xubdmto 61te 40oedoladdedmstccptlsok(o hcomeelasie cor of 0.73.
9utpWe
lasscityt of X. 87 I 9npe'elasticio sco
~~reIating-1J;equato 2...1..10.1
changes do affect f-actor-input relations. As the estimate is sigmificantly different from
0 and 1, the general CES formulation can neither be approximated by a fixed-proportion nor a Cobb-Douglas fumction.! Subsdtittability between the two capital
stocks is significantly weaker. 'MTe estimate has the expected positive sign but is
8 Othe studies estimating the elasticity of substitudonbetween imported intermediate goods and domestic factors of productionL also describe these factor pairs as complements. Conway (1986, exploring the same relationship as depicted above for Turkey, attains an estimat of
0.66; Marquez (1984) and Marquaz and Pauly (1987) compute a long-run estimate of the elasticity of substitution between iEmported oil and the domestic capital stock (for the developing countries as a group) of 0.73.
9 We assume replacement costs of new investments to represent the relevant user cost of the capital SEocks.
small and insignificant. According to these results, changes in user costs do not influence the composition of the aggregate capital stock. As on offspring, the
corresponding CES function can be approximated by 2 fixed-proportion function
between the imported and domestically produced capital stock. The crucial role
imported capital goods play in the Ecuadoran economy is further strengthened by the
magnitude of the distribution parameter. The long-run share of the domestic capital stock (Kd) in the aggregate capital stock (J) is estimated at 64%, hence the imported capital stock (Kr) contributes 36% to J. Also, the aggregate capital stock J is the
major contributor in generating domestic value added.
Turning to the other estimates, the demand for other imports (Moth), which
maialy consist of consumer goods, is income-elastic and price-inelastic. Demand for
Ecuador's exports (XD) is both price- and income-inelastic which could be expected
since they consist mainly of agricultumal and oil products. In this crude,
non-disaggregate form of depicting the export market, no significant response of export supply (Xs) to price incentives could be deduced. The export quantity is driven solely by supply capacity. This result has to be interpreted with care. First, a significant
share of Ecuadoran exports was dominated by commodity agreements during part of
tite estimation period (OPEC, International Coffee Agreement) which limited the response of export supply to price changes. Second, individual export categories
might show a price responsiveness which does not show on an aggregate level. Third,
domestic policies and institutional factors influencing price and adjustment times are
not included in the above estimation. lThe crude form of depicting the export market should therefore be kept in mind when we look at the simulations.
Considering the above results, the low substitution elasticities for imported means of production imply a limited flexibility of the Ecuadorau economy. The
elasticities result from resource endowments and the stage of development but also
from the trade and industrial policy orientation. The elasticities should consequently not be viewed as constants. Policies that are conducive to the efficient use and development of domestic resources (which lead to, e.g., the domestic accumulation
of skills, technological developments and factor mobility) positively influence the
price responsiveness of export supply and import demand.
4. Simulation
The model is used to examine how the trade balance (measured in current dollars) reacts to variations in the growth path of several exogenous variables, namely domestic and world GDP, import prices and the exchange rate.l' The calculations
10 The model contains eight endogenous variables: the prices of domesic GDP (Pr). domestic output (PQ) and exports (Px), imports of intermediate (M,v) and other goods (Mo&,). exports (contnued..)
importance of imports (combined with the export specification) translates itself into
trade balance reactions. Although the Ecuadoran supply-side specification contains
a fixed-proportion production function linking the domestically produiced and imported
capital stocks, substitution-possibilities for both imported factors of production are
present in the model: labor and intermediate inputs can be employed to replace the
capital stock from imports (K7) and both types of capital stocks as well as labor
substitute for intermediate inputs.
The computations are conducted in the following way: [n the base scenario, import prices, tariffs, the domestic wage, and the exchange rate are kept constant. OECD income is raised by 2% over the following periods and so is the world price
deflator. Domestic income is assumed to grow by 3 %. Average five-period values
of the three import quantities (Mc>p, M1nt, Moth), export volume (XQ), and the three
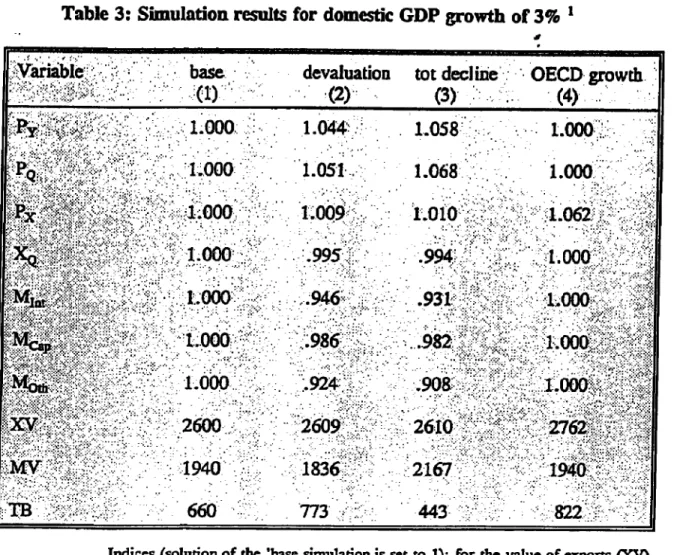
endogenous prices (PQ, Py, Px) are then computed, excluding the fist period (in which changes are introduced in the other scenarios). In Table 3, the first column contains indices of these variables (set at 1.0 in the base scenario) as well as the resulting values of exports, impn't and the trade balance (in current dollars).
The first variation studies the effects of a nominal devaluation of 15 % with the exchange rate kept at this level thereafter; the other exogenous variables remain as in
the base scenaAio. 11 The rise in the exchange rate causes an increase in the local
currency price of imported capital and intermediate goods. The higher relative price
between imports and their domestic substitutes reduces demand for all three import categories, but to a different degree. The smallest reduction occurs (as expected) for
imported capital goods since substitution possibilities are limited.' Imports of
machinery and equipment are estimated to fall short of their base case volume by
1.4% only. A somewhat higher degree of substitutability is associated with imports
of intermediate inputs, whose import quantity is calculated to decline by 5.4% in response to the devaluation. The category of imports affected most is 'other goods',
10(. .contimned)
(X) and the two capital stocks (Kd and K,). Subjecting the model to ex post simulaion (1973-1987) produces satisfactory results. The endogenous variables all show high correlations with the historical time series and the Theil inequality coefficient is below 5% in all cases except for the generated time series of the export price.
11 The nominal wage rate is also kept as ia the base case since no fecd back mechanism between a change in the price of gross output and the nominl wage is included.
12 Adjustnent lags are included in the estimation which contributes to the low response of imports to changing prices. The mean lag for the adjustment of quantities ranges from half a year (intemxediate imports), 2 years (exports). 4 years (imported capital stock) to 10 years (domestic capital stock). The adjustment time of prices (Px. Py. PQ) is estimated to be significantly shorter and almost instntaneous.
being largely consumer articles. Imports of this category decrease by 7.6% in response to the 15 % nominal devaluatica. The effect is not higher since the import price increase (in domestic currency) pushes up the GDP-price deflator (Py) by an average of 4.4% and the gross output price by 5.1%, so that the 15% nominal
devaluation is translated into a 10% 'real' devaluation.'3
Table 3: Simulation results for domestic GDP growth of 3%
L.ime~~~~~~~~~~~~~~~~~~~~~~~~~~~~~~~~~~.
;arable-: hbase: devaluation tot decline - OECD growth.
1.000Q 1.044. 1.058-:100
PQ: 1.000 1.051. ;1i.068-. 1.000
IxY ~ LO00
1.0
9
062a
'tQ 461 000: 9
994
1000 .946 - - ~~931 10 XW.LOO....4..0 1000 XV; 260 60 2610 276 MV jsg - 0 t-i. 1940 - -- 1836- 22167 1940 TB- 6Z607 ;; - 443 -82I Indices (solution of the 'base simulation is set to 1); for the value of exports (XV),
the value of imports (MV), and the trade balance (TB) current US dollars. Entries represent five-period average values (the year in which the variation is introduced is not taken into account).
Export supply is affected only marginally due to its sole dependence on gross output of the economy. Since GDP is assumed to grow as in the base case and imported intermediate goods decline, gross output of the economy falls margially
13 The term 'real' devaluation only refers to the net impact of the nominal devaluation and dte domestic price rise (PQ). It does not take inflation abroad into account.
decreases by slightly more than 5% which translates (with basically constant export quantity and export unit value) into a rather small improvement of the trade balance. The second variationt inspects the outcome of a once and for all increase in import prices by 20% The results are reported in the third column of Table 2. Quantities of all import categories are suppressed below the level experienced when examining the effect of the devaluation, since the import price rise causes a more pronounced change in the relative prices between imported and domestic goods. Most striking is again the small variation of capital goods imports, which are calculated to
fail short of the base-run value by only 1.8%. The supply-inflationary effect drives
up the price of value added by 5.8% and of gross output by 6.8%. Export quantity and price show little reaction again. The import price rise increases the import bill substantially, since the major import categories (intermediate and capital goods) respond only little. The trade balance deteriorates strongly by 30% as compared to the base scenario.
Finally, the third variation (column 4 in Table 3) concerns the impact of higher OECD growth rates on the Ecuadoran trade balance. The import side and domestic
prices are not altered in relation to the base case. As export supply is independent of
prices, export quantities do not respond to the higher world demand and lead to an increase in line with the base projection due to the capacity effect. The entire impact
of higher world growth is transmitted to a rise of the export unit value by 6.2%. The
Graph 1: Simulating trade balance reactions aDp growth 0 9 I B 7 1~~~~~~~ U- 0--1000 -500 0500 1000 1500
- base casb t6S dlluatr n
Using these scenarios but varying the growth of domestic income produces a relationship between the trade balance and the domestic growth rate as depicted in Graph 1. By far the largest alteration of the growth-trade balace link occurs in the case of a terms of trade deterioration, specified as a 20% rise in import prices. Correspondingly, the positive effect of a 15% devaluation on the trade balance is relatively small. Although the empirical examination of the export side could not establish a link between the export quantity and world demand, the upward pressure on the export unit value index is suficient to raise export revenues more than if thc
devaluation occurs.
Due to the limited price flexibility on both the export and import side of our model, traded quantities react only slowly. A terms of trade shock therefore causes
an immediate and relatively high deterioration of the trade balance while a devaluation
of a similar magnitude stimulates only a comparatively moderate improvement. These
reactions are independent of the growth scenario. Hence, if a certain improvement
of the trade balance is to take place without deflating the economy, large relative price
changes via devaluations are necessary. Domestic supply-push inflation eroding these
nominal devaluations, however, have to be taken into account when pursuing this policy.
5.Conclusion
This paper studied the linkages between trade and growth in the Ecuadoran
economy, examining especially the connection between imported factors of production
and output capacity. Import demands for capital and intermediate goods were derived
from a macroeconomic production function assuming that economic agents minimize
costs for a given output. Estimations showed that the elasticity of substitution between
Ecuadoran capital goods and imported machinery was limited for the 1972-1987
period - a result which is intuitive as the machinery producing sectcfr in Ecuador was
(and still is) in its infancy. Relative price changes influenced the demand for
intermediate imports to a higher degree, although we determined domestic value added
and intermediate inputs to have been complements in production both in the short and
long run. In part, these elasticities reflect the policy environment which was heavily biased against labor and in favor of imported capital goods during the 1970s.
In combination with an undiversified export base, the low trade elasticities on
the import side characterized the Ecuadoran economy as vulnerable to external shocks during the 1980s. To examine this vulnerability, we incorporated the import
elasticities (Gointly with a simultaneous specification of export demand and supply) in
a simple supply-side model. Simulations showed that a 15% devaiuation improved
the trade balance but that this improvement was modest due to the low trade elasticities and due to supply-push inflation which eroded the initial nominal devaluation. Similarly, a terms-of-trade deterioration had a pronounced negative impact on the trade balance. To the extent that trade elasticities remain to be low in the 1990s, events such as a commodity price decline, a renewed credit squeeze or increased protectionism against Ecuadoran exports - like the recent EC quotas on
banana imports - can translate themselves into renewed domestic supply disturbances.
Policies that lead to a diversification of exports and a higher price responsiveness on
the import side would reduce the vulnerability of the Ecuadoran economy to external
References
Bergsten, C.F., W.R. Cline and J. Williamson (1985)
Bank Lending to Developing Countries: The Policy Alternatives, Policy Analyses in International Economics 1C, Institute for International Economics. Conway, P. (1986)
Decomposing the Determinants of Trade Deficits: Turkey in the 1970s, Journal of Development Economics 21, pp.235-258.
Field, A.J. (1987)
An Estimate of the Textile and Clothing Sector Production Function for Selected Countries in the Early 1970s, World Development 15, pp.1285-1290. Hentschel, J. (1992)
Imports and Growth in Highly Indebted Countries, Studies in International Economics and Institutions, New York, Springer-Verlag.
IMF (1989)
World Economic Outlook (April), Washington. Ikemoto, Y. (1986)
Tcchnical Progress and Level of Technology in Asian Countries, 1970-1980: A Translog Index Approach, The Developing Economies 2t, pp.368-390. Janvry, A. de, E. Sadoulet and A. Fargaix (1991)
Adjustment and Equity in Ecuador, OECD, Paris. Kell, 0. and S. Marchese (1991)
Exports of Textiles and Metals: The Question of Sustainability and Reasoned
Growth, UNCTAD Review 3, pp. 15-3 0.
Khan, M.S. and M.D. Knight (1988)
Import Compression and Export Performance in Developing Countries, Review of Economics and Statistics 70, pp.315-321.
Laumas, P.S. and M. Williams (1981)
The Elasticity of Substitution in India's Manufacturing Sector, Journal of Development Economics 8, pp.325-337.
Marquez, J. (1984)
Oil Price Effects and OPEC's Pricing Policy, Lexington: LexingtonBooks. Marquez, J.R. (1985)
Foreign Exchange Constraints and Growth Possibilities in the LDCs, Journal of Development Economics 19, pp.39-57.
Marquez, J.R. and P.Pauly (1987)
International Policy Coordination and Growth Prospects of Developing Countries, Journal of Development Economics 25, pp.89-104.
Melo, J. de and S. Robinson (1989)
Product Differentiation and the Treatment of Foreign Trad'e in Computable General Equilibrium Models of Small Economies, Journal of International Economics 27, pp.47-67.
Micholopoulos, C. (1975)
Production and Substitution in Two-Gap Models, Journal of Development
Studies 11, pp.3 4 3-3 5 6.
Morawetz, D. (1976)
Elasticities of Substitution in Industry: What Do We Learn from Econometric Estimates?, World Development 4, pp. 11-15.
Sato, K. (1967)
A Two-Level Constant-Elasticity-f-Substitution Production Function, Review of Economic Studies 34, pp.201-218.
Sato, K. (1975)
Production Functions and Aggregation, Amsterdam: North-Holland. Sines, R.H. (1979)
Sectoral Elasticities of Substitution between Labour and Capital in Venezuelan Manufacturing: A Cross-Section Micro Analysis , World Development 7, pp.79-82.
United Nations (1971)
Classification by Broad Economic Categories, Statistical Papers Series M No. 53, Statistical Office, New York.
Annex: Data sources
The domestic capital stock (Kd) is computed by inventory method (depreciation rate 12.5%) from real gross investment figures (net of imported capital goods) from the World Tables of the World Bank. The imported capital stock (Kr) is calculated by the same method from imports of capital goods (Map). All trade data, prices and classifications stem from the United Nations Comtrade database and the UNCTAD database on price deflators. The definition of capital and intermediate goods follows
United Nations (1971). Other price deflators are taken from UNIDO (gross output deflator), World Bank (GDP deflator) and OECD (OECD deflator).
The structure of nominal charge rates for the three different import categories
can be computed for 1987 from the Tariff Information System of UNCTAD. Each
cbarge rate is weighted with the import composition of all developing countries in
order to mitigate the effect that high charges reduce imports. The structure of the
charge rates is assumed constant - the relationship between t1 tc4 and ot h - is
constant over the period of estimation (1973 to 1987). This does not,imply, however, that the protectionist effect on each import category itself remained constant. Rather, its is assumed that tariff and non-tariff barriers were raised and lowered on all import
categories alike, so that the relation between the protectionistic effects on the different
import categories remained stable. Implicit average import taxes are then estimated using data on tax revenues form imports which are supplied by the IMF. The implicit
tax is defined as the ratio of the government revenue from imports and the nominal
import bill. Application of the structure of nominal charges to import and revenue data enables the computation of implicit average tax rates for each import category separately.
Contact
Title Author Date for paper
WPS1331 The Myth of Monopoly: A New View Annette N. Brown August 1994 M. Berg of Industrial Structure in Russia Barry W. Ickes 36969
Randi Ryterman
WPS1332 Poverty and Household Size Peter Lanjouw August 1994 P. Cook
Martin Ravallion 33902
WPS1333 A Test of the International Norman V. Loayza August1994 R. Martin
Convergence Hypothesis Using 39026
Panel Data
WPS1334 Taxation. Public Services, and the Juan Braun August 1994 R. Martin Informal Sector in a Model of Norman V. Loayza 39026 Endogenous Growth
WPS1335 Labor Regulations and the Informal Norman V. Loayza August 1994 R. Martin
Economy 39026
WPS1336 Modemizing Payment Systems in Robert Lisffield August 1994 F. Morites-Negret
Emerging Economies Fernando Montes-Negret 37832
WPS1337 The Countrywide Effects of Aid Howard White August 1994 E. Khine
Joke Luttik 37471
WPS1338 Commodity Exports and the Adding- Maurice Schiff August 1994 A. Kim
Up Problem in Developing Countries 33715
Trade, Investment, and Lending Policy
WPS1339 China's Emergence: PRospects, Andres Boltho August 1994 J. Queen
Opportunities. and Challenges Uri Dadush 33740
Dong He Shigeru Otsubo
WPS1340 Opportunity Cost and Prudentiality Herbert L Baer August 1994 P. Sintirn-Aboagye An Analysis of Futures Clearinghouse Virginia G. France 3B526
Behavior James T. Moser
WPS1341 Explaining Pakistan's High Growth Sadiq Ahmed August 1994 A. BhalIa
Performance Over the Past Two 84440
Decades: Can It Be Sustained?
WPS1342 Winners and Losers in Transition: Peter F. Orazem August 1994 Returns to Education, Experience, Milan Vodopivec
and Gender in Slovenia
WPS1343 Strategic Interdependence in the Wafik Grais August 1994 K. Zheng East-West Gas Trade: A Hierarchical Kangbin Zheng 36974 Stackelberg Game Approach
Contact
TiUe Author Date for paper
WPS1344 Which Foreign Investors Worry About Eric Bond August 1994 A. Estache Foreign Exchange Risk In South Antonio Estache 81442 Asia and Why?
WPS1345 The Decentralization of Public Jacques Cremer August 1994 A. Estache Services: Lessons from the Theory Antonio Estache 81442
of the Firm Paul Seabright
WPS1346 Linking Competition and Trade Bernard M. Hoekrnan August 1994 F. Hatab Policies in Central and Eastem Petros C. Mavroidis 35835 European Countries
WPS1347 Antitrust-Based Remecies and Bemard M. Hoekmnan August 1994 F. Hatab Dumping in Intemational Trade Petros C. Mavroidis 35835
WPS1348 Quality Change and Other Influences Robert E. Upsey August 1994 J. Ngaine
on Measures of Export Prices of 37947
Manufactured Goods
WPS1349 The New Regionalism and the Threat Andrew Hughes Hallett August 1994 A. Kim
of Protectionism Cados A. Primo Braga 33715
WPS1350 Economic Parameters of Joachim von Amsberg August 1994 E. Schaper
Deforestation 33457
WPS1351 NAFTXs Implications for East Asian Carlos A. Primo Braga August 1994 A. Kim
Exports Raed Safadi 33715
Alexander Yeats
WPS1352 Trade and Growth in Ecuador Jesko Hentschel August 1994 D. Jenkins