5.2 Capacity
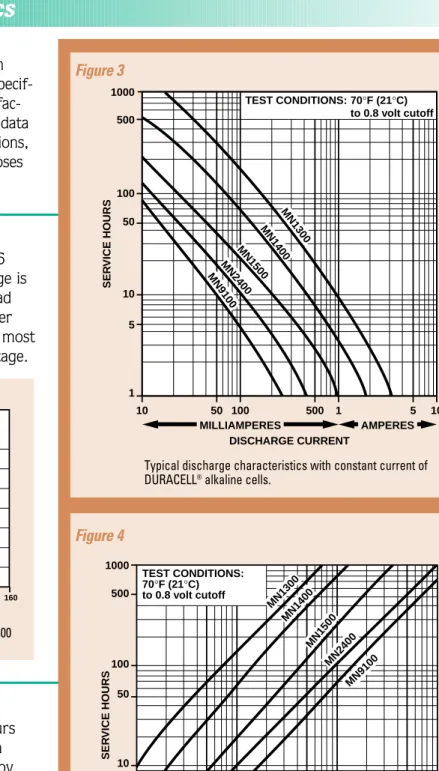
Capacity is usually expressed in ampere-hours or milliampere-hours. In any given continuous drain application, the average current flowing multiplied by the hours of service equals the rated capacity of the cell. Alkaline cells and batteries are available in button (45 mAh to 110 mAh) and in cylindrical (580 mAh to 15,000 mAh) configurations.
Figure 3illustrates the typical discharge characteristics of the major cell types when discharged at a constant current at 70°F (21°C) to a voltage cutoff of 0.8 volts. Figure 4illustrates typical discharge characteristics when discharged at constant resistance at 70°F (21 ˚C) to a 0.8 volt cutoff.
5.1 Voltage
The performance characteristics described in Sections 5.1 through 5.9 are those characteristics specif-ic to the alkaline-manganese dioxide products manufac-tured and distributed by Duracell. The performance data shown is taken from actual test conditions. Conversions, shown in parentheses, are given for reference purposes only.
Open circuit voltage ranges from 1.5 to 1.6 volts. Nominal voltage is 1.5 volts. Operating voltage is dictated by the state-of-discharge and the actual load imposed by the equipment. The voltage profile under discharge is a sloping curve as seen in Figure 2. In most instances, 0.8 volts is considered to be the end-voltage.
TEST CONDITIONS: MILLIAMPERES DISCHARGE CURRENT SER VICE HOURS AMPERES 70°F (21°C) to 0.8 volt cutoff 1000 500 100 50 10 5 1 10 50 100 500 1 5 10 MN1300 MN1400 MN1500 MN2400 MN9100 TEST CONDITIONS: 70°F (21°C) to 0.8 volt cutoff
DISCHARGE RESISTANCE (OHMS)
SER VICE HOURS 1000 500 100 50 10 5 1 1 5 10 50 100 5001000 MN2400 MN1300 MN1400 MN1500 MN9100 Figure 3 Figure 4 TEST CONDITIONS:70°F (21°C) SERVICE HOURS V O L T A GE (V) 0 0.7 0.8 0.9 1.0 1.1 1.2 1.3 1.4 1.5 1.6 20 40 60 80 100 120 140 160
3.9 OHMS 24 OHMS 62 OHMS
OHMS mA 3.9 24 62 275 50 20 ≈ ≈ ≈
Typical discharge profile of the DURACELL®alkaline MN 1500
(“AA” size) cell. Figure 2
Typical discharge characteristics with constant current of
DURACELL®alkaline cells.
Typical discharge characteristics with constant resistance
5.3 Type of Discharge
A battery may be discharged under different modes depending on the equipment load. The type of discharge mode selected will have a significant impact on the service life delivered by a battery in a specified application.
Three typical modes under which a battery may be discharged are;
1. Constant Resistance (“R”): In this mode, the resistance of the equipment load remains constant throughout the discharge
2. Constant Current (“C”): In this mode, the current drawn by the device remains constant during the discharge
3. Constant Power (“P”): In this mode, the current during the discharge increases as the battery voltage decreases, thus discharging the battery at a constant power level. (Power = Current x Voltage)
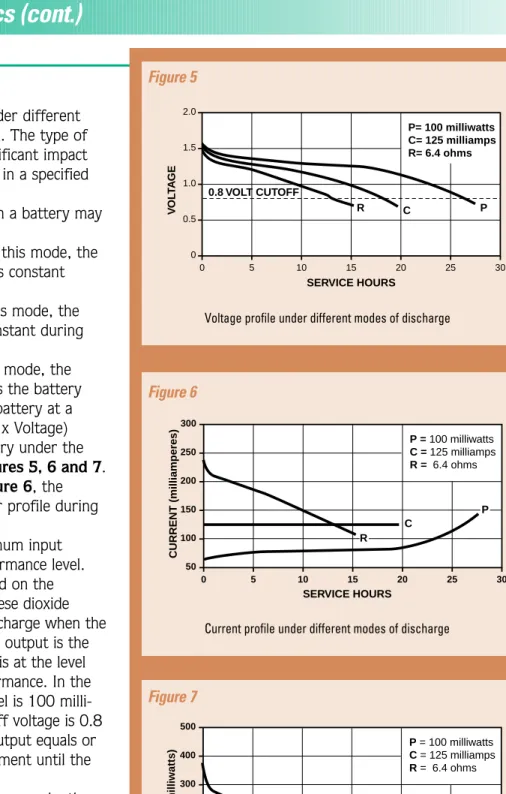
The discharge profiles of a battery under the three different modes are plotted in Figures 5, 6 and 7. Figure 5shows the voltage profile; Figure 6, the current profile; and Figure 7, the power profile during the discharge of the battery.
Electrical devices require a minimum input power to operate at their specified performance level. The data in Figures 5, 6 and 7are based on the discharge of a “AA” size alkaline-manganese dioxide battery (MN1500). At the end of the discharge when the battery reaches its end-of-life, the power output is the same for all of the discharge modes and is at the level required for acceptable equipment performance. In the example shown, the minimum power level is 100 milli-watts and the battery end-of-life or cutoff voltage is 0.8 volts. During the discharge, the power output equals or exceeds the power required by the equipment until the battery reaches its end-of-life.
In the constant resistance discharge mode, the current during the discharge (Figure 6)follows the drop in the battery voltage (Figure 5). The power, I x V or V2/R, drops even more rapidly, following the square of
the battery voltage (Figure 7). Under this mode of discharge, to assure that the required power is available at the end-of-battery-life, the current at 0.8 volts is 125 milliamperes. As a result, the levels of current and power during the discharge are in excess of the minimum
Voltage profile under different modes of discharge SERVICE HOURS 0.8 VOLT CUTOFF R C P= 100 milliwatts C= 125 milliamps R= 6.4 ohms P V O LTA G E 0 0 0.5 1.0 1.5 2.0 5 10 15 20 25 30 SERVICE HOURS C P = 100 milliwatts C = 125 milliamps R = 6.4 ohms CURRENT (milliamperes) 0 50 150 200 250 300 5 10 15 20 25 30 100 P R Figure 5
Current profile under different modes of discharge Figure 6
Power profile under different modes of discharge Figure 7 SERVICE HOURS C P = 100 milliwatts C = 125 milliamps R = 6.4 ohms PO WER (milliwatts) 0 50 200 300 400 500 5 10 15 20 25 30 100 P R
required. The battery discharges at a high current, draining its ampere-hour capacity rapidly and excessively, resulting in a short service life.
In the constant current mode, the current is maintained at a level (125 milliamperes) such that the power output at the end of the discharge is 100 milliwatts, the level required for acceptable equipment performance. Thus, both the current and power throughout the discharge are lower than that for the constant resistance mode. The average current drain on the battery is lower and the discharge time, or service life, to the end-of-battery-life is longer.
In the constant power mode the current is lowest at the beginning of the discharge and increases as the battery voltage drops to maintain a constant power output at the level required by the equipment (100 milliwatts). This discharge mode requires the lowest average current drain and, hence, delivers the longest service time.
Under the constant power mode, the battery can also be discharged below its end voltage. With suitable power regulator circuitry, the current can be increased at these lower battery voltages, maintaining the required power output. The constant power mode provides the most uniform equipment performance throughout the life of the battery and makes for the most efficient use of the battery’s energy.
It should be noted that the advantage of the constant power discharge mode over the other modes of discharge is greatest with batteries that have a slop-ing discharge, such as the alkaline-manganese dioxide cell, as compared with those having a flat discharge characteristic.
5.4 Effect of Temperature
The alkaline-manganese dioxide system is best suited for use over a temperature range of -4°F to 130°F (-20°C to 54°C). At lighter loads, some output can be obtained at temperatures as low as -20°F( 30°C). Actual service depends on cell size and current drain. For most cells, up to 75 percent of the rated capacity at room temperature can be delivered at 32°F(0°C).
The graph in Figure 8 illustrates how cell size and current drain affect performance over a range of temperatures. As current drain increases, temperature impact becomes more dramatic. Low temperature
Effect of temperature and load on the performance of the
DURACELL®alkaline MN1500 (“AA” size) cell.
TEST CONDITIONS:
14°F (-10°C) 70°F (21°C) to 0.8 volt cutoff
DISCHARGE RESISTANCE (OHMS)
SER VICE HOURS 1000 500 100 50 10 5 1 1 5 10 50 100 5001000 113°F (45°C) 32°F (0°C) 70°F (21°C) SERVICE HOURS
TEST CONDITIONS: 2.2 OHMS A1: DURACELL alkaline voltage profile @ 32°F(0°C) A2: DURACELL alkaline voltage profile @ 70°F(21°C) Z1: zinc-carbon voltage profile @ 32°F(0°C) Z2: zinc-carbon voltage profile @ 70°F(21°C) 1 0.7 0.9 1.0 1.2 1.4 2 10 20 30 50 100 0.8 A 2 A1 3 4 5 40 Z2 Z1 1.1 1.5 1.3 LO ADED V O L T A GE (V) Figure 8
Comparison of the effects of temperature on a regular
zinc-carbon “D” size cell versus a DURACELL®alkaline MN1300
(“D” size) cell. Figure 9
Comparison of the effects of temperature on a regular
zinc-carbon “AA” size cell versus a DURACELL®alkaline MN1500
(“AA” size) cell. Figure 9a
TEST CONDITIONS: 3.9 OHMS A1: DURACELL alkaline voltage profile @ 32°F(0°C) A2: DURACELL alkaline voltage profile @ 70°F(21°C) Z1: zinc-carbon voltage profile @ 32°F(0°C) Z2: zinc-carbon voltage profile @ 70°F(21°C) SERVICE HOURS LO ADED V O L T A GE (V) 1 0.7 0.9 1.0 1.2 1.4 2 10 20 30 50 100 0.8 A 1 3 4 5 40 Z2 Z1 1.1 1.5 1.3 A2
MN1300 D 1.5 15.000 10 0.304 0.138 3.440 0.056 59.2 130 5.2 322 MN1400 C 1.5 7.800 20 0.143 0.065 1.640 0.027 65.5 144 5.7 347 MN1500 AA 1.5 2.850 43 0.052 0.024 0.510 0.008 65.8 143 6.7 428 MN2400 AAA 1.5 1.150 75 0.024 0.011 0.230 0.004 57.5 126 6.0 345 MN9100 N 1.5 0.800 100 0.021 0.010 0.210 0.003 45.7 96 4.6 320 7K67 J 6.0 0.580 340 0.075 0.034 0.960 0.016 37.2 82 2.9 174 MN908 Lantern 6.0 11.500 15 1.349 0.612 30.620 0.502 40.9 90 1.8 110 MN918 Lantern 6.0 24.000 9 2.800 1.270 75.880 1.243 41.1 91 1.5 93 MN1604 9V 9.0 0.580 620 0.101 0.046 1.390 0.023 41.4 91 3.0 182
PRODUCT NOMINAL RATED TYPICAL GRAVIMETRIC TYPICAL VOLUMETRIC
NUMBER SIZE VOLTAGE CAPACITY* LOAD WEIGHT VOLUME ENERGY DENSITY** ENERGY DENSITY
cubic watt-hours watt-hours watt hours watt hours
volts ampere-hours ohms pounds kilograms inches liters per pound per kilogram per cubic inch per liter
5.5 Internal Resistance
5.6 Energy Density
performance of alkaline and regular zinc-carbon cells is compared in Figure 9, showing the “D” size cell at 70°F (21°C) and 32°F (0°C). Figure 9ashows “AA” cell performance under the same conditions. The
alka-line cell will maintain a higher voltage for considerably longer than the regular zinc-carbon cell, resulting in a service life at lower temperatures which is up to ten times that of the regular zinc-carbon cell.
Alkaline cells, because of their compact construc-tion and highly conductive electrolyte, have low internal resistance, usually less than 1 ohm. The low internal resistance characteristic is a benefit in applications
involving high current pulses. Unlike regular zinc-carbon cells, alkaline cells do not require rest periods between pulses and maintain their low internal resistance, increasing only at the very end of useful life.
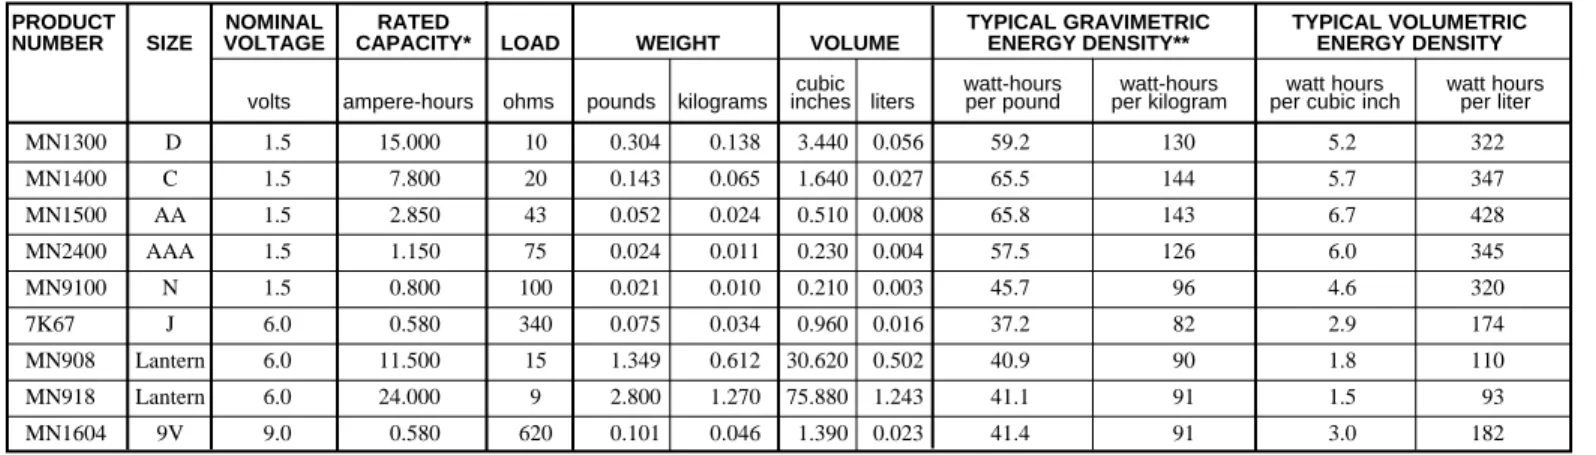
Energy density is a measure of available energy in terms of weight and volume. It is the ratio of a cell’s capacity to either its volume or weight and can be used to evaluate a cell’s performance.
Table 1is a summary of the major alkaline product types comparing both volumetric energy density and gravimetric energy density. Volumetric energy density
is an important factor where battery size is the primary design consideration. Gravimetric energy density becomes important where weight of the battery is critical, such as in portable computers and cellular phones. The values shown in this table are typical for each cell size. Actual energy output will vary, dependent mostly on drain rates applied.
* TO 0.8V per cell at 21°C (70°F).
** Based on 1.2 volt average operating voltage per cell at 21°C (70°F).
Table 1. Comparison of typical energy densities of major DURACELL®alkaline cells/batteries.
To determine the practical energy density of a cell under specific conditions of load and temperature, multiply the ampere-hour capacity that the cell delivers under those conditions by the average discharge volt-age, and divide by cell volume or weight.
Gravimetric Energy Density:
(Drain in Amperes x Service Hours)
x Average Discharge Voltage = Watt-Hours
Weight of cell in Pounds or Kilograms Pound or
Kilogram
Volumetric Energy Density:
(Drain in Amperes x Service Hours)
x Average Discharge Voltage = Watt-Hours
Volume of cell in Cubic Inches or Liters cubic Inch
5.7 Shelf Life
Using the MN1300 data from Table 1the previous equations can be used to determine energy density for this cell.
Gravimetric Energy Density:
59.2 130.4
15.00 Ampere-Hours x 1.2 Volts = Watt-Hours or Watt-Hours
0.304 Pounds (0.138 Kilograms) Pound Kilogram
Volumetric Energy Density:
5.23 320
15.00 Ampere-Hours x 1.2 Volts = Watt-Hours or Watt-Hours
3.44 Cubic Inches (0.563 Liters) Cubic Inch Liter
Alkaline cells have long shelf storage life. After one year of storage at room temperature, cells will pro-vide 93 to 96 percent of initial capacity. When stored for four years at 70°F (21°C), service of about 85 percent is still attainable. Storage at high temperatures and high humidity will accelerate degradation of chemical cells. At low temperature storage, the chemical activity is retarded and capacity is not greatly affected. Recommended storage conditions are 50°F (10°C) to 77°F (25°C) with no more than 65 percent relative humidity.
Figure 11compares various DURACELL®zinc
anode systems and the effect of temperature on capacity retention. At room temperature, the alkaline system loses approximately 5 percent capacity after one year of stor-age. Subsequent capacity loss is approximately 2 percent per year. By comparison, zinc-carbon cells lose nearly 15 percent capacity per year at room temperature. As the temperature elevates, capacity losses increase. At temperatures above 113°F (45°C), the regular zinc-car-bon cells will be completely discharged within one year, whereas the alkaline system will still retain approximately 80 percent of its original capacity.
Effect of temperature on capacity retention for various
DURACELL®zinc anode systems
1 70 20 30 40 50 60 80 90 100 110 120 130 140 TEMPERATURE (F°) TEMPERATURE (C°) APPO XIMA TE CAP A CITY LOSS PER YEAR (%) 3 5 10 SILVER OXIDE ZINC-CARBON ALKALINE-MANGANESE DIOXIDE & MERCURIC OXIDE
30 50 100 TEMPERATURE (°F) ALKALINE-MANGANESE DIOXIDE MERCURIC OXIDE ZINC-CARBON TEMPERATURE (°C) ENERGY DENSITY (Wh/lb.) ENERGY DENSITY (Wh/kg) –20 100 250 200 150 100 50 75 50 25 0 0 20 0 40 80 120 160 40 60 Figure 11
Gravimetric energy density comparison of zinc anode systems.
Figure 12
Volumetric energy density comparison of zinc anode systems. Figure 13 TEMPERATURE (°F) ALKALINE-MANGANESE DIOXIDE MERCURIC OXIDE ZINC-CARBON TEMPERATURE (°C)
ENERGY DENSITY (Wh/in.
3) ENERGY DENSITY (Wh/L) 0 8 100 500 400 300 200 6 4 2 0 20 0 80 120 40 60
5.8 Comparison of Zinc-Carbon and Zinc-Alkaline
5.9 Cost Effectiveness
In Figures 12 and 13, comparisons are made between the DURACELL®alkaline-manganese dioxide
system and several other zinc anode systems, showing the effect of temperature on both gravimetric energy density and volumetric energy density.
Another comparison, showing the effect of discharge load on the cell’s capacity and how this can influence the selection of a battery for an application, is illustrated in Figure 14. The regular zinc-carbon cell performs efficiently under light discharge loads, but its performance falls off sharply with increasing discharge rates. The alkaline system has a higher energy density at light loads and does not drop off as rapidly with increasing discharge loads. For low-power applications, the service ratio of alkaline compared to regular zinc-carbon is in the order of 2:1. At heavier loads, such as those required for toys, motor-driven applications, and pulse discharges, the ratio can widen to 8:1 or greater. At these heavy loads, alkaline batteries are preferred on both a performance and cost basis.
The impact of the discharge rate and duty cycle on the cost of battery operation is shown in Table 2 which compares the service life and cost-per-hour of ser-vice of regular zinc-carbon cylindrical cells with
alkaline-manganese dioxide cells under various loads. The relative cost-per-service-hour column shows the cost savings resulting from the use of alkaline-manganese dioxide batteries versus zinc-carbon batteries in each application.
BATTERY ACTUAL SERVICE HOURS RELATIVE COST PER SERVICE HOUR
TYPE TEST* ZINC-CARBON ALKALINE ZINC-CARBON ALKALINE
D Flashlight: 2.2 ohms 3.7 20.5 1 .56
C Toy: 3.9 ohms 2.2 20.8 1 .33
AA Flashlight: 3.9 ohms 1.1 6.2 1 .41
AA Tape Player: 10 ohms 3.5 17.4 1 .47
Relative Cost Ratios 0.35 1.0
Comparison of the typical discharge characteristics of
regu-lar zinc-carbon “D” and “AA” size cells versus DURACELL®
alkaline “D” (MN1300) and “AA” (MN1500) size cells. Figure 14
TEST CONDITIONS: 70°F (21°C) to 0.8 volt cutoff
ALKALINE "D"
DISCHARGE RESISTANCE (OHMS)
SER VICE HOURS 1000 500 100 50 10 5 1 1 5 10 50 100 5001000 ZINC-CARBON "D" ZINC-CARBON "AA" ALKALINE "AA"
* Test conditions:D - Flashlight - 2.2 ohms, 4 minutes/hour to 0.9 volts. C - Toy - 3.9 ohms, 1 hour/day to 0.8 volts. AA - Flashlight - 3.9 ohms, 4 minutes/hour to 0.9 volts. AA - Tape Player - 10 ohms, 1 hour/day to 0.9 volts. Table 2. Impact of discharge rate and duty cycle on the cost of battery operation.