Data-centric Maintenance and Operational Knowledge and Its
Impact on Classification
Author Name(s): Domenic P. Carlucci
(M)1, Robert Conachey
(M)2, John B. Hagan
(M)3,
1)ABS, USA, [email protected]2)ABS, USA, [email protected] 3)ABS, USA, [email protected]
The monitoring of machinery condition, performance, and maintenance activities continues to be vital to the effective management of marine assets. Identifying key data, developing a data collection protocol, and analyzing the data are key to effective management. Planning for these activities should rely on risk and reliability techniques. Integrating data collection with the vessel’s or asset’s control and monitoring systems can reduce crew burden and simplify an often complex puzzle of qualifying and analyzing condition and performance data into a standardized process for maintenance planning and decision making related to asset operations. The information gathered from these processes can create a knowledge loop that, when implemented in an enterprise asset management (EAM) strategy, can improve current operational execution and influence the next generation of marine asset designs. Classification societies can apply this information for effective surveys and Rules improvement.
KEY WORDS:
Condition, Performance, Data, Maintenance, Classification Society, Machinery, Predictive, Diagnostic, Software
INTRODUCTION
Design, operational, and maintenance decisions can be based on operational data and information, where available, or derived from past risk and reliability studies, performance and staff experience. New opportunities are now available for accessing and leveraging operational data as smarter machinery and control systems are deployed in marine and offshore environments. Collecting, analyzing, and disseminating key operational and maintenance information contributes to the knowledgebase needed for reliability improvements and effective Enterprise Asset Management (EAM). Efficient operations and maintenance are best captured and demonstrated to stakeholders or third parties through the use of software applications. Integrating the outputs from these various data sources and formats often requires manual manipulation of the data prior to properly developing decision points. Available smart technologies can expand the capabilities and application of monitoring and maintenance techniques applied in EAM. The information gathered from these processes can create a knowledge loop that, when implemented in an EAM strategy, can improve current operational execution and influence the next generation of marine asset designs. Classification societies may also apply this information for effective surveys and rules improvement. To achieve this, classification societies, as independent third-party organizations working with both industry and administrations, should align their efforts with client operations because:
Emerging technologies are now available for assessing
• Minimally disruptive programs can be adopted for maintenance, inspection, regulatory, and class survey activities.
• Reducing Non-Productive Time (NPT) associated with classification surveys improves the overall efficiency of marine operations.
DATA RICH MAINTENANCE PLANNING AND
EXECUTION
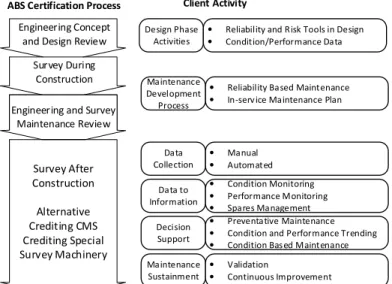
The development of a preventative maintenance plan can be based on several approaches with different levels of sophistication as shown in Figure 1 under Client Activity. For designs applying risk and reliability tools, the methods can be extended to link identified failure causes to a particular maintenance activity thereby mitigating that cause. Following design and construction, a maintenance development process is necessary to structure the lifecycle maintenance plan for the specific asset. Operational data should be used to support this effort, but the selection of data sources and the qualification of this data needs appropriate planning to avoid too much information overwhelming the designers and ultimately the end users. The Data Collection Process can be based on manual collection by the crew or automated with the data provided directly to an electronic database. This data should consist of environmental parameters and systems parameters useful in identifying any failure causes. These parameters can be reviewed and identified during the Design Phase Activities and Maintenance Development Process. This data is analyzed and converted to information (Data to Information) which is then applicable to condition monitoring, performance monitoring and spares management. Further analyses of this information over time results in actionable knowledge which can be used to identify predictive trends related to equipment health, maintenance forecasting and maintenance tasking. Lastly,
are validated and continuous improvement is sought for the maintenance program. All of these increasingly sophisticated maintenance development approaches can be used by the classification society to enhance the survey and consider for credit towards the annual survey and the Continuous Survey – Machinery.
Engineering/Survey Maintenance Review
ABS Certification Process Client Activity
Design Phase Activities
• Reliability and Risk Tools in Design
• Condition/Performance Data
Maintenance Development
Process
• Reliability Based Maintenance
• In-serv ice Maintenance Plan
Data Collection • Manual • Automated Data to Information • Condition Monitoring • Performance Monitoring • Spares Management Decision Support • Preventative Maintenance
• Condition and Performance Trending
• Condition Bas ed Maintenance Maintenance
Sustainment
• Validation
• Continuous Improvement Engineering Concept
and Design Review Survey During
Construction Engineering and Survey
Maintenance Review Survey After Construction Alternative Crediting CMS Crediting Special Survey Machinery
Figure 1: Data Roadmap and Class Alignment
Design Phase Activities
Reliability is initially addressed in the design phase and referred to as inherent reliability. The characteristics of inherent reliability for a machine or system are: used to define, measure and evaluate the design program; based on the customer’s needs; accounted only for failure events subject to design and manufacturing control; and include only design and manufacturing characteristics. [Nicholls, 2005]. Reliability and risk tools are applied in the design phase to provide information to make more informed design and future operational decisions. Operational reliability refers to reliability performance when operated in the expected environment. It includes reliability addressed in the design phase including combined effects of factors beyond the designer’s control such as, manufacturing, installation, operating environment, preventive maintenance policy, repair/fix, etc. Condition and performance data from previous generations of a machine contributes to a manufacturer’s understanding on how operators deploy, operate and maintain this asset thus contributing to product improvements. The parameters necessary to assess future reliability related performance can be identified and the means for collection provided for in the design. Accordingly, the OEM incorporates data capture rather than the operator arranging for a third party to do the same. If new or novel design changes are made as a result of the reliability study, the addition of monitoring and data collection routines will serve a key role in design improvements and validation.
Maintenance Development Process
Creating an effective reliability strategy is necessary to support an efficient maintenance environment. An effective preventative maintenance plan can be developed by leveraging the risk and
reliability techniques applied in the Design Phase. An appropriate maintenance task is selected to identify degradation or to prevent failure occurring sometime in the future for each of the various failure causes associated with the failure modes identified during the design phase. This alignment allows the data collected from condition and performance monitoring to properly assess equipment health. The result of this reliability based maintenance development process is an in-service maintenance program that can effectively maintain the designed reliability of systems and equipment while leveraging data driven maintenance opportunities.
Data Collection
Data is derived from various sources such as monitoring and control systems which can provide temperature, pressure and component status indicator signals. Additional data is provided from maintenance records. Dynamic monitoring systems collect data utilizing permanent, semi-permanent, or portable measuring equipment. For permanently installed systems, the transducers, cabling, and associated signal processing and analyzing equipment are permanently installed with data collected continuously or periodically. Semi-permanent systems also utilize portable measurement equipment, although the sensors are permanently mounted due to safety or access concerns. The portable approach is commonly used for equipment with longer failure intervals and permanently installed systems used for equipment with shorter or more random intervals.
Data to Information
Condition Monitoring
Condition monitoring techniques are highly dependent on data acquisition from either manual or automatic methods. Each of the techniques have different data types and methods of capture. The techniques (ABS CM Guidance Notes, 2015) can be categorized as follows: • Temperature measurements • Dynamic monitoring • Oil analysis • Nondestructive testing • Electrical testing
• Observation and surveillance
Manual collections are normally accomplished in periodic tasks gathered at predetermined intervals to identify onset of failure with sufficient time to take action prior to any functional failure occurring (see Figure 2). Functional failure is a description of how the equipment is unable to perform a specific function to a desired level of performance (ex. pump minimum discharge pressure). The P-F Diagram illustrates the stages leading to failure. The condition degrades to a point at which it can be detected (Point P) and then, if it is not detected and corrected, continues to deteriorate until it reaches the point of functional failure (Point F). This time period between these two points is called the P-F Interval.
Figure 2: P-F Diagram
Automated data collection routines can reduce the reliance on interval selection as well as reducing burden to personnel. Shifting to prognostic analysis software can provide rapid decision support to operators and crew.
Performance Monitoring
The same information that must be collected for operational and engineering logs can also be utilized to support maintenance management initiatives. This information can be deployed in a similar fashion to condition data. Examples of performance data include the following:
• Pressure (inlet, discharge, differential) • Temperature (exhaust, inlet, outlet) • Power (RPM, Torque, kW, HP)
• Consumption (quantity, tonnes, liters, gallons)
Performance data trends can detect degraded operation so that corrective action taken to prevent component or equipment functional failure (ABS CM Guidance Notes, 2015).
Spares Management
Spare parts availability will affect systems and equipment function and availability. However, the benefits of continuing function must be balanced with good business practices to avoid purchasing too many spare parts thus tying up too much money in a non-income producing asset. A risk based procedure similar to that in the ABS RCM Guidance Notes can be applied. The approach is to identify spare parts with long lead times to deliver whose absence would result in a significant unavailability of the asset, those that can be ordered just in time to install for systems or equipment whose imminent failure can be predicted accurately, and those parts whose being out of stock would not affect system or equipment function.
Figure 3: Selection and Planning of Monitoring tasks
Decision Support
The application of condition and performance results into the maintenance system can be executed in multiple ways. The data sets can be used as a stand-alone review of equipment health, coupled with planned maintenance tasks to assist in shortening or extending maintenance intervals, or holistically applied as a condition based or predictive maintenance system. Each tier can provide value to the user as each provides the capability to trend and forecast equipment health information completing the transition from data to information and finally knowledge. Additionally, not all equipment will have the same strategy applied. Operators should evaluate their machinery based on criticality and risk and then apply an appropriate process.
Traditional Planned Maintenance (with no condition monitoring tasks)
Traditionally, operators have relied on Original Equipment Manufacturer (OEM) experience in developing a maintenance plan. This historically has been a time or period based planned maintenance that entails replacement of components regardless of their condition at the time. The intent is to restore the item before a specified age limit (e.g. “like new”), to a level that provides an acceptable probability of survival to the end of another specified interval. Many OEM’s have recommended condition or performance monitoring activities that can be substituted into the traditional planned approach.
Monitoring Program Separate from Maintenance
Operators can choose to add monitoring activities to supplement their planned maintenance program with little or no impact on the schedule. Condition and performance monitoring provides equipment health data that can be used for future changes to the maintenance scheme. This can be used as a research pilot or proof of concept for monitoring techniques. Many times the monitoring results are used for non-maintenance activities such as regulatory, classification, or commercial interests.
Monitoring Used to Modify the Maintenance Plan
Condition and performance monitoring data can also be a valuable addition to maintenance planning and scheduling.
Onset of failure detectable? • Failure mode aligns with monitored parameter
• Limit established for determining action
Practical Interval for monitoring • Interval less than half P-F • Detection must provide sufficient time for action
Cost Effective • Critical assets • Reduces probablity of failure
Operators executing a planned maintenance system can use the monitoring results to extend or shorten equipment’s next scheduled periodic maintenance. The trigger for maintenance actions is still based on the predetermined schedule, but small changes can be made based on monitoring results.
Holistic Application of Monitoring
In the fourth case, maintenance is truly condition-based. The only regularly scheduled maintenance tasks are for monitoring and data collection. The results from these actions are used to plan when to schedule maintenance. Often, these are executed based on a predetermined condition relative to a baseline. In sophisticated programs, the information is trended and forecasted to optimize the time and level of maintenance. These types of programs are often defined as predictive maintenance.
Monitoring Impact on Sustainment
Sustainment programs are designed around providing continuous improvement. Data collected from monitoring solutions and the information and knowledge gained from these activities can assist in providing improvement back into the current maintenance plan as well as future initiatives.
AUTOMATED DATA OVERVIEW
Streamlining the collection and analysis of data through the effective use of software not only relieves the paper-based burden of crew data collection, but can also improve accuracy and timely reporting to many interested parties. The data management motto, “single entry and multiple outputs” can easily be handled by software. A combined platform can also provide electronic data capture, analysis, maintenance planning, and reporting.
Challenges
Application to in-service assets will require an analysis of the automation and data collection infrastructure. Not all process automation technologies and protocols are compatible with each other. Many control and automation vendors operate in proprietary data formats and each of the machinery control systems may not be integrated. For these instances, there are hardware and software solutions available that can bridge different device types and protocols, thus enabling different OEM supplied equipment to communicate on a common bus. Even modern vessels and offshore structures may be constructed with non-integrated automation and control systems. This challenge can be addressed during the design and construction phase or if already in service through retrofit.
These new data collection and electronic systems being deployed are vulnerable to security threats to data and developing an effective cybersecurity strategy is a new challenge to overcome. Even isolated systems and those disconnected from the internet have been successfully targeted (Dewitt, 2013). To combat this threat, the control system as well any system interfaces should be included in a security assessment and active processes created to thwart these concerns.
Infrastructure Requirements
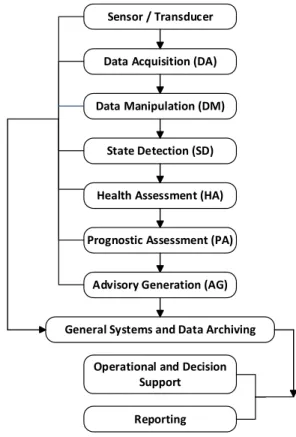
To overcome the challenges, the information technology infrastructure at sea and its associated communication architecture must be enabled for the controlling and monitoring of operating parameters. Figure 4 illustrates ISO-13374 identifies functional blocks that shape data collection and processing for condition and performance based maintenance applications. This standard pertains to the direct capture of operational data. Once captured in the prescribed process, the information can feed the operational decision support infrastructure.
Data Acquisition (DA) Sensor / Transducer
Data Manipulation (DM)
State Detection (SD)
Health Assessment (HA)
Prognostic Assessment (PA)
Advisory Generation (AG)
Operational and Decision Support Reporting
General Systems and Data Archiving
Figure 4: ISO 13374 Functional Blocks
The initial building block in data acquisition consists of the sensors and transducers that are interfacing with the physical systems of interest. The analog and digital signals from these sensors are then wired to a physical input/output (I/O) device that converts analog signals to digital values or receives digital values directly from the sensors for use on a serial data bus. Individual I/O devices are wired to an I/O module that contains many I/O devices. The I/O modules are normally integrated into a single serial data bus using one of many standard process automation technologies.
In short, a vessel’s serial bus thus provides the data pathway between physical sensors and the hardware/software interfaces to enable automated data collection. The data must then be converted to a higher level Ethernet protocol to bridge the serial data protocols. Through this bridge, the data is converted to a standard Ethernet protocol to receive or send data by request, or broadcast throughout the network to be read by external third
party software applications. Established serial data process automation protocols have a companion Ethernet standard.
SMART ENTERPRISE ASSET MANAGEMENT
(EAM)
Prognostic Software Applications
Next-level or summary software and monitoring applications in this scenario are required to interface with multiple protocols to accept the necessary data from the network. Interoperability standards exist for data exchange in automation and maintenance applications. Two examples are:
• The OPC Foundation, an organization responsible for open interoperability standards that enable the movement of information between control and monitoring systems and enterprise systems from multi-vendors. It provides an open interface specification for interoperability between devices and network protocols and data manipulation and state detection applications (www.opcfoundation.org).
• MIMOSA is a not-for-profit trade association dedicated to developing and encouraging the adoption of open information standards for Operations and Maintenance in manufacturing, fleet, and facility environments. MIMOSA's open standards enable collaborative asset lifecycle management in both commercial and military applications (www.mimosa.org).
After the data has been transmitted from sensor to summary software it must be manipulated and have additional computational analyses completed. For example, inlet and outlet pressures of a pump can be analyzed to determine an average
differential pressure that can be used to trigger certain physical events such as a maintenance task or simply to perform additional data analysis, such as trending.
CMMS Integrated Solution
Prognostic and diagnostic analysis needs to be incorporated into the operational maintenance plan. The computerized maintenance management system must manage these inputs from the prognostic software or have the services integrated into the CMMS suite. Data collection and analysis is then incorporated into maintenance and operational planning. This can impact maintenance scheduling, man-hour estimates, and spare parts management.
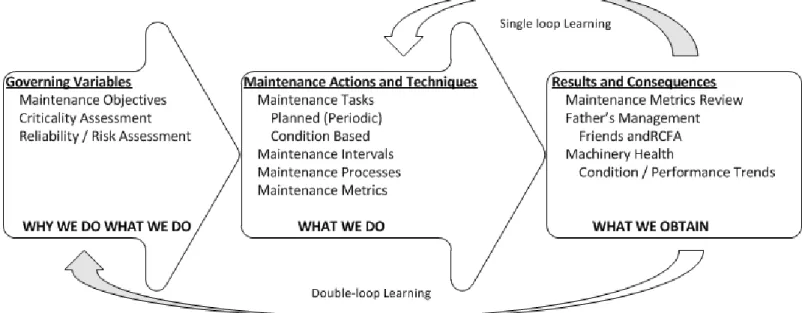
Closing the loop
To support effective and efficient asset management, maintenance must be dynamic and supported by a documented sustainment plan. This plan should be organized such that the results can be effectively used to provide feedback for the reliability and integrity analysis as well as any proposed updates for modifications to the OEM’s Service Notes. A key variable in effective sustainment is the operator’s collection, analysis, and review of in-service data throughout the operating life of the asset. When using “Smart EAM,” the information gathered from performance and condition monitoring techniques creates a learning loop to both improve operational execution as well as influence the next generation of assets in design, operations, maintenance, and inspection. This learning loop is a method that enables “evergreen” program maintenance. This will generate feedback to be applied throughout all stages of an asset’s life. Such knowledge-based decision points will also be applied for future improvements in design, operational envelopes, maintenance philosophy, and overall operational planning.
The EAM programs and processes described will impact operators as well as regulatory and other third-party stakeholders. With emerging technologies available for assessing asset health, a minimally disruptive program should be in place for maintenance, inspection, regulatory, and class survey activities. To achieve this, classification societies as independent third-party organizations working with both industry and regulatory bodies must align their efforts with client operations.
Cybersecurity
Since the data collection may interface with the control system, a security assessment should be completed on the entire interconnected system. The assessment should include base-lining the security and performing a threat assessment. The results are then reviewed for gaps in the security plan. Any identified gaps need to be risk assessed, prioritized and planned
for remediation.
Figure 6: System Security Review and Remediation (Dewitt, 2013)
MARINE AND OFFSHORE APPLICATIONS
Third party condition monitoring and application
to maintenance
Many marine applications of condition monitoring are supplied by third party external specialists. Operators hire experienced third party specialists to regularly attend their vessels for scheduled monitoring and data collection. The third party specialist collects data and then performs data review and analysis. At the conclusion of this process, a client report is generated and submitted to the client via hard copy or electronically (pdf, xml, etc). The report lists all the equipment monitored, current status, plus any marginal or unsatisfactory results. The report will also include recommendations if a piece of equipment requires action. CMMS systems can aid the operator in evaluating if these results impact on the maintenance schedule. An example of this application can be demonstrated with ABS Nautical Systems software.
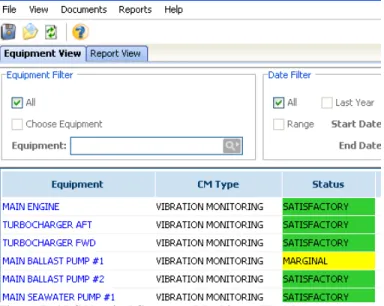
ABS Nautical System’s users can import xml versions of condition monitoring reports. These results are loaded in a machinery health page (see Figure 7) for review.
Figure 7: ABS Nautical Systems - Machinery Health
Traffic light indications are used to represent satisfactory, marginal, or unsatisfactory CM results. The user then has the option to create work orders or modify maintenance as necessary. The NS system tracks this activity separately from normally scheduled planned maintenance so that the user can review condition based jobs and generate reports as necessary. A key reporting requirement is the necessary documentation to satisfy classification societies. This normally includes the:
• list of equipment enrolled, • maintenance records,
• summary of condition results, and • failures and actions taken
The NS software creates this report for the user to satisfy classification requirements. See sample reports in Figure 8.
Leveraging condition data for continuous
improvement initiatives
The condition monitoring data collected can be further analyzed to estimate reliability and remaining life through statistical analysis. Figure 9 illustrates the spectrum analyses of the vibration signals of a series of monthly condition monitoring
readings of an auxiliary boiler water feed pump versus frequency amplitude. Each frequency exhibiting an amplitude represents a particular component within the pump or electrical motor. By plotting these amplitudes and trending them over time, estimates of the condition of the components and their remaining life can be determined.
Figure 9: Auxiliary Boiler Feed Pump No. 1 Vibration Measurement Map (Waterfall Diagram) Figure 10 is an example of the degradation paths for one
measurement point on one pump unit. Path “A” represents the initial degradation path. Sometime during Day 60 and Day 90 of operation, the amplitude of vibration exceeded the preset velocity limit of 0.30 in/sec. The unit was repaired, vibration
measurements were taken to establish a “baseline” and a new Path “B” was established. When the amplitude exceeded the preset limit between Days 180 and 210 the unit was repaired and new Path “C” was established.
Figure 10: Repairability and Degradation Path –Time Reset to 0 50 100 150 200 250 300 350 400 450 500 550 600 650 700 750 800 850 900 950 1000 0.00 0.10 0.20 0.30 0.40 0.50 0.60 0.70 0.80 0.90 1.00 1.10 12/ 8/ 2009 1/ 1/ 2010 2/ 22/ 2010 3/ 6/ 2010 4/ 10/ 2010 4/ 11/ 2010 5/ 5/ 2010 6/ 3/ 2010 7/ 2/ 2010 8/ 2/ 2010 9/ 20/ 2010 10/ 19/ 2010 f [Hz] RPM : 3585 (59.75Hz) M(x) : 60.00 Hz (1.00 Orders) M(y) : 0.40 inch/ s
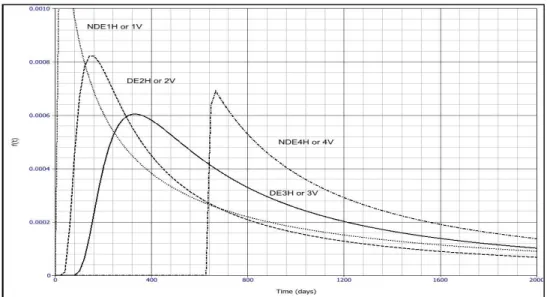
Figure 11: PDF Adjusted Data by Measurement Point Similar paths can be developed from other identical pump units
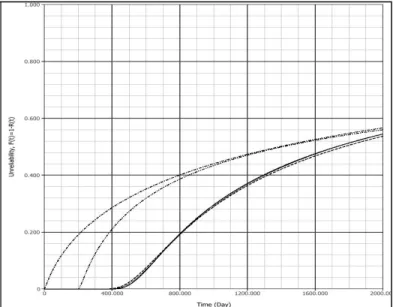
so as to develop a population to determine a product density function (PDF), an example of which is shown in Figure 11 for the four measurement points on the units. From the PDF, the cumulative distribution function (CDF) can be calculated to provide the probability that the unit will fail after a certain time. Figure 12 illustrates the CDFs for the four measurement points. The operating time for the pump units is stopped at 2000 days or about 6 years of vessel operation recognizing the pumps will likely be overhauled during the vessel’s drydocking at about 5 years. The extrapolated data at 2000 days show a range of 40% to 56% of the pump units to be expected to fail by that time.
Figure 12: CDF Adjusted Data by Measurement Point
Figure 13: CDF Adjusted Data by Point – 90% Confidence Interval at NDE3H or 3V
Figure 13 plots the CDF for measuring points NDE3H or 3V along with 90% confidence bounds including the plots of the actual data. Because of the limited data points, the bounds are large, e.g. at 2000 days, lower bound is 38%, average 56% and upper bound 87% estimated failure rates. The results are useful to an operator in that with large bounds there should be adequate spare parts readily available. It may be necessary to investigate and identify root causes of the failures. A stochastic approach for estimating the degradation paths can be applied. For the relatively small numbers of pump units there are special statistical techniques to use to estimate function parameters (Rousseeuw and Verboven, 2002). A two-stage method described by (Lu and Meeker, 1993) was applied. In the first stage the most appropriate mathematical function for individual degradation paths for all 15 pumps was determined to be a linear model for which the two parameters were calculated. In the second stage, the two parameters were transformed and combined and an asymptotic variance-covariance matrix developed. The second stage parameter estimates were used in a random number generator to develop a simulated failure time distribution. The results are
shown in Figure 14 for CDFs based on 500, 1250 and 2500 simulated failures compared with the CDF for measuring points NDE3H or 3V for all data and an additional CDF omitting early failure data.
A smaller number of simulations provides similar results to the two larger simulations. For this case the simulations provide the operator with a CDF corresponding to the lower bound in Figure 13.
Figure 14: CDF Comparison of Measured Adjusted Data for DE3V or 3H and Estimated Data
RELIABILITY INITIATIVES AND
CLASSIFICATION
Classification Societies and Administrations are in the process of updating their existing requirements and policies to reflect new technologies recently developed for existing and future assets. Issues relating to data acquisition, storage, and utilization are key topics across many industries. Vessel operators and offshore asset managers are striving towards improved operational efficiencies while also reducing cost of operations. A key driver in this puzzle is maintenance planning, execution, and continuous improvement. The end result of these efforts is to minimize operational disruptions through:
• Improved equipment reliability and asset availability • Rationalized maintenance intervals supporting
operational goals
• More intimate knowledge and understanding of system integrity and component interaction
• Quantitative measurement of equipment and machinery health based on maintenance, condition, and
performance information
• Improved coordination and alignment of classification activities through collaborative data and information exchange
These goals require the operator to address asset and equipment maintenance management with fundamental reliability techniques. To maximize the benefit from executing these principles, reliability techniques should be leveraged over the complete lifecycle of equipment and machinery. Establishing data and information collection routines and systems within the maintenance structure assists these reliability efforts while providing the best picture of equipment health.
Enrollment in the ABS Preventative Maintenance Program (PMP) allows the operator to execute planned maintenance and condition monitoring activities that assist in achieving crediting of the ABS Special Survey – Machinery when the ABS Surveyor verifies the preventative maintenance is being carried out onboard at the Annual Survey – Machinery. This Program can reduce disruptions and minimize impact to operations from ABS Survey activities.
ABS has additional Programs that support development of maintenance plans to meet the PMP requirements. Leveraging reliability techniques into the maintenance development process can improve the effectiveness of the overall maintenance program. The benefits from executing reliability based maintenance activities include the following:
• Improved cost effectiveness of maintenance, • Reduction of failure frequency, and
• Continuous improvement through sustainment activities
The result of a reliability based development process is a maintenance program can then best maintain the designed reliability of systems and equipment. To improve the inherent reliability of a system or component, it must be addressed in the design stage. Applying risk and reliability analysis tools throughout the design process provides the information needed by the operator to make more informed design decisions. These design strategies focus on:
• Improving equipment and configuration reliability through their arrangements,
• Designing to simplify manufacturing and assembly, • Forecasting the design needs anticipated for operations,
maintenance, and inspection,
• Generating a testing and evaluation plan to confirm and validate the changes in design
The end result is to manufacture a proven design with the future reliability-related performance meeting design expectations.
CONCLUSION
The use of data and its incorporation into operational and maintenance planning is becoming more easily accessible as systems are becoming smarter and more data dependent. This type of data collection, analysis, and monitoring of machinery condition, performance, and maintenance data will be vital to effective marine asset management. The planning of these
activities should rely on reliability techniques to best align monitoring solutions to equipment failure strategy. Tying data collection into the vessel or asset’s systems can reduce crew burden and help turn an often complex puzzle of qualifying and analyzing condition and performance data into a standardized process for decision making and maintenance planning. The information gathered from these processes can create a learning loop that, when implemented in an EAM strategy, can improve current operational execution and influence the next generation. These efforts can provide increased asset value and result in improved asset safety and operational effectiveness. Therefore, classification societies should provide reliability programs to recognize this improved maintenance program performance. An additional benefit is a more clear definition of asset health so that unanticipated repairs are minimized and operations are less prone to delay. These programs will help provide requirements for improved reliability which seek to reduce the risk to personnel, vessels or marine structures, and the environment. This will potentially reduce the economic consequences due to a machinery failure which can otherwise occur more frequently if a rational maintenance strategy was not applied.
REFERENCES
Carlucci, D.; Hagan, J.; Bhaskarabhatta R.; and Wilson, J. Solving the Complex Data Flow of Environmental and Energy Management, 2012.
Lu, W. Q., and Meeker, C. J., "Using Degradation Measures to Estimate a Time-to-Failure Distribution,"
Technometrics, vol. 35, no. 2, pp. 161-174, May 1993.
Nicholls, D., System Reliability Toolkit, Reliability Information Analysis Center (RIAC), 2005.
Rousseeuw P. J., and Verboven. S., "Robust estimation in very small samples," Computational Statistics & Data Analysis, vol. 40, pp. 741-758, 2002.
Dewitt, C.: Control System Cyber Security: Staying Ahead of the Evolving Threats, 2013
ABS Guidance Notes on Equipment Condition Monitoring Techniques 2015
ABS Guidance Notes on Reliability Centered Maintenance 2004 ISO/TC 13372, Condition monitoring and diagnostics of
machines -- Vocabulary
ISO/WD 13374-2, Condition Monitoring and diagnostics of machines -- Data processing, communication, and presentation part 2: data processing
ISO 13379-2, Condition Monitoring and diagnostics of machines – Data interpretation and diagnostic techniques, Part 2: data-driven applications
OPC Foundation, 2015. Web https://www.opcfoundation.org MIMOSA, 2015. Web http://www.mimosa.org