"GLOBALIZATION AND ITS DISCONNECTS"
Simon Teitel*
Abstract: Globalization, defined in economic terms as the phenomenon of
increased integration of the world economy, generates strong reactions due to some negative effects of the growth of international trade, the internationalization of industrial production, and unrestricted cross-border capital flows, while the overall mobility of labor remains quite limited. Evidence on the growth of international trade and factor mobility is reviewed and analyzed, and problems affecting developed and developing countries are detected. Policy measures to alleviate some of the dislocations from increased globalization are discussed, and some measures recommended to avoid social and political disruptions.
Key words: Globalization, international trade, capital flows, labor mobility, technology, intellectual property rights.
JEL classification: F02, F13, F21, F22, F33, O19, O34. ______________________
* Paper written while at ICER, Turin, as a Visiting Fellow for the period October-December, 2001.
..."[Civilization] is a process....whose purpose is to combine single individuals, and after that families, then races, peoples and nations,
into one great unity, the unity of mankind." Sigmund Freud (Civilization and Its Discontents, p.69)
I. Introduction
Two main kinds of disturbances of the status quo seem to have been responsible for the strong reaction globalization has generated in some quarters. The first, has to do with the uprooting imposed upon workers and localities due to drastic changes in the pattern of production and trade. The second, more general in character, has to do with the well known feature of market mechanisms that generally do a pretty good job in allocating, via prices, resources, while failing to provide any signal to improve economic equity. Thus with the enhanced reliance on markets to the detriment of national regulations implicit in globalization, it is natural to expect an increased clamor for considerations of economic equity within and between national economies.
1
Paraphrasing Freud, I had first selected the title: "Globalization and its Discontents", but had to give it up after learning that it had already been used by others (Sassen, 1998).
Research assistance by Bianca Vitting and Lorenzo Boratto is gratefully acknowledged. E. Colombatto, E. Londero, and attendants at a seminar organized by ICER and the Department of Economics and Finance, Torino University, provided helpful comments which are greatly appreciated, but they are not responsible for the final product.
2
Chevy Chase, MD 20815. E-mail: [email protected]. Paper prepared while at ICER, Torino.
In preparing this paper, one of my guidelines was to try to differentiate between the impact of globalization in developed and developing countries. Besides my own interest in development economics, this distinction is necessary, if for no other reason, because factors determining globalization largely originate in developed countries, and while they affect other countries, the scope for action, or reaction, particularly by developing countries, appears to be quite limited.
While political, cultural and other kind of considerations are necessarily involved in trying to fully grasp the complexity of the globalization phenomenon, for reasons both of comparative advantage and space, preeminence in this paper is necessarily given to international economic phenomena. For our purpose then, globalization is defined as the phenomenon of increased integration of the world economy as evidenced by the growth of international trade and factor mobility.
Political economy type of considerations, rather than theoretical analysis, characterize its contents which comprises, in section II, evidence about globalization pertaining essentially to international trade and international finance. Ensuing problems, or "disconnects", are discussed in section III. The paper closes with a section of conclusions and possible remedies.
II. Evidence
Depending on their background and interest, people mean different things when they talk or write about globalization; particularly, about what is becoming globalized, or what could be considered to have become more global, now, than before. Moreover, in trying to assess the evidence, different concepts, means of measurement, and comparisons can be made3.
When trying to focus on particular indications of the globalization phenomenon, several potential categories of evidence come to mind. 1) First, evidence about changes in the volume of international trade and the internationalization of production. 2) Second, evidence about the expansion in factor flows including: capital, labor, and technology. 3) Third, evidence reflecting increased access to information, via the internet, cable and satellite TV, and other means of communication. 4) Finally, evidence related to limitations to national sovereignty, including regulatory, judicial, and other powers being increasingly delegated to public international organizations, which will only be treated briefly and in passing.
Below, albeit in summary fashion, evidence on the above mentioned facets of globalization is considered, and, measurements, or appropriate indicators, are provided whenever possible.
3
For instance, in assessing the extent of integration of the world economy, several authors have compared recent times with the "golden" period 1870-1914. See, for example, Streeten, 2001 and Williamson, 1998.
A. International Trade and Internationalization of Production
As a result of successive rounds of tariff reductions within GATT plus deep cuts in transport costs due to technical change, export volumes have grown at substantial rates during the last century as can be seen from the data in Table 1. When measuring trade intensity by the proportion of exports (X) to GDP, very significant increases in that ratio have taken place during the last decade compared to the changes that took place during prior periods of trade liberalization (Table 2 and Figure 1).
Table 1. World Economy. Annual Growth Rate in Export Volume. Selected Periods. 1870-1998
(percentages)
1870-1913 1913-1950 1950-1973 1973-1998
3.4 0.9 7.9 5.1 Source: Maddison 2001, Table F.4, p. 362.
Table 2. World Economy. Exports as a % of GDP. Selected Years 1870-1998
1870 1913 1929 1950 1973 1998
4.6 7.9 9.0 5.5 10.5 17.2 Note: Exports and GDP in 1990 prices.
Source: Maddison 2001, Table F.5, p. 363
The historic data provided by Maddison shows a substantial expansion in exports (thus in international trade), during the period 1950-73 (Table 1) and also that in spite of large concomitant increases in output, as measured by
GDP, there were significant jumps, from 5.5% in 1950 to 10.5% in 1973 and 17.2 in 1998, in the proportion of Xs relative to GDP, (Table 2 and Figure 1).
Table 3, contrasts the results of using the IT/GDP indicator with an IT/VA measure for a group of countries.
Table 3. Average Ratios of Merchandise Trade to GDP and of Merchandise Trade to Value Added. Selected Countries* and Years (1890-1990), percent.
Indicat. 1890 1913
1960 1970 1980 1990
IT/GDP 13.29 17.02 11.17 12.45 17.02 16.17 IT/VA 24.81 32.85 22.66 28.65 42.86 47.65
* Un-weighted average for Australia, Canada, France, Germany, Italy, Japan, United Kingdom and the United States.
Source: Based on data from Feenstra, 1998, Table 2.
As has been suggested, the above results probably reflect the fact that GDP includes agriculture, a sector in which trade has been constrained due to protectionist policies in a number of countries, as well as non-tradable goods such as services that have considerably increased their share in GDP during recent phases of economic growth in industrialized countries. A better indicator would then be the ratio of IT divided by a measure of value added without services and agriculture4.
4
Feenstra 1998, has proposed using the ratio of IT over value added in production.
Figure 1. World Economy. Exports as % of GDP (Source: Table 2) 0 2 4 6 8 10 12 14 16 18 20 1870 1913 1929 1950 1973 1998 Years Percentages Serie1
Feenstra (op. cit.) talks about the "disintegration" of world industrial production due to the increased use of subcontracting by multinationals, and even domestic firms, while Streeten (op. cit.) refers to the "integration" of world production. Perhaps, a better image, applicable to world scale industries, would be that of an "international industrial production function" and the changes affecting it.
First, and probably foremost, would be those changes originating in cutting edge innovations and technical progress, to a large extent restricted, to the major innovating countries, i.e., the US, Japan and some European countries. Then, locational changes in production due to changes in comparative advantage as a result of factor changes due to induced
accumulation, plus economies of agglomeration (Krugman, 1991).
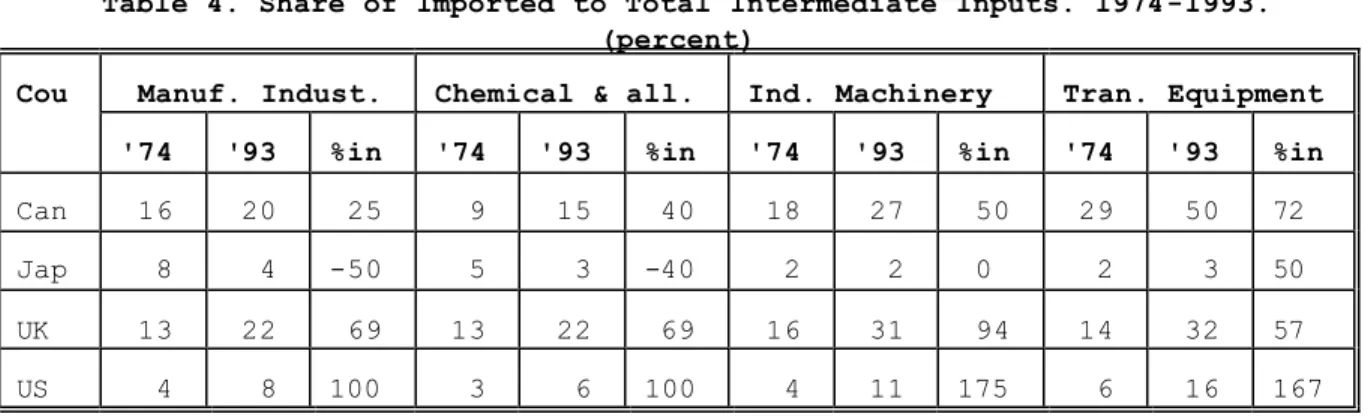
We can certainly discern a multitude of new producers in new locations. This is particularly true for intermediate industrial products, both metallurgical and chemical, whose manufacture is characterized by the need for large plants to enjoy economies of scale, as well as access to raw materials and efficient transport facilities. Until recently, such intermediate products were almost exclusively produced by the most industrially advanced countries, but are now being supplied by an array of semi-industrialized countries in Europe, Asia and Latin America.
Table 4, below, presents evidence about this phenomenon, including also data for some machinery and transportation equipment. The trend is quite clear, even for machinery and transport equipment, among the developed countries included, except for Japan, that matches the trend towards increased participation of imported intermediates only in transport equipment.
Table 4. Share of Imported to Total Intermediate Inputs. 1974-1993. (percent)
Cou Manuf. Indust. Chemical & all. Ind. Machinery Tran. Equipment
'74 '93 %in '74 '93 %in '74 '93 %in '74 '93 %in
Can 16 20 25 9 15 40 18 27 50 29 50 72 Jap 8 4 -50 5 3 -40 2 2 0 2 3 50 UK 13 22 69 13 22 69 16 31 94 14 32 57 US 4 8 100 3 6 100 4 11 175 6 16 167
Note: Shares were rounded off to integer figures.
Developing countries may also take advantage of opportunities opened up by TNCs in industries lending themselves to the breaking up of the manufacturing process into various stages, permitting in this way entry to firms with limited technical skills but capable of providing adequate assembly labor. Industries such as shoes, clothing, furniture, and some electronic assembly, provide perhaps the best examples. See, UNIDO, 2001.
In its last annual report (p. 30), the Bank for International Settlements (BIS), summarizes these developments as follows:
..."Production processes have become increasingly decomposed, vertically as well as horizontally. Compared with the past, each process now involves a growing number of intermediate stages, which are spread across countries and thus contribute to the
growing trade shares by country".
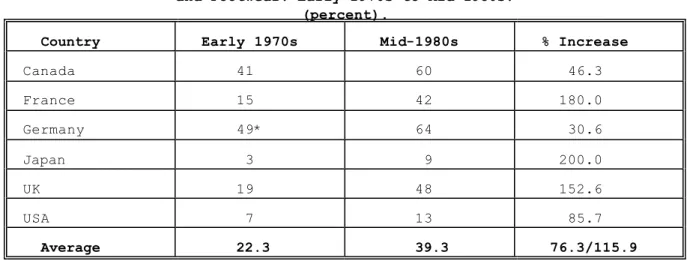
Table 5 below presents data on imported intermediate inputs for some of the labor intensive industries mentioned above. As can be seen, the share of imported intermediates increased significantly for all countries, including this time also Japan that seems to follow different policies vis a vis vertical integration depending on the type of industry. To properly account for this differential behavior will require additional research.
Table 5. Ratio of Imported to Domestic Intermediate Inputs. Textiles, Apparel and Footwear. Early 1970s to Mid-1980s.
(percent).
Country Early 1970s Mid-1980s % Increase
Canada 41 60 46.3 France 15 42 180.0 Germany 49* 64 30.6 Japan 3 9 200.0 UK 19 48 152.6 USA 7 13 85.7 Average 22.3 39.3 76.3/115.9
Notes: * Data is for mid/late 1970s.
In the column of % increase, 76.3 is the average of the averages for the two columns to the left, and 115.9 the average of the % increases in the last columns.
Source: Feenstra, 1998, Table 4 and author's calculations.
Other observed changes in the structure of international trade have to do with the increasing importance of manufactures in merchandise exports, and of so-called high-technology exports as a proportion of manufacturing exports. According to World Bank data, manufactures increased its share of total merchandise exports from 65% in 1980 to 78% in 1996/97. As for high-technology exports, Table 6 summarizes, statistically, information for 50 countries, 28 developed and 22 developing. The mean (arithmetic) of the country proportions are quite similar for both groups of countries: around 1/4 of total exports of manufactures are already of high-technology manufactures. As can be seen, the difference between the two groups is in the variability of the data rather than in its central tendencies, with the developing countries showing a larger standard deviation and range.
Table 6. High Technology1/ Exports in Total Exports of Manufactures (%)
Statistic Developed Countries2/ Developing Countries3/
Mean 25.1 24.0 Standard Deviation 12.6 19.8 Range 7-62 3-71
Notes: 1/Exports of goods from industries that in the USA rank in the top 10 according to R&D expenditures; 2/data for 28 selected countries; 3/data for 22 selected countries.
Source: World Bank, World Development Report. 1998/1999 and 1999/2000, World Development Indicators, Table 19.
B. Factor Movements
Free international trade is, at best, only a proxy for free factor movements. In a fully integrated international economy, i.e. one with free markets for goods and factors, all factors of production would move freely, and the "trend" towards equalization of factor prices foreseen by the Stolper-Samuelson theorem would be fully realized. Below we comment briefly on the international mobility of labor and technology, and with a bit more detail on that of capital.
1. Labor
While in recent years there has been some improvement in the degree of freedom with which capital, and to a lesser extent technology, move internationally, labor mobility is arguably lagging way behind.
restrict the quantity and quality of labor flows. Table 7 provides data on inflows of foreign workers into OECD countries during the period 1988-1997. As can be seen, the total yearly inflows are quite small not reaching even the million figure. Countries like Australia, Canada and Switzerland show a trend towards declining workers immigration while in Germany, the U.K. and the U.S.A. there is an upward trend.
Table 7. Inflows of Foreign Workers into Selected OECD Countries. 1988-1997 (thousands) Country 1988 1991 1994 1997 Australia1/ 34.8 48.4 12.8 19.7 Canada 289.22/ 233.8 172.9 n.a. France3/ 12.7 25.6 18.3 11.0 Germany 60.4 241.9 221.2 285.4 Italy n.a. 125.5 99.8 166.3 Spain 9.6 81.6 15.6 23.2 Switzerland 34.7 46.3 28.6 25.4 U.K.4/ 10.4 12.9 13.4 18.7 U.S.A.5/ 58.7 59.5 123.3 90.6 Total 510.5 875.5 705.9 817.6
Notes: 1/ Permanent settlers; 2/ data for 1989; 3/ permanents; 4/ long term; 5/ permanent settlers.
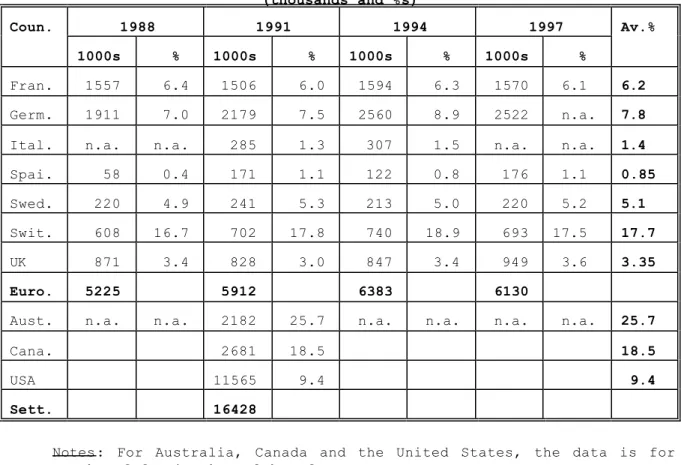
Source: OECD, Trends in International Migration.1999, Paris, Table A.2.1 The flows data is complemented with that in Table 8, which provides information on stocks of foreigners in the labor force, also for selected OECD countries. Among European countries, only in Switzerland, badly in need of foreign workers, has the stock of foreign workers reached beyond 10% of the labor force. On the other hand, in what were the "areas of new settlement", or the "new world", during the last century, the proportions of foreign stock in
the labor force remain substantially higher. This is particularly true for Australia and Canada, and to a lesser extent for the United States.
In contrast, the historic record shows that during the period of increased international trade under the gold standard (1870-1913), immigration was substantially freer and many millions of people crossed the Atlantic in search of a better life in areas of more recent settlement. See Table 9 below. Moreover, after the wave of labor across the Atlantic, immigrants represented very high proportions of the labor force in the "new world" with an un-weighted average of 49%.
Table 8. Stocks of Foreign Labor in Selected OECD Countries. 1988-1997. (thousands and %s)
Coun. 1988 1991 1994 1997 Av.%
1000s % 1000s % 1000s % 1000s %
Fran. 1557 6.4 1506 6.0 1594 6.3 1570 6.1 6.2
Germ. 1911 7.0 2179 7.5 2560 8.9 2522 n.a. 7.8
Ital. n.a. n.a. 285 1.3 307 1.5 n.a. n.a. 1.4
Spai. 58 0.4 171 1.1 122 0.8 176 1.1 0.85
Swed. 220 4.9 241 5.3 213 5.0 220 5.2 5.1
Swit. 608 16.7 702 17.8 740 18.9 693 17.5 17.7
UK 871 3.4 828 3.0 847 3.4 949 3.6 3.35
Euro. 5225 5912 6383 6130
Aust. n.a. n.a. 2182 25.7 n.a. n.a. n.a. n.a. 25.7
Cana. 2681 18.5 18.5
USA 11565 9.4 9.4
Sett. 16428
Notes: For Australia, Canada and the United States, the data is for stocks of foreign-born labor force.
The United States data is for 1990.
Besides assessing the size (quantity) of recent movements of labor as compared to prior liberalization periods, differences in the impact of labor flows upon developed and developing countries need to be mentioned. For example, in the US, there have been recent proposals to impose conditions on the quality of immigration. Large inflows of unskilled labor are feared because they may lead to further deterioration in wages paid to local unskilled workers. These are already deemed to have been negatively affected by skill-biased technical change plus increased imports of labor intensive goods.
Table 9. Impact of Labor Migration from 1870 to 1910 on Local labor Force in 1910. Selected Countries and Regions
Country/ Region Migration Impact on Labor Force (%)
Great Britain - 11 Ireland - 45 Italy - 39 Scandinavia* - 19 Europe - 13 Argentina 86 Australia 42 Canada 44 United States 24 New World 49
* Denmark, Finland, Norway and Sweden. Source: Williamson, 1998, Table 1.
The issue has both theoretical and empirical underpinnings. According to Heckscher-Ohlin-Samuelson trade theory, free mobility of labor would have the same effect (of depressing wages of the less abundant factor) that was
foreseen by the Stolper-Samuelson theorem. Empirically, while US data tends to confirm a deterioration in real wages for unskilled labor during the last 25 years, it is hard to disentangle the main culprit among the effects of skilled-biased technical change, increased imports of labor intensive products, and immigration biased towards unskilled labor.
On the other hand, US high-tech businesses are pressing the government to increase immigration allowances for skilled immigrants, particularly in such fields as computer-science, telecommunications, and biotechnology. Thus a new version of the so-called brain-drain from the developing countries that took place during the 1950s and 1960s might be in the making5.
2. Capital
In most accounts, capital movements loom as the single most important factor defining the present phase of globalization. Large capital movements across boundaries had previously been almost totally restricted to advanced economies. The "opening" up of the capital accounts in a number of developing and transition economies which took place during the last two decades as part of economic liberalization policies predicated by the IMF and the World Bank, has led to relatively large capital flows also to these countries6.
5
Engineers and scientists from China and India seem to be in particularly high demand in the US. In fields such as computer software, subcontracting the work in countries such as Chile or India provides a trade alternative to the factor flow, with similar, but not all, the effects associated to it.
6
Liberalization of the capital account meant not only allowing free exit and entry of foreign capital, but also providing assurances of free foreign exchange convertibility of remittances similar to those agreed upon when liberalizing trade transactions.
Capital flows may take various forms, and be long or short term in their duration. The most important flows are: direct foreign investment (FDI), portfolio investment, and bank loans. Tables 10-13 provide the general picture as to recent total capital flows as well as the main discernible trends by components and destinations.
Table 10. Total Capital Flows by Regions and Country Groupings. 1978-1995 (billions of US dollars)
Item/Reg 1978-1981 1982-1989 1990-1995
Value % Value % Value %
Total 442 100.0 578 100.0 1050 100.0 Ind.Coun 374 84.6 554 95.8 915 87.1 Dev.Coun 68 15.4 24 4.2 135 12.9 L.A. 38 8.5 -5 -0.9 47 4.5 E.Asia 16 3.6 17 2.9 69 6.6
Note: Values are the yearly averages for the period.
Source: Bosworth and Collins, 1999, Table A2, and author's calculations. The above data shows:
a. While yearly average nominal flows of all types of capital increased between 1978-81 and 1990-95 from 442 billion dollars to 1,050 billion dollars, i.e. by 137%, the share of the industrialized countries in these flows was, at least, 85% of the total during the three periods.7
7
Note that the periods selected are of dissimilar duration. The first one, starting five years after the first oil price shock of 1973, includes 1979, year of the second shock, and covers only three years; the second period covers seven years during the external debt crisis, and the last one covers five years.
b. During the years of the external debt crisis, the share of the developing countries fell to its lowest value, 4.2%, and the countries in Latin America, those more affected by the crisis, experienced negative flows.
c. During the last, and most recent period, the share of developing countries recovered, but without reaching the level of the first period. Put in another way, while the flows to industrialized countries increased between periods by 145%, those to developing countries only rose by 98.5%.
d. The more developed among them, i.e. those in Latin America and East Asia, received the bulk of the capital flows to the developing countries.
Next, Tables 11-13 show the changes that took place in value and destination for each of the capital flow components, i.e., FDI, portfolio investment and loans.
Table 11. FDI Flows by Regions and Country Groupings. 1978-1995 (billions of US dollars)
Item/Reg 1978-1981 1982-1989 1990-1995
Value % Value % Value %
Total 47 100.0 92 100.0 205 100.0 Ind.coun 38 80.9 79 85.9 151 73.7 Dev.coun 9 19.1 13 14.1 54 26.3 L.A. 6 12.8 6 6.5 18 8.7 E.Asia 2 4.2 5 5.4 31 15.1
Note: Values are the yearly averages for the period. Source: See Table 10.
From the data in Table 11 we see that:
a. Between the beginning and the end of the period analyzed, the nominal total value of FDI increased almost five-fold, from an yearly average of 42 billions to 205 billions, i.e. by 336%.
b. The share of industrialized countries fell from about 81% of the total to about 74%, with a corresponding gain for developing countries whose share increased from around 19% to 26%.
c. The bulk (about 90%) of the flow of FDI to developing countries was absorbed by countries in Latin America and East Asia, i.e. the relatively more developed among the developing countries.
d. There was a clear reversal between the Latin American countries and those in East Asia during the period examined. While initially countries in Latin America absorbed 2/3 of the FDI flow to developing countries, towards the end of the period, the share of Latin America had been reduced to 1/3 of the total flow to developing countries. Put in another way, while the flow of FDI to Latin America increased three-fold in the period covered, that to East Asia increased 15 times.
Table 12, below, shows similarly arranged data for the flows of portfolio investment. The key observations are:
a. The average yearly nominal inflow of portfolio investment increased by 1,075%, i.e. more than ten-fold, in the period covered.
b. While still highly concentrated in industrialized countries, those countries have seen their share reduced from 95% of the total at the beginning of the period, to 89% at the end.
c. While the flows of portfolio investment to developing countries where of minimal proportion during the first two periods, they increased some 25 times towards the end, with the bulk going to Latin American countries. Those countries took in three times as much portfolio investment per year, on the average, than countries in East Asia.
Table 12. Portfolio Investment Flows by Regions and Country Groupings. 1978-1995
(billions of US dollars)
Item/Reg 1978-1981 1982-1989 1990-1995
Value % Value % Value %
Total 40 100.0 168 100.0 470 100.0 Ind.Coun 38 95.0 166 98.8 418 88.9 Dev.Coun 2 5.0 2 0.1 52 11.1 L.A. 2 5.0 0 0.0 36 7.6 E.Asia 1 2.5 2 0.1 12 2.5
Note: Values are the yearly averages for the period Source: See Table 10.
In Table 13, below, we examine similarly arranged data for the yearly flows of loans.
(billions of US dollars)
Item/Reg 1978-1981 1982-1989 1990-1995
Value % Value % Value %
Total 355 100.0 318 100.0 375 100.0 Ind.Coun 299 84.2 309 97.2 345 92.0 Dev.Coun 56 15.8 9 2.8 29 7.7 L.A. 31 8.7 -11 -3.4 -7 -1.9 E.Asia 13 3.7 11 3.4 26 6.9
Note: Values are the yearly averages for the period. Source: See Table 10.
The data in Table 13 indicates:
a. There has been minimal (5.6%) nominal growth in the yearly flows of loans during the period analyzed. In fact, a reduction in the yearly flows in this category when measured in real terms.
b. The industrialized countries absorbed the vast majority of such funds, and their share increased from 84% of the total at the beginning of the period, to 92% at the end.
c. Latin American countries received more than half of loan amounts destined to developing countries during the first period, but a shift to negative values, (i.e. outflows), took place during the next two periods, corresponding to the external debt crisis and its aftermath. On the other hand, East Asian countries doubled their yearly average inflow amount, and almost doubled their share of these funds.
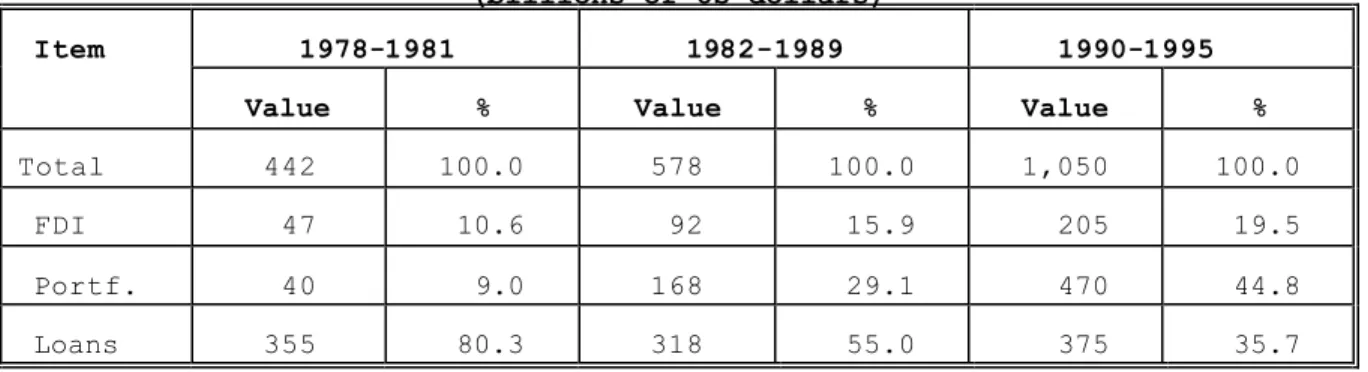
Table 14 below provides a summary picture of the value and composition of the total flows of capital for the period reviewed.
Table 14. Value and Share of Different Type of Capital Flows.1978-1995 (billions of US dollars)
Item 1978-1981 1982-1989 1990-1995
Value % Value % Value %
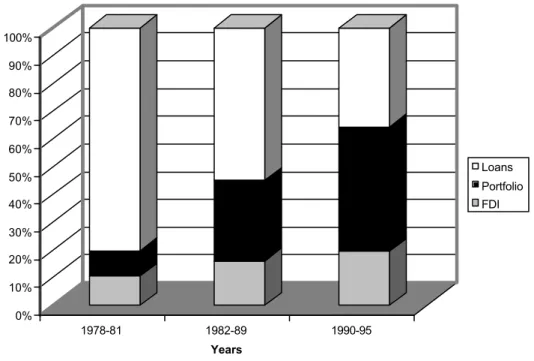
Total 442 100.0 578 100.0 1,050 100.0 FDI 47 10.6 92 15.9 205 19.5 Portf. 40 9.0 168 29.1 470 44.8 Loans 355 80.3 318 55.0 375 35.7
Note: Values are the yearly averages for the period. Source: See Table 10.
As shown in Table 14 and Figure 2, the headlines for the story of capital flows during the period covered are:
a) total flows increased by 137 %, i.e. some 2.4 times;
b) FDI increased its value almost five times and doubled its share in the total;
c) portfolio investment increased its value more than 10 times and its share five times, and,
d) loans increased in nominal value 5%, while its share shrunk from 4/5 of the total capital flow to a little over 1/3 of the total.
0% 10% 20% 30% 40% 50% 60% 70% 80% 90% 100% Percentages 1978-81 1982-89 1990-95 Years
Figure 2. Share of Different Types of Capital Flows (Source: Table 14)
Loans Portfolio FDI
3. Technology
Although we are witnessing an unprecedented expansion in the flow of information across borders, paradoxically, as far as "technology" narrowly defined, i.e. the technical information required for industrial production, there do not seem to have been any major changes directly affecting manufacturing processes in a significant way.
We mentioned above changes in the extent of vertical and horizontal integration which have altered production functions in a number of industries. There have also been changes in industrial management emphasizing quality (as for example the use of quality circles and G.E.'s six-omega quality drive),
lower inventories (as exemplified by "just in time delivery"), and increased worker participation in plant decision-making (in the so-called "japanese management" of human resources)8.
There have been, to be sure, important changes in the technology of processing information that have affected most economic activities. In industrial production, mention could be made, of the use of the computer for planning production and inventories in an integrated fashion, in controlling machines (numerical control), and in robotics, as well as in facilitating product and project design (computer assisted design, CAD).
It is generally claimed that technical progress in transportation and communications have had the greatest impact in globalization so far. Fax machines, cellular phones, satellite TV, and electronic computers plus the internet, have been the major innovations in the field of communications. Cost reductions in transportation have facilitated the spread of international trade, and those in communication the flow of all types of information linking the world together as never before. Financial transactions and political awareness have probably benefited the most.
Table 15, below shows data about the decline in the cost of transport and communications.
8
It should be noted that the origin of some of these improved industrial management practices goes back quite a bit in time before present globalization. Statistical quality control was developed as part of the US war effort during World War II, and in fact later exported to Japan by US consultants, and "just in time delivery" was pioneered by the US automobile industry decades ago.
Table 15. Decline in the Cost of Transport and Communications. 1930-1990 (1990 US dollars)
Year Sea Freight Air Transport Telephone call Computers
Cost % Cost % Cost % Cost %
1930 60 0.68 245 --- --- 1940 63 5 0.46 32 189 23 --- --- 1950 34 46 0.30 35 53 72 --- --- 1960 27 20 0.24 20 46 13 12500 1970 27 0 0.16 33 32 30 1947 84 1980 24 11 0.10 37 5 84 362 81 1990 29 -21 0.11 -10 3 40 100 72 %Decl. 51.7 83.8 98.8 99.2
Notes: Sea Freight: Average ocean freight and port charges per ton. Air Transport: Average revenue per passenger mile.
Telephone call: For a three minutes New York to London call. Computers: Index based on 1990=100.
Source:UNDP, 1999, Box Table 1.1 (based on IMF data), plus author's calculations.
As can be seen, in sea freight, most of the decline in costs took place before the present wave of globalization, and can be dated as a post World War II phenomenon, with costs declining by 46% between 1940 and 1950. In fact, from 1980 to 1990, a negative decline, i.e. an increase in costs, of 21% took place. While air transport costs have been declining steadily, the reduction in costs was arrested in 1990, showing in fact a 10% cost increase for that year.
Undoubtedly, the most dramatic declines have been in communications, with telephony showing sharp declines after World War II and in the period
1970-80. Computers, which are of course the latest innovation, and the one, coupled with the recent diffusion of the internet, perhaps better identified with globalization, show dramatic declines in their cost, from the beginning, and in the period 1980-90 which saw the diffusion of the personal computer.
In spite of all the recent technical progress in computers and communications, measures of labor productivity, such as GDP per hour worked, do not show significant improvement when compared to other periods in economic history.
Table 16. Rate of Growth of GDP per Hour Worked, 1870-1998 (annual average compound growth rates, %)
Country 1870-1913 1913-1950 1950-1973 1973-1990 1990-1998
W.Europe* 1.55 1.56 4.77 2.35 2.16 USA 1.92 2.48 2.77 1.41 1.74 Japan 1.99 1.80 7.74 2.97 2.13 Note: *Weighted average of 12 countries (Austria, Belgium, Denmark, Finland, France, Germany, Italy, The Netherlands, Norway,
Sweden, Switzerland and the United Kingdom). Source: Maddison, 2001, Table E-8, p.352.
Table 16 and Figure 3 compare this record for the USA, Western Europe and Japan. Clearly, the peek in productivity for all three was attained during the period 1950-1973, i.e. following the end of Second World War and up to the first oil price shock. This was undoubtedly a time of intense reconstruction in both Europe and Japan which favored the introduction of innovations. Also to be mentioned was the stimulus provided by trade liberalization during the 1960s.
In the more recent period 1973-1998, annual rates of productivity growth in Western Europe while remaining higher than before 1950, fall to about half their peek values. For the United States, the decline is similar, and, moreover, the country does not attain again rates of productivity growth as high as those reached during 1870-1950.
Figure 3. Rate of Growth of GDP per Hour Worked (Source: Table 16)
0 1 2 3 4 5 6 7 8 9 1870-1913 1913-1950 1950-1973 1973-1990 1990'1998 Periods
Annual Average Compound Growth Rate (%)
W. Europe USA Japan
The decline from the peek is even more dramatic for Japan, but, similarly to Western Europe, this country has kept for the period 1973-1998 annual rates of productivity growth above those observed during 1870-1950.
seem to have overtaken the possible benefits of technical progress cum globalization. However, detailed explanation(s) for these somewhat paradoxical results will require further research.
Globalization, has also been characterized by institutional changes in the rules of the game affecting the use of technology. The birth of the WTO in 1994, as successor to the GATT, saw the adoption of world-wide intellectual property regulations tied to trade access negotiations. These were initially pursued by the industrialized countries, specially the United States, to stop the sale of counterfeit copies of copy-righted and trade-marked goods, but have also had an important effect in the access to patented knowledge.
The regulation by the WTO of trade related intellectual property issues (TRIPS), with its emphasis on faithful adherence to patent laws and other intellectual property restrictions, makes it much less likely that industrializing countries could repeat the experience of technology absorption cum adaptation of the period 1950-1980 in Latin America and East Asia9.
Until recently, India and other countries, had intellectual property regulations permitting the patenting of certain new products but not of the processes for their manufacture. This permitted local innovators to try to find alternative ways to manufacture patented chemical or pharmaceutical products. This is now not permitted by the TRIPs within WTO, and may lead, for
9
Potential innovators in these countries could use "reverse engineering" for understanding how things worked with a view to create alternatives, to adapt a product or process to local conditions, or to improve it. See Teitel, 1981 and 1984, for an overview of the Latin American experience with technology acquisition and development, and Lall, 1996, and 2000, for the East Asian case.
example, not only to higher health costs due to price differences between patented and generic products, but also serve as a strong deterrent to local innovation in this field.
In the case of some drugs, large differences in prices between India and Pakistan have been observed, with prices in the latter country, which permits the patenting of processes, between 3 and 13 times higher than for the same product in India, which does not allow such patents (UNDP, 1999).
The high cost of patented drugs used to treat AIDS has brought out the potential for confrontation, due to the TRIPs regulations, between the innovating (and patenting) countries and largely non-innovating developing countries. Some of the latter have been using such devices as compulsory licensing and parallel imports to bypass intellectual property restrictions affecting the production and importation of pharmaceuticals used to fight the AIDS epidemic10. More recently, besides trying to generate financial aid for the purchase of required medications in the most afflicted countries, the WHO and WTO secretariats have advanced the notion of differentiated prices for so-called "essential" drugs in the developing countries (see, WHO, 2001).
As far as technology, and the fruits in general of research and
10
"Parallel imports" involve the import and resale in a country, without the consent of the patent holder, of a patented product which was put on the market of the exporting country by the patent holder, or, in another legitimate manner. "Compulsory licensing" enables a government to license to a company, government agency, or other party, the right to use a patent without the title holder's consent. In certain circumstances, both "escape" modalities are permitted by the WTO TRIPs Agreement. For more details see, Correa, 2000.
development, globalization has not made much of a difference, at least so far, to the developing countries. Although some of them have attained technological capabilities in certain fields, these are: i) limited as far as the sectors, ii) generally to be found among the semi-industrialized, or relatively more developed among these countries, and, iii) moreover, not the results of recent globalization, but rather of long term human capital formation and technological learning accumulated during decades of industrial development11.
R&D efforts and results are still overwhelmingly concentrated among the industrialized countries. According to UNDP, 1999 (with data from the WIPO and UNESCO), in 1993, only 10 of those countries were responsible for 84% of world R&D expenditures, obtained 95% of US registered patents in the last 20 years, and were paid more than 90% of all cross border royalties and licensing fees. As further indication of the extent of concentration in this area, in 1995, more than half total world royalties and licensing fees were paid to the United States by other industrialized countries, primarily: Japan, the UK, France, Germany and The Netherlands12. As for the developing countries, of those patents granted to them, more than 80% were obtained by non-residents, i.e. residents of the industrialized countries.
11
To mind come, for example: the success of Brazil, India, and South Africa, in replicating and mass-producing, at low cost, most patented drugs required for AIDS treatment; Korea's worldwide preeminence in steel exports; Argentina's mastery of nuclear engineering which has led to exports of its technology even to industrialized countries; and the success of Embraer, a Brazilian company, in the export market for smaller size jet-airplanes.
12
It has been estimated that about 70% of world royalties and licensing fees were paid within TNCs.
The present distribution of research expenditures not only has short term negative implications for the developing countries in terms of the loss of possible static, or direct, benefits (quasi-rents) of potential innovations and patents; it is also detrimental for the long term, as it affects the potential for development (and income convergence between developed and developing countries) due to the loss in non-researching countries of the cumulative effects of external economies and learning of such investments13.
III. Main "Disconnects" Between Theory and Practice
At first glance there seem to be two main potential "disconnects", (i.e. causes for discontent), with increased globalization. First, as foreseen by Heckscher-Ohlin, in countries which are labor scarce (such as the industrialized countries), unskilled labor is bound to be the losing party when international trade is on the rise, and also when production is relocated abroad to cheaper sources of supply for labor and intermediates. Second, the nation state is clearly affected in various ways by the increased power of markets. Its abilities to control, regulate and tax, are weakened when it has to submit to international competition and outside determined rules of the game. Moreover, such rules are increasingly imposed, or made a condition for participation in international markets, by international entities without a direct political mandate from citizens in the affected countries.
When the intrusive role of international market forces upon the nation state is referred to, is it meant to say that nations feel subjugated because
13
of increased power or penetration by TNCs? Not likely. The peak of the impact (at least on public opinion) of TNCs was probably in the 1960s and early 1970s, when concerns of the developing countries led to the creation of a United Nations Centre for the Study of Transnational Corporations (its functions now absorbed by UNCTAD), while Europeans complained about a gap in technology and private investment, vis a vis US larger enterprises. Europeans may still complain presently about a "venture capital" gap, but investments by such enterprises are by and large now considered to be the most beneficial form of capital inflows. Moreover, the presence of multinational corporations in world markets is not presently restricted to those of one nation. Indeed, some of the largest are now European or Asian, and even some developing countries sport their own TNCs.
Does the reference then apply to international lending organizations? Although they may try to intervene more than ever before to assist in the handling of individual country economic problems, the trend seems to be against an increase in their power. The World Bank and the IMF are both suffering from serious image and political problems. First, as a result of their loss in relative importance vis a vis private flows of capital, and second due to their perceived ineffectiveness in attaining the objectives that they have recently adopted for themselves. The former in trying to eradicate world poverty, and the latter in being recognized as the world's lender of last resort14.
14
It should be mentioned, that the IMF has recently also succumbed to the temptation to add the eradication of poverty in developing countries to its macroeconomic policy advisory role (Fisher, 2001).
As to the World Trade Organization (WTO), while it enjoys much more enforcement power than its antecessor, the GATT, as shown by various findings against the EU and the USA, the main trading groups can still ignore its judgments with relative impunity. Also, most trade rules are initially relaxed for a considerable amount of time before being fully applied to the poorer developing countries. Moreover, the organization recognizes that "significant trade barriers remain, including in areas of particular interest to developing countries such as agriculture, and textiles"( WTO, Press Release 222).
It must also be noted that in the last decades substantial conflicts of "sub-national" or "intra-national" power have erupted, in the form of ethnic and religious strife, leading to serious attempts at redoing national boundaries. Moreover, in more than one case, international interventions have avoided, or mitigated, the most deleterious effects of such nation state threatening internal developments.
The positive role of international public opinion and international law in curbing the excesses of ethnic conflicts and human rights violations, by supporting cross border interventions, must be recognized. Although such interventions definitely represent intrusions on national sovereignty, a majority would probably consider them a step in the direction of greater justice and fairness15. Clearly, advocates of "national sovereignty" at all
15
The experience of countries passing from authoritarian to more democratic political regimes in framing a judicial response to the dilemma between punishment for past crimes, and reconciliation to attain political stability, is articulated in Teitel, R., 2000.
costs, may have a hard time defending their positions when benevolent judicial intervention across borders results, for example, in the indictment or imprisonment of such abject violators of human rights as Pinochet or Milosevic.
But, as stated before, we must concentrate on the economic sphere where, as the evidence has shown, substantial changes, particularly in the international trade and international finance fields, have taken place.
A. International Trade
Lay people experience perception and comprehension problems when confronted with the evaluation of decisions and policies about market liberalization and freer international trade. These problems arise, in part, from failures by the economics profession, and the specialized (economic and financial) media, to explain what is really at stake in the liberalization process. More specifically, what are the theoretical pros and cons, the potential winners and losers, and particularly, how to compensate the latter (Rodrik, 1997 and 1998).
Economic theory shows (within the boundaries of specific assumptions) that there are net overall welfare gains in achieving free international trade and that such gains are large enough to make everybody better off, or, at least, not worse off than before liberalization. Thus compensation for those injured can be provided out of the total benefits accrued from trade gains. However, economists have traditionally been remiss in providing clear explanations about the gains and the compensation possibilities to lay
audiences, and also not quite forthcoming in suggesting policy measures to quickly and fairly compensate losers by means of direct transfer payments and specific subsidies for relocation and retraining.
More recently, with the increased application of game theory to economic analysis, and the popularity of strategic considerations in explaining trade among advanced countries in certain industries, comparative advantage and the net welfare gains that may accrue from specialization under free international trade have been overshadowed by considerations about the ability to shift profits by gaining advantages from economies of scale and technical innovations.
It should also be noted, that there is really no such thing as totally free international trade. Even after substantial reductions in industrial tariffs, quantitative and other restrictions remain in agriculture and labor intensive industrial products16. Lower level equilibria such as attained via formal regional economic integration (examples are NAFTA, the European Common Market, and Mercosur in South America), or various other forms of preferential trading agreements, (PTAs) while permitted within WTO, may divert trade by discriminating against more efficient outside producers. Thus they are far from optimal, and may/or may not, be second best in welfare economics theory terms. There is no clear, unified theoretical response, (i.e covering all possible types of arrangements) to the question whether such arrangements lead
16
Two clear and critical examples are the EU's protectionist Community Agricultural Policy (CAP), and the Multi-Fiber Agreement (MFA) to restrict textile imports from developing countries.
to further multilateral trade liberalization or constitute obstacles in that direction. The empirical evidence is also not yet sufficiently unambiguous17.
The economics profession, and the specialized media, have been quite ineffectual in informing about the above questions and providing unbiased editorial help in clarifying political decisions on key trade related issues. A good (actually bad) example of how discussion of free trade issues gets distorted in the USA is in the demands by some unions and industry representatives, as well as members in Congress, for special environmental regulations and labor standards to be added to trade agreements18.
As seen by a number of developing countries affected, the inclusion of environmental regulations, or an insistence that they comply with their own labor standards, make little or no sense, but will result in negatively affecting their comparative advantage, which as they argue, and Bhagwati, 2000, agrees to, is the real reason for the pressure to impose such rules and not any idealistic desire to improve the lot of workers in other countries, or to clean up their air and water. The posited rationale of achieving a "level playing field" is reminiscent of the arguments advanced by those favoring in the past the imposition of a "scientific" tariff computed to levy an amount high enough to compensate for existing cost differences with imported
17
See Krueger, 1999 for a review of the issues. Ethier, 1998, sees preferential trading agreements (PTAs) as a step in the right direction of facilitating further multilateral free trade, while Bhagwati, 1995, is of the opposite persuasion.
18
See Bagwell and Steiger, 2001, for a proposal about how to include labor and environmental issues within the framework of WTO trade negotiations.
products, denying in this way all potential benefits from comparative advantage to the importing country.
Some of the main disputes within the WTO are among industrialized countries that while preaching free trade, fight among themselves, for example, because of preferences on banana imports (which neither the EU nor the USA produces) granted to support their respective TNCs importing this tropical fruit from Africa, Caribbean countries or Central America. Other instances are the use of anti-dumping laws to keep cheaper steel imports from such countries as Brazil and Korea, or Canadian lumber, out of the USA.
The mere mention of this kind of conflicts involving large and highly industrialized trade blocks, and countries, as well as the still prevailing protection afforded to European farmers by the EU Common Agricultural Policy, adds an almost surreal atmosphere to discussions about "free" international trade. In other areas of intense confrontation among developing and developed countries, such as the universal application of laws governing intellectual property rights, significant changes to the adopted regulations might be required, for example, to deal with AIDS epidemic situations in developing countries, given the ability of local pharmaceutical companies in countries such as India, Brazil and South Africa to produce generic versions of medicines needed to fight AIDS that cost only a fraction of the patented versions19.
19
It is interesting to note that while the confrontation with the major pharmaceutical companies about lowering prices for patented AIDS treatment drugs was going on, the government of Brazil announced, with large paid ads in major USA newspapers, that it was providing, through its national health system, free of charge treatment (including drugs provision) to all AIDS
B. International Finance
As noted, drastic changes have taken place, if not in the direction, certainly in the level and composition of capital flows across countries. The relative decline of loans and the recent surge in portfolio investment are particularly noteworthy.
The large literature on FDI has stressed both positive and negative aspects of such investments from the point of view of the developing countries. FDI generally comes in the form of capital goods, implanted for productive or infrastructure activities, which are not mobile by their very nature. Thus it entails investments that are usually long term in nature20. Moreover, foreign investors in productive plants generally also bring with them the technical know-how to operate the equipment, as well as marketing and managerial skills which are imparted to the local environment. As shown in section IIB2, there have been recent changes in the size and destination of FDI flows which tend to be associated with increased globalization of the world economy. In particular, some increase in the share of such investments going to developing countries, albeit to the relatively more developed among them.
patients applying for help.
20
Acquisitions of existing firms or plants as part of privatization programs are of a different type, and may involve, at least initially, just a change in ownership. In some cases, the agreements included the assumption of existing debts as well as investment programs for future modernization of existing facilities.
But it is in portfolio investment that the most important changes have taken place (see section IIB2). By their very nature, portfolio investments, not necessarily limited to stock shares but also including bonds and other debt obligations, are more liquid in nature and with shorter average maturity than FDI.
Wall Street has been marketing stock shares and bonds from developing countries with the tantalizing label of "emerging" markets securities. In its business section, The Washington Post now regularly publishes a table with data from 12 stock markets, of which six are in developing countries: Argentina, Brazil, Mexico, Hong Kong, Singapore and South Korea. Although measured by capitalization and volume of shares traded these markets are minuscule when compared to the major stock markets in the USA, Britain or Japan, they nevertheless represent a new phenomenon. In spite of the foreseeable surrounding uncertainties, Wall Street has succeeded in convincing many investors, ranging from pension funds to private individuals, that a well-balanced portfolio should include a share of "emerging" markets stocks and bonds.
The rewards from some of these investment instruments seem to be so high as to compensate for the risk, and not even sovereign defaults seem now to matter for very long. See Table 17 with recent returns for a number of bonds issued in "emerging markets".
(percent)
Issuing Country Return
Argentina -52.0 Brazil 4.1 Ecuador1/ 24.2 Mexico 12.1 Peru 22.2 Philippines 19.1 Mexico 12.1 Russia2/ 46.4
Notes: 1/ Ecuador defaulted on its debt on 1999. 2/ Russia defaulted on local bank debt in 1998.
Source: International Herald Tribune, November 27, 2001, p.15, quoting J.P. Morgan emerging markets bond index data.
Finally, in recent years, following capital accounts liberalization, private banks have been quite active in developing countries pushing their loans which generate higher returns than in their more traditional markets, given existing differences in country risk. But as shown in section IIB2, nothing comparable to the levels attained following the oil-shocks. Actually, loans is the component of capital flows that has increased the least, having in fact shrunk when measured in real terms. Such lending has generally also moved out from markets falling in disfavor.
Portfolio investment and bank lending are particularly sensible to local changes in interest rates and the exchange rate; key variables responsible for them coming to these markets in the first place. Thus it is not surprising that these flows might be de-stabilizing to countries recently embarked in liberalizing their capital account. Sudden outflows may lead to substantial
reversals in the flow of capital and there have been a number of such episodes affecting developing countries in recent years. As Table 18 below indicates, some of these reversals were of quite large magnitude when measured as a proportion of GDP.
Table 18. Selected Reversals in Net Private Capital Flows to Developing Countries. (percent of GDP)
Country Date Flow Reversal
Argentina 1982-83 20.0 Argentina 1993-94 4.0 Mexico 1981-83 12.0 Mexico 1993-95 6.0 Thailand 1996-98 26.0 Venezuela 1992-94 9.0
Source: Reinhart, 1999, Table 1.
Unrestricted capital mobility, coupled with the use of political pressure at the national and international level, to enforce it21, has been blamed as a major culprit of the financial crises of recent years22.
21
Bhagwati even refers to a purported IMF-USA Treasury conspiracy to press for capital account convertibility to satisfy Wall Street lobbying. See, Bhagwati, 2000.
22
Origin Date
Latin America, Southern Cone 1979-81 Debt crisis, devel. countries 1982
Mexico 1994-95
East Asia 1997-98
Russia 1998
Brazil 1999
Europe (ERM) 1992 Source: Eatwell and Taylor, p.5
In judging the stability of the new financial order, i.e. with unrestricted capital mobility, it is worth noticing the number of major financial crises, originating in developing as well as advanced countries, recently experienced by the system. See Table 19.
Obtsfeld, 1998 argues that excessive reliance on non-equity flows was really responsible. Rogoff, 1999, shares this view23. Mishkin, 1999, attributes the volatility to problems of adverse selection arising as a result of the existence of asymmetric information between borrower and lender, and moral hazard due to the presumption by lenders that their loans are in fact insured by the governments of their borrowers24.
23
It should be noted, that due to its relative liquidity, portfolio investment, which constitutes equity investment, may also exhibit volatile behavior and thus become a contributing factor to financial crises.
24
The implicit guarantors could also be lenders of last resort supporting the government, such as the IMF acting with its own resources, or in cases where larger sums are involved, with the cooperation of the G-7 group of industrialized countries.
In examining the evidence on the direction of capital flows, Obtsfeld, 1998, notes that a large majority of capital flows take place among the main industrialized countries, and as concerns developing countries, some 10 of the relatively better off countries in Latin America and Asia, absorb the vast majority of the flows not going to developed economies. Since economic theory predicts that capital should flow to where it is scarcer relative to labor, which would imply the poorer developing countries, Lucas, 1990, raised the obvious question about what explains the above paradoxical results, i.e. capital not really flowing to places where it would command the highest returns. The answer is not surprising: capital, as any factor of production, only provides high productivity returns when it operates with the necessary complement of other factors. Capital continues flowing largely to highly developed environments (USA, Japan, Europe), because there it encounters the skills, infrastructure, and institutional arrangements that complement its contribution.
As mentioned, capital flows are not homogeneous and the absorption of the various kinds available, FDI, portfolio investment, and loans, has different implications for economic growth and macroeconomic policy. While as noted above, FDI tends to stay much longer due to the inherent restrictions in mobility of capital equipment ("machines are bolted" as the saying goes), portfolio investment and loans may remain only for the short-run due to considerations about interest rates and exchange rates which may change rapidly and lead to considerable volatility.
analysts have noted the policy dilemma that characterizes economies with fixed, or strongly pegged, rates of exchange, when opened to unrestricted capital flows. These countries loose the ability to use domestic monetary policy to alleviate declines in output and employment. This has been called the "open economy trilemma", i.e. the choices forced upon the economy when the flexibility of one basic price, such as the rate of exchange, is lost. Quoting Obstfeld, 1998, pp. 14-15:
"... A country cannot simultaneously maintain fixed exchange rates and an open capital market while pursuing monetary policy oriented toward domestic goals. Governments may choose only two of the above. If monetary policy is geared toward domestic consider-
ations, either capital mobility or the exchange rate must go. If fixed exchange rates and integration into the global capital market are the primary desiderata,
monetary policy must be subjugated to those ends."
It is to be further noticed, that while all industrially advanced countries since the collapse of the Bretton Woods agreement in the early 1970s tend to have flexible exchange rates, developing countries are often advised to keep theirs fixed, or pegged to a stronger currency. With capital mobility this restricts substantially their economic policy options25.
25
Although Argentina's policy choices were mostly self-inflicted, the country exemplifies the latter case considered by Obstfeld. Its recent governments value highly the maintenance of a fixed exchange rate and integration into the global capital market and consequently cannot use monetary policy for domestic purposes. They could use fiscal policy instead, in theory, to reactivate the economy which is in a deep recession due to a severely overvalued domestic currency, but following IMF's requirements to continue its financial support, it is perversely cutting government expenses and increasing taxes to lower the fiscal deficit, i.e. for adjustment, and not for reactivation purposes.
In a provocative study, Rodrik, 1997, tries to show with the use of time series and cross section data that government transfer payments provide a social cushion to the risk arising from increased exposure to international trade. He sustains that more open economies have larger government expenditures in part to compensate for the added risk due to openness. With increased openness to capital it becomes difficult to tax capital and the tax burden shifts from capital to labor. The increased risk due to capital mobility represents a negative externality on immobile factors. He claims that his empirical results support the following propositions: a) globalization reduces the government's ability to spend resources in social programs, b) open capital markets make it more difficult to tax capital, and c) labor then carries a growing share of the tax burden.
If proven valid, these results bring out a tension between the need for increased adjustment assistance and social insurance expenditures to make further globalization politically acceptable, and counteracting fiscal constraints that seem to be intrinsic to the globalization process itself. Unless, as suggested by Bhagwati (1998), we were to distinguish between the liberalization of trade and that of the capital account, and to adopt a more circumspect attitude vis a vis the timing and composition of capital liberalization.
IV. What Should be Done?
Selected policies and other measures that could be taken to improve the situation exposed, particularly as it refers to international trade and international finance, are presented below.
A. International Trade
Prospects for trade liberalization have improved recently with the agreement reached at the WTO Doha (Qatar) recent meeting about launching a new round of trade negotiations. Specially, because of the acceptance by the EU to discuss its agricultural policy with a view to a reduction in their subsidies, and by the USA to put its anti-dumping rules on the negotiating table. Also potentially advantageous for the developing countries are the prospects of further liberalization in the markets of textiles and other labor intensive products.
The USA is a key player in these negotiations and there is some concern about whether the executive branch will receive authorization by Congress, to negotiate trade agreements without having them to be approved in detail by Congress which would then only have the chance to vote yes or no on the total agreement reached. This is the so-called Trade Promotion Authority (TPA), previously known as "fast track authority". Its granting is very important because major negotiating parties, such as the EU for example, will be very reluctant to make concessions to USA executive branch representatives as part of agreements that could then be nullified by a vote of Congress.
The areas of contention that remain include, in addition to the above, the insistence on tying environmental regulations and labor standards to the negotiations of trade agreements within the WTO. Those do not belong in there and can be discussed in other multilateral fora26.
26
The need to adequately compensate "losers" of trade liberalization needs to be considered at all pertinent levels: individual workers, affected industries, and distressed localities. The gains from trade accruing to consumers plus the more efficient allocation of resources accruing to producers and the economy, should be used in part, to deal also with the impact of "dying" industries and the disappearance of skill or industry-specific jobs.
When as a result of tariff reduction negotiations, jobs are lost, for example in apparel (a labor intensive sector in which other, mostly developing, countries have the comparative advantage), the fact that new jobs will be created in the aircraft industry (in which the US has a strong comparative advantage) is of little help. Most of the aircraft industry is located on the West Coast of the US, while most of the apparel industry is on the East Cost. There are clear obstacles to the geographic and occupational mobility of labor. Jobs differ in their skill content and even when workers have the new required skills they can often not move from job to job without also moving from place to place. Moving is expensive, and workers may lose seniority and other benefits. Most workers want to stay where they are and not to be uprooted from family, neighbors and friends27.
problems. Moreover, specific issues affecting the environment have been dealt already in a multilateral context and resulted in international pacts such as the Kyoto and Montreal agreements. The International Labor Organization (ILO), which has a tripartite governing body (labor, business, and government), could deal with arising labor questions. Fortunately, in the Doha agreement about new trade negotiations the USA representative did not press to include the labor standards issue in the agenda.