(CCAA) Study
DESCRIPTION OF METHODOLOGY AND
PRESENTATION OF TEMPLATES FOR VALUE
CHAIN ANALYSIS
PART 1: NARRATIVE TEXT
John C. Keyser
Consultant
July 2006
Disclaimer:
This background report is being made available to communicate the results of Bank-funded work to the development community with the least possible delay. The manuscript therefore has not been prepared in accordance with the procedures appropriate to formally edited texts. Some sources cited in this report may be informal documents that are not readily available.
The findings and interpretations expressed in this report are those of the author(s) and do not necessarily reflect the views of the Board of Executive Directors of the World Bank or the governments they represent, or those of the Food and Agriculture Organization of the United Nations (FAO).
The World Bank and FAO do not guarantee the accuracy of the data included in this work. The designations employed and the presentation of the material in this work, including the boundaries, colors, denominations, and other information shown on any map do not imply any judgment on the part of the World Bank or FAO concerning the legal status of any territory or the endorsement or acceptance of such boundaries.
LIST OF ABBREVIATIONS
CCAA Competitive Commercial Agriculture in Africa
CF Conversion factor
cif Cargo, insurance and freight DLV Domestic landed value DRC Domestic resource cost ratio DVA Domestic value added DVF Domestic value at frontier ECF Emergent commercial farmer EPC Effective protection coefficient FAM Family farmer
fob Free on board
Forex Foreign exchange LCF Large commercial farmer LCU Local currency unit
NPC Nominal protection coefficient O&M Operation and maintenance PAM Policy analysis matrix R&M Repairs and maintenance
SV Shipment value
TLV Total landed value USD United States Dollar VDP Value for duty purposes
ZAR South Africa Rand
MAJOR DEFINITIONS
Domestic Value Added (DVA) = Domestic costs and mark-ups
+ Official duties and tax
+ Unofficial charges & extra costs
Shipment Value (SV) = Domestic value added
+ Foreign components
PRODUCT STAGES
1. Farm production = Farm gate product
2. Assembly = Assembled raw material
3. Processing = Processed raw material
COLOR CODING IN EXCEL TEMPLATES
Orange cells are for text
Green cells are for numbers
Blue cells are for data drawn from a previous stage in the analysis
Yellow cells highlight key results and other important information
Grey (or black) cells are placeholders for assumptions that do not normally change White cells contain formulas and should not be altered
CCAA CURRENCY DESIGNATIONS (Approximate financial exchange rates as of July 1, 2006)
Brazil Real (BRL) USD 1.00 = BRL = 2.20 BRL 5.00 = USD 2.27 Mozambique Metical (MZM) USD 1.00 = MZM 25,800 MZM 50,000 = USD 1.93 Nigeria Naira (NGN) USD 1.00 = NGN 128 NGN 500 = USD 3.91 Thailand Baht (THB) USD 1.00 = THB 38.10 THB 100.00 = USD 2.62 Zambia Kwacha (ZMK) USD 1.00 = ZMK 3,450 ZMK 10,000 = USD 2.89
WEIGHTS AND MEASURES 1 hectare (ha) = 2.417 acres (ac) 1 kilogram (kg) = 2.204 pounds (lbs) 1,000 kilograms (kgs) = 1 metric ton (MT)
1 kilometer (km) = 0.62 miles
Any questions or comments on the methodology are very welcome by writing to the author at Box 35220, Lusaka, Zambia or by email to [email protected]. Special arrangements have been made during the CCAA study to provide operational guidance for each participating country teams. Please do not hesitate to send your questions and feedback.
PART 1 – NARRATIVE TEXT
TABLE OF CONTENTS
I. INTRODUCTION... 1
A. Objectives... 1
B. Approach and Limitations ... 2
II. CONCEPTS AND DEFINITIONS... 4
A. Stages of the Value Chain ... 4
B. Price Components... 6
C. Price Decomposition ... 8
D. Summary of Cost Categories... 9
E. Financial Costs and Profitability ... 11
F. Time Requirements... 12
G. Policy Analysis Matrix... 13
H. Enterprise Variations... 15
III. WORKING WITH THE TEMPLATES... 15
A. Organization of Books ... 15
B. Conventions of Workbook Design and Use ... 16
C. Build-up of Value Chain Indicators from Stage to Stage. ... 20
IV. DESCRIPTION OF WORKBOOKS ... 26
A. Country Data and Summaries (Book 1) ... 26
B. Input Analysis (Book 2) ... 27
C. Enterprise Budget Analysis (Books 3, 4, 5, 6) ... 29
D. Policy Analysis Matrix (Book 7) ... 29
V. CONCLUSIONS AND NEXT STEPS ... 29
Annex 1: Partial List of Data Requirements ... 31
Annex 2: Derivation of Capital Recovery Costs... 32
PART 2 – SPREADSHEET TEMPLATES
The spreadsheet templates designed for CCAA value chain analysis are presented in seven separate Excel Workbooks as follows. One set of templates designated “sample” is provided with dummy data to show how the spreadsheets work. A blank set of templates to be used by each CCAA country team is also provided.
LIST OF SPREADSHEET PAGES
Book 1 - Country Data and Summaries
1.1 Country Data 1.2 Commodity Prices 1.3 Input Indicators 1.4 Farm Indicators 1.5 Assembly Indicators 1.6 Processing Indicators 1.7 Logistics Indicators 1.8 Final Crop Summary
Book 2 – Input costs
2.1 Imports build-up 2.2 Imports break-down 2.3 Domestic build-up 2.4 Domestic break-down 2.5 Simple SFs from SV 2.6 Investment costs
Book 3 – Farm Production
3.1 Crop analysis 3.2 Crop budget Book 4 – Assembly 4.1 Assembly analysis 4.2 Assembly budget Book 5 – Processing 5.1 Processing analysis 5.2 Processing budget
Book 6 – International Logistics
6.1 Logistics analysis – Product 1 6.2 Logistics analysis – Product 2 6.3 Logistics analysis – Product 3 6.4 Logistics budget – Product 1 6.5 Logistics budget – Product 2 6.6 Logistics budget – Product 3
Book 7 – Policy Analysis Matrix
7.1 PAM template 7.2 Parity price examples
COMPETITIVE COMMERCIAL AGRICULTURE IN AFRICA (CCAA)
DEFINITION OF METHODOLOGY AND
PRESENTATION OF TEMPLATES FOR VALUE CHAIN ANALYSIS
I. INTRODUCTION
1. This paper describes the methodology for quantitative value chain analysis under the Competitive Commercial Agriculture in Africa (CCAA) study. The primary objective of the CCAA study is to explore the feasibility of restoring competitiveness and growth in selected African countries by identifying key commodities, production systems, and marketing arrangements that are capable of underpinning rapid development of commercial agriculture. Competitiveness will be analyzed using primarily value chain analysis. The CCAA study is concerned with (1) qualitative features of the value chains for the selected commodities and products, including the policy, institutional, and organizational factors that affect costs and shape relationships among the various actors, and (2) quantitative information about selected value chains, in particular financial costs and time requirements. The methodology described in this paper has been designed to collect the quantitative information for selected “candidate commodities” at critical stages in the value chain beginning with input supply, through to farm production, assembly, processing, and international logistics. A set of original templates in seven interlinked Excel workbooks has been prepared to facilitate this analysis. Observations and results from this quantitative analysis must be couched within an analysis of the qualitative factors that affect the results.1
2. In Africa, the CCAA study will cover Mozambique, Nigeria, and Zambia. The analysis will focus on seven basic commodities plus a few additional commodities in each country thought to offer good potential for commercial development. The seven basic CCAA commodities are cassava, cattle, cotton, maize, rice, soybeans, and sugar. To establish international benchmarks of successful development, a parallel analysis of value chain performance will also be carried out in Brazil and Thailand. These assessments will allow production costs and other aspects of value chain performance in Africa to be compared on a global scale to help determine where the best opportunities for rapid growth in each target country can most likely be found. The analysis will cover three farm sectors in each country.
3. In addition to quantitative methods, the analysis in all countries will include a qualitative assessment of major policies, institutional, and organizational factors that affect costs and shape trading relations. The analytical approach described in this paper, therefore, represents just one part of the larger CCAA methodology. Further details on the major objectives and design features of the CCAA work are set out in the Summary Project Proposal prepared by World Bank staff.
A. Objectives
4. Within this context, the main objectives of the current paper are to:
• Describe essential value chain concepts and provide a standard methodology for quantitative analysis;
1
For guidance on the qualitative analysis, country teams should refer to Annex 7 of Summary Project Proposal; particularly, but not exclusively, to pg. 7-15 to 7-17.
• Introduce a set of Excel spreadsheet templates developed specifically for the CCAA study; and
• Provide practical instructions for CCAA country teams to follow in working with the Excel templates.
5. To achieve these objectives, the paper is organized in five sections, of which the first is the current introduction. Section II provides an overview of major value chain concepts and definitions used for the quantitative analysis; Section III provides general instructions on how to work with the spreadsheet templates; and Section IV looks in detail at the specific function of individual workbooks and template pages. The paper concludes in Section IV with a few remarks on interpreting the quantitative results and future uses of the value chain templates.
B. Approach and Limitations
6. Broadly defined, quantitative value chain analysis is focused on the amount of money a customer is willing to pay for a firm’s output. In an open economy, this price is determined competitively and flows upstream from the consumer to each producer and marketing company involved in the growing, collection, transformation, and delivery of that commodity to its terminal market. Supply chain analysis is a complementary concept applied to a network of companies across a given industry. Whereas value chain analysis looks at the upstream accumulation of value as a determinant of international competitiveness, supply chain analysis is a downstream concept that looks at the flow of goods from the supplier to consumer. Both concepts are concerned with the organization of value adding activities while competing in a particular industry, but the key analytical distinction comes in the flow of value between the supplier and consumer.
7. Value chain and supply chain analysis are also concerned with product differentiation and timeliness of delivery. These factors are major determinants of a commodity’s final market price and total value that can be divided between participants in the production and marketing system. Seasonality is an especially important factor in agriculture since the prices of most farm commodities are cyclical depending on world production and patterns in consumer demand. Quality differences are likewise an important source of competitive advantage as is the ability of a country to supply guaranteed minimum quantities according to a specific time schedule. Interpretation of the quantitative value chain indicators, therefore, requires knowledge of conditions in other countries in order to pick the most relevant price with which to compare local production.
8. From these essential concepts, quantitative value chain analysis quickly becomes a multidimensional task that requires careful attention to a great many details and individual product differences. Towards this end, the quantitative methodology focuses on the measurement of accumulated production costs, private financial returns, and time requirements at each stage of the value chain. The Excel workbooks have been designed to calculate standard indicators for each of these aspects of value chain performance so that the results for different commodities, farm systems, and countries can be compared as equally as possible. These measurements of cost components, private profitability, and time requirements are drawn from standard per hectare or per ton budgets for farm production, crop assembly, industrial processing, and logistics to the final delivery point that each CCAA country team will need to prepare. Where important differences exist, either between farm sectors or by processing technique and product quality, additional workbooks will need to be filled in so that the results for each enterprise variation can be compared. The templates are designed to handle both export commodities and import substitutes.
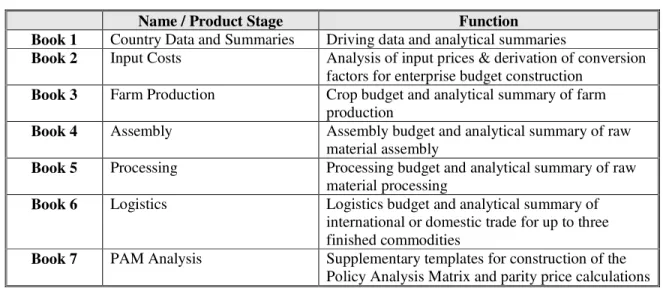
9. A list of the Excel workbooks developed for the CCAA study is given in Table 1. The workbooks are organized in a logical sequence that roughly follows the major stages of the commodity value chain.
Table 1: List of Excel Workbooks
Name / Product Stage Function
Book 1 Country Data and Summaries Driving data and analytical summaries
Book 2 Input Costs Analysis of input prices & derivation of conversion
factors for enterprise budget construction
Book 3 Farm Production Crop budget and analytical summary of farm
production
Book 4 Assembly Assembly budget and analytical summary of raw
material assembly
Book 5 Processing Processing budget and analytical summary of raw
material processing
Book 6 Logistics Logistics budget and analytical summary of
international or domestic trade for up to three finished commodities
Book 7 PAM Analysis Supplementary templates for construction of the
Policy Analysis Matrix and parity price calculations 10. Further details on the specific function and use of each book are provided in the discussion that follows. Before proceeding, however, it is useful to note some of the limitations of quantitative analysis.
11. First, because agriculture practices vary widely between individual value chain participants, the spreadsheet templates are best used to generate indicative results only. Country analysts must strive to ensure that the production budgets reflect realistic conditions to the greatest extent possible, but even the best constructed models are unlikely to provide a definitive picture of all costs and returns. Specific levels of input use, actual yields, production outturns, and overhead costs can all vary greatly from one participant to another and the models are best used to provide a general picture of value chain processes only. By extension, this means the models alone cannot be used to identify optimal development strategies. Profitability, risk, operating costs, and investment requirements are critical to value chain performance, but only tell part of the story. Many other demand-side factors, including regional market conditions, price trends, seasonality, and consumer preferences all need to be considered in deciding which enterprises to promote and how best to allocate scarce investment resources.
12. It should also be stressed at the outset that the results for one country can only be compared with those from another country in a limited sense. While the spreadsheet templates are designed to produce a standard set of indicators, any number of seemingly minor differences in how one country team values specific production factors can have an important bearing on the final results. Rather than strive for the exacting levels of detail and consistency between countries, the best approach is to aim for a general picture of international competitiveness and relative cost levels only. In practice, this makes the analyst’s task much easier since there will be times when data limitations mean that a “best guess” of some budget coefficient has to be used instead of an exact figure. This is entirely consistent with the indicative nature of the spreadsheet analysis, but must be kept in mind when interpreting the results.
13. Finally, it should be emphasized that the spreadsheet templates are a new creation and have not yet been tested in a fully operational sense. Great care has gone to produce a set of templates that are logical and transparent. As a new approach, however, lessons also need to be drawn from the experience of working with the materials so that the spreadsheet templates can be further refined and developed. Analysts will need to use their own discretion when working with the methodology and should not feel locked into a rigid process.
II. CONCEPTS AND DEFINITIONS
14. Before describing how to use each of the seven Excel workbooks, it is important to review some basic value chain concepts and definitions. Notwithstanding the methodological limitations noted above, it is important that all country teams begin with a common understanding of the analytical process in order to produce the best data set possible.
A. Stages of the Value Chain
15. Value chain analysis has gained considerable popularity in recent years. Although many approaches are taken, value chains essentially represent enterprises in which different producers and marketing companies work within their respective businesses to pursue one or more end-markets. Value chain participants sometimes cooperate to improve the overall competitiveness of the final product, but may also be completely unaware of the linkages between their operation and other upstream or downstream participants. Value chains therefore encompass all of the factors of production including land, labor, capital, technology, and inputs as well as all economic activities including input supply, production, transformation, handling, transport, marketing, and distribution necessary to create, sell, and deliver a product to a certain destination.
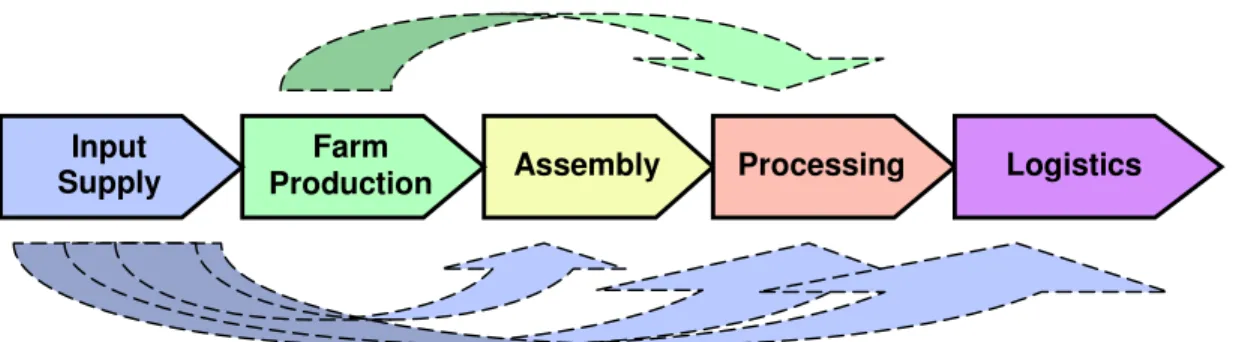
16. The main stages of an agricultural value chain as defined for the quantitative methodology are illustrated in the figure below. In this diagram, dashed arrows flow from input supply to all other stages to show that this is a crosscutting function that affects all participants, not just at the farm level. A dashed arrow is also drawn from farm production to processing to show that some farmers may deliver their crop directly to a factory, thereby fulfilling the assembly function as well. This can either happen as part of a vertically integrated supply chain managed by a large company or because the scale or proximity of an individual’s production to the factory justifies direct delivery.
Figure 1: Stages of the Value Chain
17. It is useful to review some of the main activities that occur at each stage of the value chain. These include the following.
• Input supply. This stage is concerned with the sourcing of raw materials required
for agriculture production, processing, and trade. Inputs may either be procured locally or imported. The final value of an input at its place of use includes all manufacturing costs, transportation costs, customs duty and tax, and unofficial payments incurred up to that point. The efficiency of a country’s input supply system therefore has a major bearing on the performance of the entire value chain.
• Farm production. This stage is concerned with primary agriculture production
and ends with the sale of a raw commodity at the farm gate. These transactions may occur literally at the farm gate or at some other point where the farmer hands over ownership of the product to the next value chain participant. Depending on
Assembly Processing
Farm
Production Logistics
Input Supply
the crop, some type of primary processing (such as the shelling or bagging of dry grain) may take place at the farm level.
• Assembly. This stage involves the collection of agricultural produce from many
farmers and delivery of the raw material to a factory for industrial processing or packaging. In the case of livestock operations, assembly is defined in a broader sense to include the feedlot process for delivery of fattened animals to an abattoir. Bagging and simple grading of crops can also occur at this stage depending on arrangements made at the first point of sale.
• Processing. The processing stage involves the transformation of agriculture raw
materials into one or more finished internationally traded goods. Raw commodities, of course, are also traded and this stage may not apply to every crop. The spreadsheet templates have been designed to accommodate the production of up to three goods from a single raw material.
• Domestic and international logistics. The logistics stage is concerned with the
delivery of traded commodities to their final market destination. This may either be a foreign market in the case of exports, or a local market for import substitutes. For import substitutes, the logistics stage ends at the domestic level, but the analysis is still concerned with the cost of importing a like product from the nearest or most competitive country.
18. Price build-up from stage to stage. In value chain analysis, all inputs and outputs carry
forward their inherited value from the previous stage. This point may seem obvious enough, but is important to stress in value chain analysis where the focus is on cost levels at different stages as a key determinant of international competitiveness. The competitiveness of Zambian soybeans as an import substitute, for example, depends on the efficiency of the input supply system, farm production, assembly, processing, and logistics costs up to the final domestic market. The accumulated value at the delivery point must then be compared with the cost of bringing similar quality soybeans into the country from the best alternative source By looking at the cost composition at each stage of the value chain and comparing these costs with world standards, value chain analysis not only shows if the country is internationally competitive, but also helps to identify key stages where costs can most effectively be reduced.
19. Product transformation. Throughout the value chain agriculture products take on many
different forms. In the most basic sense, this may simply be the difference between a recently harvested farm product with high moisture content and one that has been assembled in a warehouse and dried for several months. As described, most agriculture raw materials also undergo some type of industrial processing to produce one or more final traded commodities. This may involve any number of processes such as the milling of dried maize (to produce maize flour and maize bran), crushing or solvent extraction of soybeans (to produce soybean oil and soybean cake), or ginning of seed cotton (to produce lint and cottonseed). Again, this point on product transformation may seem obvious enough, but the fact that a single agriculture commodity can take on different forms at each stage of the value chain means that great care is needed to track the accumulated value across products in a consistent manner.
20. For this study, the approach taken is to use conversion ratiosas a simple tool for quantifying a product’s transformation. These ratios are applied at the assembly stage to allow for crop drying and product losses and at the processing stage to allow for the transformation of a single raw material into a maximum of three finished goods. By applying the correct ratios to any agriculture commodity, it is possible to work forward or backward within that commodity’s value chain to determine its equivalent value in a different form.
• For example: If an assembler must buy 1.1 MT of maize at the farm gate to remain with 1 MT to sell after six months of drying and product losses, the conversion ratio to assembled raw material would be 0.909 or 91% (1 ÷ 1.1 = 0.909). By simple arithmetic, it follows that one ton of assembled raw material, excluding collection and delivery costs, is equivalent to 1.1 MT of maize at the farm gate.
• Another example: If a ginnery expects to produce 410kg of lint for every ton of seed cotton delivered to its factory gate, the conversion ratio from assembled raw material to processed product would be 0.410 or 41% (410 ÷ 1,000 = 0.41). In a cotton value chain, this is called the “ginning outturn”. By simple arithmetic, it follows that one ton of processed lint includes all the value of 2.44 tons of assembled seed cotton at the factory gate.
21. Further instructions on the determination of individual conversion ratios required to complete the spreadsheet templates are provided as embedded comments in the Excel workbooks.
B. Price Components
22. In addition to looking at the build-up of total costs at each stage, quantitative value chain analysis is also interested in the type of costs incurred as a product accumulates its value. This helps to identify areas where new policies or process innovations could have the greatest impact on international competitiveness.
23. Because a country is only able to influence prices within its own borders, the analysis is particularly interested in the composition of domestic costs. These costs include legitimate local business expenses and mark-ups, official customs duties and taxes, and any number of unofficial payments that sometimes have to be made to facilitate a particular operation. A product’s total value at any given stage in the value chain, therefore, is equal to the sum of all domestic prices and imported cost components. For the CCAA study, these costs are measured in terms of Domestic Value Added
(DVA) and Shipment Value (SV), which constitute the main value chain indicators as follows.
Domestic Value Added (DVA) = Domestic costs and mark-ups [1]
+ Official duties and tax
+ Unofficial charges and extra costs
Shipment Value (SV) = Domestic Value Added [2]
+ Foreign components
24. DVA and SV are measured according to equations [1] and [2] respectively on a per ton basis at each stage of the value chain for the following products.
Farm production Farm gate product
Assembly Assembled raw material
Processing Processed raw material
International logistics Traded commodity (Product 1, 2, 3)
25. For cross-country CCAA comparisons, the final calculation of SV for each traded commodity is the most comprehensive measure of actual and potential competitiveness. For a given product or commodity produced in a specific country, international competitiveness is determined by comparing the SV at the final destination (sale point) with a benchmark. The benchmark will usually be the cost– insurance–freight (cif) reference price for the product or commodity at the specified destination.
26. By looking at the composition of SV, including the elements of DVA that contribute to this total figure, the country analyst can gain further insight where costs can most effectively be reduced. If some cost accounts for a very large share of total value, or is significantly higher than the international benchmark, then new policies or other investments focused on reducing this cost would likely be an effective strategy for improving trade competitiveness. Similarly, by looking at the build-up of SV (and DVA) from stage to stage, the analyst can gain insight to the competitiveness of individual participants. If farm production, for example, accounts for a disproportionately large share of final shipment value (either in absolute terms or compared with an international benchmark) then policy interventions or other investments focused on this stage of the supply chain may be required. 27. An example of how the spreadsheet templates measure DVA and SV is given in Table 2. As shown, the spreadsheet calculates each value chain indicator in local currency and US dollar terms on a per ton basis and by the percent contribution of each cost component to total DVA and SV. By comparing these indicators across stages of the value chain, the analysis provides considerable insight to the build-up of a commodity’s total value and international competitiveness. All prices in the DVA and SV calculations are expressed in observed financial terms.
Table 2: Sample Calculations of DVA and SV
ZMK per USD per % of % of
MT MT DVA SV
Domestic costs 173,872 52.69 35.3% 28.4% Duties and tax 284,805 86.30 57.8% 46.5% Additional expenses 34,208 10.37 6.9% 5.6%
Total DVA 492,885 149.36 100.0% 80.4%
Foreign costs 120,148 36.41 24.4% 19.6%
Total SV 613,033 185.77 124.4% 100.0%
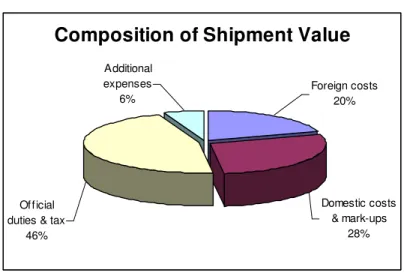
28. To assist with interpretation, the spreadsheets also produce a graphic illustration of the main value chain indicators as shown in Figure 2.
Figure 2: Graphic Representation of Main Value Chain Indicators
Composition of Shipment Value
Additional expenses
6%
Official duties & tax
46% Domestic costs & mark-ups 28% Foreign costs 20%
29. Interpretation of value chain indicators. Bearing in mind many other factors must be taken
into account in deciding which enterprises to promote and how best to allocate scarce investment resources, several conclusions could be drawn from these data. In the example above, the numbers show that duties and tax account for a very large share of total costs suggesting that a reduction in the
cumulative tax burden may be one of the most effective strategies for improving international competitiveness.
30. The measurements of DVA and SV may also be compared, both in an absolute and relative sense, with international benchmarks established by successful competitors. This is one of the main features of the CCAA value chain analysis and each country report will want to compare the financial values and percent build-up of DVA and SV with the most relevant import or export parity price against which the country must compete. If increased production substitutes for imports, then an import parity price should be used. Import parity prices are determined by first finding the price the country is most likely to pay in order to import the commodity and then by adding transportation costs to obtain the landed price in domestic cif terms. If increased production will be exported, then an export parity price is to be used, determined by subtracting international transport costs from the international price to give the domestic fob equivalent.
31. Depending on the stage of the value chain being analyzed, additional calculations to convert the parity price to a farm gate, assembly point, or into factory processing-level equivalent may be needed. For analysis of finished internationally traded commodities, the import or export parity price may be compared directly with the domestic product’s final SV. In all cases, the objective should be to compare domestic production with the parity price for an equivalent product. A few examples of parity price calculations are provided in Book 7 together with some important instructions on the selection of the correct parity price basis.
C. Price Decomposition
32. The CCAA value chain methodology begins at the financial level with enterprise budgets for each stage of production. These budgets provide all the information to show if the production and marketing of an agriculture commodity is profitable for individual value chain participants. To calculate DVA and SV, however, budget prices must be broken down into their constituent parts. 33. Similar to the use of conversion ratios to track a product’s transformation from stage to stage, the CCAA spreadsheet templates employ a variety of conversion factors (cfs) to calculate each component of DVA and foreign share of total SV. In all cases, the process of price decomposition begins with a known financial price actually encountered by value chain participants. At the farm production stage, these prices include the cost of seed, fertilizer, chemicals and other farm inputs; at the assembly stage, the main prices include transport and storage and so on throughout the process. 34. The spreadsheet templates use four different cfs as follows. Specific instructions on how to calculate each coefficient are provided as embedded comments in the Excel workbooks. It is important to follow these instructions carefully. Book 2 in particular has been designed to help calculate reliable conversion factors and should be used for this purpose.
• % Forex. This conversion factor is an expression of foreign costs as a share of
total SV. In Table 2 above, the % forex is 19.6% or 0.196. This coefficient allows the analyst to calculate both the foreign and domestic share of total costs beginning with an input’s known financial (shipment) value.
• Domestic tax. This conversion factor is an expression of domestic duties and tax
as a share of total DVA. In Table 2, the cf for tax works out to 0.577, which is the total amount of tax divided by DVA (86.30 ÷ 149.36 = 0.577 or 57.7% of total DVA). If the total tax rate as a share of DVA is known, this coefficient may be applied directly. If the total tax is only known as a share of shipment value, additional calculations are needed to derive the appropriate cf. Again, the templates in Book 2 are designed to help make these calculations and should be used to derive appropriate conversion factors.
• Domestic extras. Like the cf for domestic tax, the cf for extras is an expression of unofficial costs as a share of total DVA. In Table 2, the cf for extras works out to 0.069, which is the total amount of unofficial payments divided by DVA (10.37 ÷ 149.36 = 0.069 or 6.9% of total DVA). Again, if the total amount of unofficial payments as a share of DVA is known, this coefficient may be applied directly. If the value of unofficial payments is only known as a share of total SV, however, additional calculations are needed.
• Foreign CF. The foreign cf is used for economic analysis of value chain
performance and is derived by dividing the economic exchange rate by the financial exchange rate. The resulting coefficient is multiplied by the foreign share of total SV to determine the value of imported inputs in economic terms. The economic value of domestic inputs can already be determined since this is equal to total DVA less domestic taxes and unofficial extras and can be determined by the other cfs.2
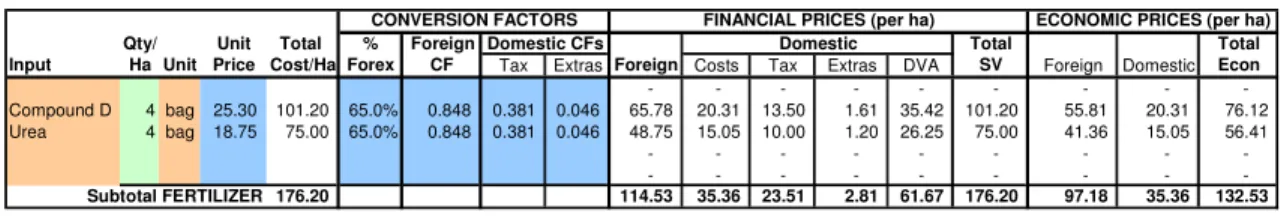
35. An example of how conversion factors are used by the spreadsheet templates is provided in Table 3 below. As in all CCAA templates, the analyst is only required to fill in the shaded cells; the rest of the spreadsheet page contains formulas that must be left alone. The convention of color coding is explained later. For now, what it is important to note is that standard enterprise budget assumptions (quantities and unit prices) are entered on the left side of the worksheet page. These coefficients are then multiplied to determine the total per hectare cost for each input (or, in the budgets for other stages, the coefficients are multiplied to calculate per ton costs). Next, the total input prices are multiplied by each conversion factor to calculate the main value chain indicators and total economic equivalent in foreign and domestic terms.
Table 3: Example of Price Decomposition Using Standard Conversion Factors in a per Hectare Budget.
Qty/ Unit Total % Foreign Total Total
Input Ha Unit Price Cost/Ha Forex CF Tax ExtrasForeign Costs Tax Extras DVA SV Foreign Domestic Econ
- - - - - - - -Compound D 4 bag 25.30 101.20 65.0% 0.848 0.381 0.046 65.78 20.31 13.50 1.61 35.42 101.20 55.81 20.31 76.12 Urea 4 bag 18.75 75.00 65.0% 0.848 0.381 0.046 48.75 15.05 10.00 1.20 26.25 75.00 41.36 15.05 56.41 - - - - - - - - - - - - - - -Subtotal FERTILIZER 176.20 114.53 35.36 23.51 2.81 61.67 176.20 97.18 35.36 132.53 FINANCIAL PRICES (per ha) ECONOMIC PRICES (per ha) Domestic CFs Domestic
CONVERSION FACTORS
D. Summary of Cost Categories
36. From the budget information, the spreadsheet templates prepare a summary of total costs by category as shown in Table 4. By looking at the relative contribution of different categories of inputs to total price build-up, it is possible to identify areas where specific policies or other investments could have the greatest impact on international competitiveness.
2
Because the analysis of SV and DVA is carried out in financial prices, economic calculations are supplemental to the value chain analysis. Through the decomposition of DVA into its three constituent parts, however, the economic value of domestic inputs is already known. Having come this close to determining the total economic price, a provision is also made for the conversion of foreign prices to their economic equivalent using the foreign cf as described. These additional calculations are needed for the Policy Analysis Matrix (PAM).
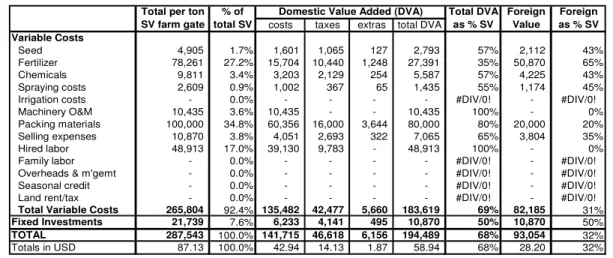
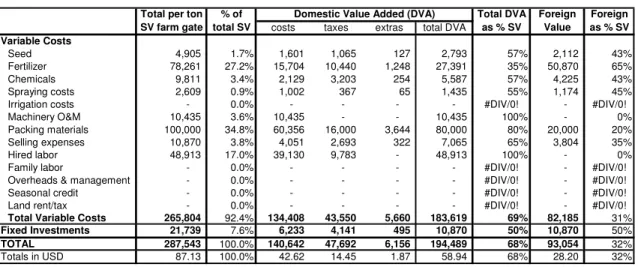
37. Table 4: Example of Cost Summary by Input Category at Farm Production (LCU per ton farm product)
% of Total DVA Foreign Foreign
total SV taxes total DVA as % SV Value as % SV
Variable Costs
Seed 1.7% 1,065 2,793 57% 2,112 43% Fertilizer 27.2% 10,440 27,391 35% 50,870 65% Chemicals 3.4% 2,129 5,587 57% 4,225 43% Spraying costs 0.9% 367 1,435 55% 1,174 45% Irrigation costs 0.0% - - #DIV/0! - #DIV/0! Machinery O&M 3.6% - 10,435 100% - 0% Packing materials 34.8% 16,000 80,000 80% 20,000 20% Selling expenses 3.8% 2,693 7,065 65% 3,804 35% Hired labor 17.0% 9,783 48,913 100% - 0% Family labor 0.0% - - #DIV/0! - #DIV/0! Overheads & m'gemt 0.0% - - #DIV/0! - #DIV/0! Seasonal credit 0.0% - - #DIV/0! - #DIV/0! Land rent/tax 0.0% - - #DIV/0! - #DIV/0!
Total Variable Costs 92.4% 42,477 183,619 69% 82,185 31%
Fixed Investments 7.6% 4,141 10,870 50% 10,870 50% TOTAL 100.0% 46,618 194,489 68% 93,054 32% Totals in USD 100.0% 14.13 58.94 68% 28.20 32% 1,248 254
Domestic Value Added (DVA)
1,601 costs 127 1.87 65 3,644 6,156 322 5,660 495 10,435 -42.94 135,482 6,233 60,356 4,051 39,130 3,203 1,002 141,715 265,804 87.13 4,905 78,261 9,811 2,609 10,870 48,913 21,739 287,543 extras 10,435 100,000 15,704
Total per ton SV farm gate
38. The spreadsheet templates also produce a graphic summary of cost structure as shown in the next example again from the farm production stage.
Figure 3: Graphic Representation of Cost Build-up
Build-up of Farm-level Costs
Overheads & management
0%
Credit & land rent/tax 0% Depreciation 8% Hired labor 17% Marketing costs 38% Spraying, irrigation & machinery 5% Seed, fertilizer & chemicals 32%
39. As shown by the sample data, seed, fertilizer, and chemicals together with marketing costs account for an estimated 70% of total cost structure. Policy interventions or new investments that help reduce these expenditures (without sacrificing quality or timeliness of delivery) could therefore be an effective strategy for improving trade competitiveness. Further insight to how well the production and marketing process is organized can also be gained by comparing the summary data for each stage with international benchmarks. While value chain analysis alone cannot be used to predict optimal cost structures, if one cost component is significantly higher than the international benchmark, further examination of the reasons behind this outcome may be in order.
40. Because the type of costs incurred at different stages vary, the templates for farm production, assembly, processing, and logistics are designed to accommodate different cost categories as shown in Table 5. When preparing the enterprise budgets, CCAA country teams should endeavor to collect detailed cost information for each of the following types of costs. Not all costs will pertain to every crop or production system in which case the space for that component should be left blank as
indicated by the examples above. Some modification of the cost categories may also be needed for the analysis of livestock operations as described later in the section on working with the templates.
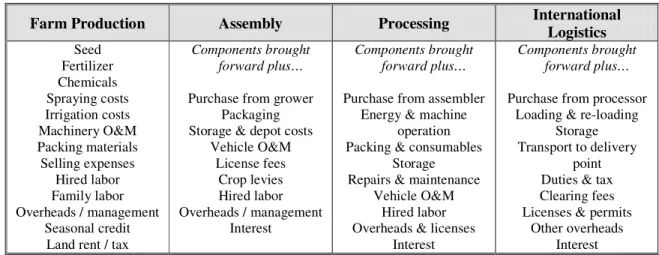
Table 5: Categories of Variable Costs by Value Chain Stage
Farm Production Assembly Processing International
Logistics Seed Fertilizer Chemicals Spraying costs Irrigation costs Machinery O&M Packing materials Selling expenses Hired labor Family labor Overheads / management Seasonal credit Land rent / tax
Components brought forward plus…
Purchase from grower Packaging Storage & depot costs
Vehicle O&M License fees Crop levies Hired labor Overheads / management Interest Components brought forward plus…
Purchase from assembler Energy & machine
operation Packing & consumables
Storage Repairs & maintenance
Vehicle O&M Hired labor Overheads & licenses
Interest
Components brought forward plus…
Purchase from processor Loading & re-loading
Storage Transport to delivery
point Duties & tax Clearing fees Licenses & permits
Other overheads Interest
E. Financial Costs and Profitability
41. Basic Indicators. Beyond the analysis of cost structures and price components, the
quantitative analysis is also interested in the private costs and returns that accrue to value chain participants. Agriculture production and marketing begins with the decisions private investors make and it is important to have a sense of the underlying costs and profitability of competing enterprises and marketing systems. Because the value chain analysis is constructed around enterprise budgets, these measurements are easy to make. The main templates are designed to calculate total variable costs, investment costs, gross profit, and net profit as shown below.
Table 6: Sample Calculation of Basic Financial Indicators FARM PRODUCTION
ZMK USD ZMK USD Gross revenue (yield * price) 1,035,000 313.64 450,000 136.36 Production costs
Variable costs 611,349 185.26 265,804 80.55 Investment costs 50,000 15.15 21,739 6.59 Total costs 661,349 200.41 287,543 87.13 Farmer income
Gross margin (revenue - var costs) 423,651 128.38 184,196 55.82 Net profit (gross margin - invest costs) 373,651 113.23 162,457 49.23
Per Hectare Per Ton
42. Each Excel workbook includes a similar table summarizing basic financial indicators for that stage. These indicators are measured in different terms following the value chain conventions listed below. At the assembly, processing and logistics stages, the cost of commodity purchases is also recorded in the summary table in addition to basic variable cost and total investment cost data. For the purpose of calculating gross margin, commodity purchases are treated as a variable cost.
Farm Production Farm gate product Per Ha; per MT
Assembly Assembled raw material Per Ha; per MT
Processing Processed raw material Per MT; share from Product 1, 2, 3
Logistics Traded commodity 1, 2, 3 Per MT processed raw material; per
43. Supplemental indicators. A great many more financial indicators can be calculated from the basic summary information. Two especially useful indicators are gross and net rate of return. These measures show the rate of return to an investor’s outlay of cash and the ability of the enterprise to cover its long-run depreciation costs respectively and are especially useful in comparing different enterprises. Enterprises with a high ratio provide a better return than those with a low ratio. These financial measures are calculated on Template 1.8 after the summary cost and profitability data are entered in the correct cells.
• Gross rate of return = gross profit / total variable costs.
• Net rate of return = net profit / total production costs.
44. It is also helpful to look at the returns to hired labor and personal management. These indicators are calculated automatically in Book 3 for farm production, but otherwise need to be computed separately when / if there is a particular interest in this aspect of value chain performance.
• Return per day hired labor = Gross (or net) return / days total employment.
• Return per day total labor = Gross (or net) return / days total employment and
family management.
45. With even more detailed budget information, further calculations based on the cash and imputed share of total costs and returns to cash outlay could be prepared. These methods are useful when the focus is on a detailed examination of investment opportunities and growth strategies within a particular sector. CCAA analysts are encouraged to be creative with the methodology and calculate additional indicators as needed. For more general value chain discussion, however, the basic financial data together with some supplemental calculations of gross and net returns and returns to labor provide the all the essential information needed to interpret basic performance.
F. Time Requirements
46. The final dimension of the quantitative methodology is to look at the time required to complete each stage. This differs from the analysis employment generation (days worked) and focuses instead on the number of elapsed calendar days at each stage of the value chain as a measure of international competitiveness. More specifically, the analysis asks: how many calendar days are required to procure all the inputs for farm production; how long does it take to assemble one ton of raw material for industrial processing; and how many days are required for international shipping and so on.
47. Provision has been made in the spreadsheet templates to record the estimated time required for different activities. An example for the input supply stage is shown below. In practice, of course, time requirements can vary significantly from one operator to another depending on the individual’s business model, personal connections, and other priorities. As with other aspects of the value chain analysis, the objective is not to provide a definitive measurement of time spent at each stage, but to take an indicative look at the efficiency of different procedures as an additional benchmark of international competitiveness. Together with the measurements of DVA and SV and financial costs and profitability information, the analysis of accumulated time requirements will provide a more complete picture on the competitiveness position of each participating country.
48. To make the data easier to interpret, time requirements are grouped together in phases (for an example, see Table 7). The definition of each phase varies slightly at different stages of the value chain (Table 8). Time requirements from the farm production through to international logistics, for example, pertain to the production and marketing of specific finished products; time requirements at the input stage relate to procurement of individual raw materials. Other key definitions of time requirements are set out below.
Table 7: Sample Calculation of Time Requirements for Input Supply
Days Req Days % of Procurement 8 Elapsed total Transport to frontier 3 Phase I 11 52% Customs duty & excise
VAT or other sales tax
Domestic clearing (official) 3
Extra procedures 1 Phase II 4 19% Wholesale chain 2
Retail chain 3
Transport to place of use 1 Phase III 6 29% TOTAL 21 100%
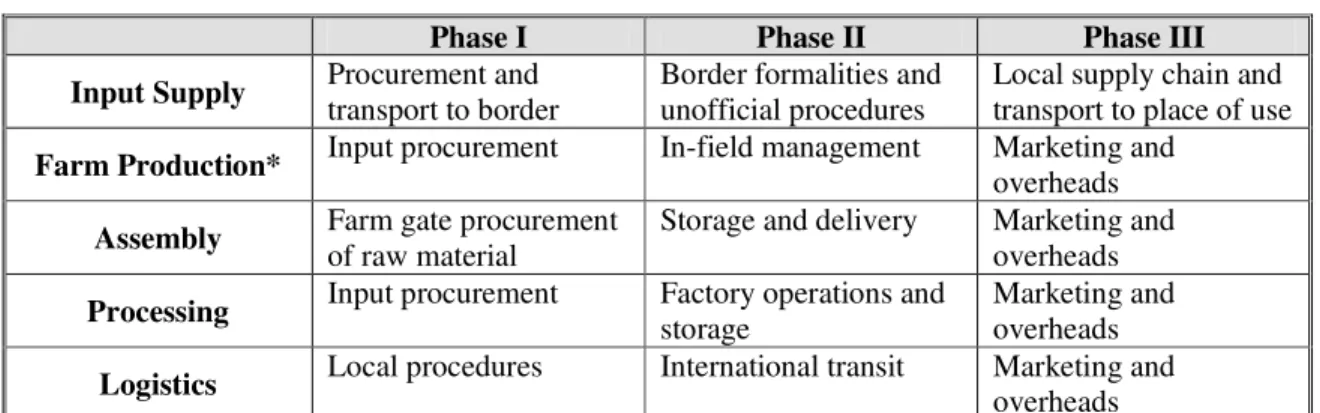
Phase I covers procurement & transport to border; Phase II covers border formalities and unofficial procedures; Phase III = local supply chain and transport to place of use.
Table 8: Classification of Time Requirements by Value Chain Stage
Phase I Phase II Phase III
Input Supply Procurement and
transport to border
Border formalities and unofficial procedures
Local supply chain and transport to place of use
Farm Production* Input procurement In-field management Marketing and
overheads
Assembly Farm gate procurement
of raw material
Storage and delivery Marketing and overheads
Processing Input procurement Factory operations and
storage
Marketing and overheads
Logistics Local procedures International transit Marketing and
overheads
Note: At the farm production stage, an additional provision is made for recording the days from planting to crop maturity.
G. Policy Analysis Matrix
49. Beyond the consideration of price build-up, private costs and profitability, and time requirements, the data generated by the value chain analysis can also be used to complete the Policy Analysis Matrix or PAM. This is a standard methodology developed in the late 1980s for measuring private and economic profits, social efficiency, and policy transfers.3 Nearly all of the data required for PAM construction will have been generated already by the preceding value chain analysis. This method may, therefore, be used to gain additional insight to value chain performance.
50. The PAM is a product of two accounting identities. The first defines profitability as the difference between revenues and costs. The other measures the effects of government interventions or divergences (market failures) as the difference between observed financial prices and prices that
3
For a complete discussion of PAM methodology, see Monke and Pearson, The Policy Analysis Matrix for Agricultural Development, Cornell University Press, Ithaca (1989).
would exist if the divergences were removed. By filling in the elements of the PAM for agriculture activities, it is possible to measure both the extent of policy effects and inherent economic efficiency (or comparative advantage) of the activity.
51. From these measures, the PAM may be used to calculate the following indicators. Further details of this methodology and calculation of key indicators are provided in Annex 3.
• Domestic Resource Cost Ratio (DRC). A DRC is a proxy measure of social
profits (H) and is calculated by dividing the economic value of domestic factor costs (G) by the total economic revenue (measured by parity price calculations) less the economic value of tradable input costs (E - F). Hence, DRC = G / (E - F). By elementary algebra, it follows that the ratio equals 1 if social profitability (H) is 0, is greater than 1 if H is negative, and is less than 1 if, and only if, H is positive. Minimizing the DRC is thus equivalent to maximizing social profitability; the lower the DRC the greater the system’s comparative advantage.
• Nominal Protection Coefficient (NPC). The NPC is a ratio that contrasts
observed (private) commodity prices with a comparable world (social) price. This ratio indicates the impact of policy transfers (and of any market failure not corrected by efficient policy) that causes a divergence between the two prices. The NPC on tradable outputs is therefore defined as private revenue (A) divided by social revenue (E) minus 1 or NPC = (A/E)-1. An NPC greater than zero shows that policies are increasing the market price above the world price, thus providing a positive incentive to the producer. A NPC ratio less than zero indicates a negative incentive (or disincentive) to the producer.
• Effective Protection Coefficient (EPC). The ECP is another measure of
incentives and is the ratio of value added in private prices (A-B) to value added in world prices (E-F) or EPC = [(A-B) / (E-F)]. This coefficient measures the net policy effect of output and tradable input policies.
52. Parity price calculations. Importantly, the PAM bases its measurements of private and social
profitability on an export or import parity price for the commodity being analyzed. As described, parity price calculations are also needed for the interpretation of final SV and DVA indicators. The choice of which price to use depends on whether the country is (at the margin) a net exporter or net importer of the commodity being analyzed.
• In the case of exports, the appropriate parity price is determined either as a direct fob export price quoted on the local market or, more accurately with respect to the global and long-term perspective of value chain analysis, by finding the final imported price in the foreign market where the country is looking to compete and then subtracting all transport and handling costs from that location back through international transport to the start of the logistics stage.
• In the case of imports, the appropriate parity price is either the locally available cif import price for an equivalent foreign good or may be determined by finding the fob export price for that commodity in a foreign market and adding all transport and handling costs from that location to the point of use.
53. Additional export or import parity prices can be calculated back through the processing stage to the assembly point or farm gate. The fact that parity prices can be measured at different stages along the value chain is an important consideration when carrying out supplemental PAM analysis. In this case, there needs to be a clear decision about what stage the PAM analysis is focused on so that cost data are compared with an equivalent parity price for that stage.
H. Enterprise Variations
54. As set out in the CCAA Summary Project Proposal, the quantitative analysis should focus on three farm systems distinguished by unique management and labor characteristics. These systems are not defined in terms of total size or legal status, but by their management system and labor supply as follows. In all cases, the emphasis is on commercial potential rather than subsistence production. The design of the CCAA study calls for a focus on commercial agriculture as set out below. For each sector, the most important location with commercial potential should be chosen for analysis.
• Family Sector Farmers (FAM) are characterized by agriculture operations where
family members double as managers. These operations have no permanent full-time hired workers and may rely only on seasonal labor hired at peak production times.
• Emergent Commercial Farmers (ECF) are also characterized by the presence of
family members who double as managers, but may include 1-3 full-time hired workers. Additional hired labor may also be used at peak production times.
• Large Commercial Farmers (LCF) are managed by fully specialized managers
who may either be a family member or hired professional. These farms operate using three or more full-time hired workers and additional seasonal labor at peak production times.
55. In analyzing each sector, important differences also occur after the farm production stage. Family sector farmers, for example, may only have access to small itinerant traders at assembly whereas a large commercial grower may have a formal contract and rigid delivery schedule to adhere to. There may also be significant differences in product quality that need to be taken into account at the processing stage. Rain fed smallholder cotton, for example, could have a much shorter staple length than irrigated commercial cotton resulting in a different ginning outturn and lower value product. Some processes in the value chain will naturally converge thereby simplifying the analysis, but these and other important differences between farm sectors should be kept in mind when working with the template materials. The analyst’s objective is not to model all possible variations, but to focus on major distinctions that characterize value chain performance and opportunities for improvement by different sectors at each stage.
III. WORKING WITH THE TEMPLATES
56. Having set out the basic concepts applied by the quantitative methodology, this section now provides an overview of how to work with the template materials. Section IV then takes a more detailed look at the contents of each individual workbook.
A. Organization of Books
57. As described at the outset, seven interlinked Excel workbooks with various template pages have been developed for the CCAA study. Book 1 is a covering book with driving data and summary pages; Book 2 is for the analysis of input costs; Books, 3, 4, 5, and 6 are the main analytical books covering different stages of value chain production; Book 7 is for supplemental PAM analysis and calculation of parity prices. An overview of the workbooks is given below; more detailed instructions on how to work with each page within the different workbooks follows.
• Book 1: Country Data and Summaries. This book is a covering file. It includes
driving data linked to other files and is meant to be built-up with summary information created in other analytical pages.
• Book 2: Input Costs. This book is used for the input analysis. It includes blank spreadsheet templates that are used to derive the conversion factors needed for enterprise budget analysis. A template is also provided for the derivation of annual depreciation costs using the capital recovery method.
• Book 3: Farm Production. This book is used for the farm level analysis ending at
the first point of sale. It includes a budget template and analytical summary page. Data are expressed in per hectare and per ton terms for a single farm gate product.
• Book 4: Assembly. This book is used for the analysis of rural marketing and
transportation between the farm gate and processing point. It includes a budget template and analytical summary page. Data are expressed in per ton of assembled raw material terms.
• Book 5: Processing. This book is used for analysis of the processing stage
beginning with the delivery or assembled raw material and transformation into a maximum of three finished products with different characteristics and value. Data are measured per ton of processed raw material.
• Book 6: International Logistics. This book is used for analysis of the final
delivery stage, which may be a domestic destination for import substitutes or foreign destination for exports. Separate production budgets and analytical calculations of DVA and SV are made for each finished commodity produced at the processing stage. Data are expressed in per ton of traded product terms.
• Book 7: PAM Analysis. This final book is a supplement to the main analysis. It
contains a template for PAM analysis and calculation of import and export parity prices.
58. Exceptions for cattle. For cattle value chains that include a feedlot operation, “assembly”
takes on a somewhat different meaning. Broadly defined, the assembly stage is still concerned with the collection of a farm product (in this case, weaner calves or some other animal for fattening) and delivery of a raw material for industrial processing (finished beef ready for slaughter), but also involves additional production costs. Book 4, therefore, is still the most logical place for this operation to be examined, but some modifications of the spreadsheet template will be needed to account for different cost categories. Country analysts may either attempt to modify the spreadsheet to match their specific needs, or request a specific template to match these conditions. The most important aspects of this spreadsheet design are first to capture the correct values carried forward from farm production and second to create appropriate categories for different types of variable costs.
B. Conventions of Workbook Design and Use
59. Two sets of spreadsheet templates are provided with this paper. The first set includes sample numbers that were used during the spreadsheet design to make sure the calculations work. Examining this set of partially filled-in templates will help each country team to understand how the templates work. The second set of workbooks does not include sample data. These blank templates are the best starting point for teams to prepare the country analysis. Several #DIV/0! errors will appear the first time the blank set of books are opened. These errors will go away as soon as the exchange rate assumption and other data are entered.
60. A set of the blank workbooks should be saved in a separate folder at the start of the analysis. New copies of each workbook can then be opened and saved with a unique name as the analysis is built up to cover different production and marketing systems. Only one copy of Book 1 is needed to record the main country assumptions and summary of results. Eventually there should be active links
running to and from Book 1 and the other analytical workbooks. Multiple copies of every other book will be needed for each crop and management variation covered.4
61. Types of pages. Each workbook contains one or more of the following types of pages.
• Template Driver. Page 1.1 is the only template driver. This page is used to record
the country name and exchange rate assumptions. These data are linked to all other workbook pages; hence the name “template driver”.
• Summary Page. Book 1 includes 6 summary pages for recording various results
from the analysis of different enterprises. Pages 1.3 to 1.7 correspond to the main stages of value chain production from input supply, to farm production, assembly, processing, and logistics. Page 1.8 summarizes the results for each stage by commodity and sector.
• Template. Template pages are used for the main analysis. A new copy of each
template must be created and saved with a distinct name for each enterprise variation covered. Most of the raw data required for the analysis will be entered on a template page.
• Summary Template. Summary templates are a hybrid of summary page and
template page. First and foremost, these worksheets take data from the associated production budget or other workspace and calculate standard value chain indicators, conversion factors, and measures of private cost and profitability from these data. Time requirements are also measured by the summary templates, but these data must be entered manually (as on a “template page” rather than “summary page” – hence, the hybrid nature of these templates).
• Sample Page. Page 7.2 provides a few examples of parity price calculations
required for PAM analysis and interpretation of final SV and DVA components.
62. Embedded comments. Several important comments are embedded in the worksheet pages as
indicated by a small red triangle in the upper right corner of some cells. These comments contain important instructions and other detailed guidelines for working with the template materials. Country analysts should follow these guidelines as closely as possible. It is highly recommended to read all comments carefully before working with the spreadsheet materials.
63. Color coding. Each workbook follows a convention of color coding to help guide the analyst
as follows. Country analysts should only need to enter data in the shaded cells; cells without shading contain formulas and should be left alone.
Orange cells are for text
Green cells are for numbers
Blue cells are for data drawn from a previous stage in the analysis
Yellow cells highlight key results and other important information
Grey (or black) cells are placeholders for assumptions that do not normally change White cells contain formulas and should not be altered
4
Even for the input analysis, individual templates from Book 2 are perhaps best saved in different files. Depending how each team structures their input analysis, there might be one book with copies of the templates used for domestic inputs, one book for the analysis of imported inputs, and one book for the derivation of investment costs. The most important is to use a transparent naming system that others can easily understand.
64. Automatic links. Excel allows the user to paste links between different workbooks and between pages within a workbook so that information will be updated automatically. The blank set of CCAA templates only includes links to Book 1 (Page 1.1) where the analyst is required to enter the country name and exchange rate assumptions. These data are linked to all other books and will update automatically each time the templates are used.
65. To preserve the templates in their generic form and create a set for individual country analysis, follow these procedures:
a) Be sure all seven blank CCAA workbooks are open.
b) Enter the country name and exchange rate assumptions on Page 1.1
c) The new country name, currency designation, and exchange rate assumptions will change automatically in all other templates.
d) Save each of the seven books with a unique name for your country. For example: Book 1 – Zambia Country Data and Summaries
Book 2 – Zambia Input Prices Book 3 – Zambia Farm Production And so on…
e) Verify that the correct links to the newly saved book have been established by looking in Row 1 of each template (where the country name is recorded) and in Rows 3 and 4 (where the currency designation and exchange rate information appear). These cells should not only display the correct country name and exchange rate assumptions from Page 1.1, but also specify a direct link to the newly named driving workbook. If the Book 1 were named “Book 1 – Zambia Country Data and Summaries”, the references in rows 1, 3 and 4 should now appear as followings.
Row 1 (country name):
=’Book 1 – Zambia Country Data and Summaries.xls’!country Rows 3 & 4 (currency designation):
= ‘Book1 – Zambia Country Data and Smmaries.xls’!LCU Rows 3 & 4 (financial and economic exchange rates):
= ‘Book1 – Zambia Country Data and Smmaries.xls’!ExR_financial = ‘Book1 – Zambia Country Data and Smmaries.xls’!ExR_econoimc
66. At the start of the analysis, there will be no other active links between the books other than to the country name and exchange rate assumptions on Page 1.1. As the analyst creates multiple copies of each template page, active links to the other workbooks can be created at that stage. In order to do this correctly, each linked book must be saved with a unique name. For example, as the analyst completes the study of family sector maize in Zambia: Books 3, 4, 5, and 6 could be saved as follows. There would be a corresponding set of books for ECF Maize, LCF Maize, and all other commodities.
Book 3 – Zambia Farm Production, FAM Maize Book 4 – Zambia Assembly, FAM Maize Book 5 – Zambia Processing, FAM Maize