Ensemble gene selection by grouping for microarray data classification
Huawen Liu
a, Lei Liu
a,*, Huijie Zhang
ba
College of Computer Science, Jilin University, Changchun 130012, China b
College of Computer, Northeast Normal University, Changchun 130021, China
a r t i c l e
i n f o
Article history:
Received 5 December 2008 Available online 20 August 2009 Keywords: Classification Gene selection Information metric Markov blanket Ensemble learning Microarray analysis
a b s t r a c t
Selecting relevant and discriminative genes for sample classification is a common and critical task in gene expression analysis (e.g. disease diagnostic). It is desirable that gene selection can improve classification performance of learning algorithm effectively. In general, for most gene selection methods widely used in reality, an individual gene subset will be chosen according to its discriminative power. One of deficiencies of individual gene subset is that its contribution to classification purpose is limited. This issue can be alle-viated by ensemble gene selection based on random selection to some extend. However, the random one requires an unnecessary large number of candidate gene subsets and its reliability is a problem. In this study, we propose a new ensemble method, called ensemble gene selection by grouping (EGSG), to select multiple gene subsets for the classification purpose. Rather than selecting randomly, our method chooses salient gene subsets from microarray data by virtue of information theory and approximate Markov blan-ket. The effectiveness and accuracy of our method is validated by experiments on five publicly available microarray data sets. The experimental results show that our ensemble gene selection method has com-parable classification performance to other gene selection methods, and is more stable than the random one.
Ó2009 Elsevier Inc. All rights reserved.
1. Introduction
The rapid advances in high-throughput technologies such as gene expression microarray not only provide new insights into bio-logical phenomena, but also allow simultaneous measurement of activities of thousands of genes (features), thereby improving the prospects for effective and reliable disease diagnosis and prognosis [1]. Among various scientific tasks about microarray data (e.g. dis-ease discovery), the identification of arrays with evidently different expression (or gene maker) is extensively studied by researchers. This is also known as classification problem in machine learning community. To effectively process microarray data, many machine learning methods, such as decision tree and nearest neighbor, have been introduced into bioinformatics[2–4], and several comparison experiments (see, e.g.[5]) have demonstrated their effectiveness.
Microarray data set (or gene expression profile), which is ob-tained by experimenting on several samples[1], is usually orga-nized as a two-dimensional matrix M with n rows and m columns. Thesemcolumns represent different genesGand each row is a sample of expressions of different genes. The purpose of classification on microarray data is to separate or distinguish one
type of samples (e.g. healthy patients) from other types (e.g. cancer patients), so as to further predict response to therapy. This kind of data analysis is especially important in early tumor and cancer dis-covery because its result can effectively help cancer diagnosis and clinical treatment[3,4]. For microarray data, one of its characters is that the numbernof samples collected is very small (typically less than 100), while the numbermof genes is relatively huge (usually thousands or tens of thousands). This, however, poses a great chal-lenge to traditional classification algorithms. With such an over-whelming number of genes, the efficiencies of traditional learning algorithms will be very low and at the same time, classi-fiers built upon them will be prone to over-fitting. Moreover, the presence of inherent noise raised from complex scientific proce-dures makes it even worse, when the sample size is small. To alle-viate this so-called high-dimensional small-sample problem[6], an effective solution, called gene selection, is introduced.
Gene selection refers to the process of removing irrelevant or noise genes from microarray data and preserving those informative genes to predict classes or diseases. Since it can bring several advantages to classifier, such as reducing computational expense, improving prediction performance and yielding more compact and conveniently interpreted results for diagnostic task, gene selec-tion has now attracted increasing interests in bioinformatics and many outstanding gene selection methods have been developed [7–9]. Generally, gene selection methods can be grouped into three categories, i.e., filter, wrapper and hybrid methods, depending on 1532-0464/$ - see front matterÓ2009 Elsevier Inc. All rights reserved.
doi:10.1016/j.jbi.2009.08.010
* Corresponding author. Address: College of Computer Science and Technology, 2699 Qianjin Street, Changchun 130012, China. Fax: +86 431 85159373.
E-mail addresses: [email protected] (H. Liu), [email protected] (L. Liu),
[email protected](H. Zhang).
Contents lists available atScienceDirect
Journal of Biomedical Informatics
j o u r n a l h o m e p a g e : w w w . e l s e v i e r . c o m / l o c a t e / y j b i nwhether their evaluation criterion involves classification models [7]. Filter method is independent of classification or learning algo-rithm. It chooses salient genes on the ground of discriminant crite-rion that only relies on the characteristics of data. A representative example of this kind is mRMR[10], which maximizes relevancy with the response classes and minimizes redundancy with the se-lected genes by virtue of mutual information. Shen et al.[11] mea-sured the significant degree of gene by the suitability score. Contrastively, wrapper model embeds classifier within search and evaluation procedure. As a typical illustration, SVM-RFE and its extensions adopt support vector machine (SVM) to evaluate and eliminate redundant genes recursively[12]. Besides, genetic algo-rithm (GA) has also been used to optimize the search procedure of gene subset. For example, Yeh[13]applied GA to identify a group of relevant genes from cancer microarray data, and then fed these genes into classifiers. While Zhu et al.[14]integrated Markov blan-ket with mimetic operators in GA to efficiently eliminate redundant genes. Due to the limitation of space, here we do not list them one by one. Interesting readers can refer to up-to-date surveys (see, e.g. [7–9]) to get more information about gene selection. One may ob-serve that both filters and wrappers have their respective limita-tions. For instance, filters have relatively poor prediction performance, while wrappers require much more computational cost, making them inappropriate to high-dimensional data[7].
Since traditional gene selection methods provide limited contri-butions to classification, many researchers resort to hybrid or sophisticated techniques to choose interesting gene. For example, Au et al.[15]employedk-mean-like method to cluster genes into several groups and then selected an informative one from each cluster. Similarly, Yu et al.[16]grouped genes with similar prop-erty by kernel dense estimation. In addition, random forest has also been utilized to evaluate and select important genes, because it can take interactions between genes into account explicitly and free distributional assumptions[17,18]. To further improve prediction performance, recently many efforts have been made on ensemble technique. A typical example is ECRP[19], where different gene subsets are firstly chosen by random partitions and then used to construct classifiers. Instead of random selection, Cho and Won [20,21]obtained gene subsets by seven different correlation coeffi-cients. However, Saeys et al.[22]utilized different filter methods to identify multiple gene subsets, while Wang et al.[23]chose a rel-evant gene subset in terms of class-dependent criterion for each class. Additionally, Okun and Priisalu[24]took data set complexity into consideration, and theLleast complex gene subsets would be further processed. Yan and Zhang[25]obtained multi-gene subsets by backward elimination strategy on small random sets of genes one at a time with information measures. After that, the genes were ranked based on their aggregated return frequencies.
Unlike other methods, in this paper, we propose a group-based ensemble gene selection method for microarray data classification. The rationale behind it is that given a microarray profile, there is a moderate quantity of different gene subsets having the same or similarly good prediction performance, notwithstanding many of them have only a few genes in common [26]. Specifically, our method consists of three steps. At the beginning, it divides genes into several groups by approximate Markov blanket. After this grouping procedure, similar genes are bound within the same group, while dissimilar genes belong to different groups with re-spect to information correlation coefficient. In the second stage, for each group, one representative gene is randomly picked out to compose a gene subset. Since this subset summarizes the pat-terns seen across the entire data set, it is an informative one. Fur-thermore, multiple subsets are constructed in the same way to improve robustness. Thus they can provide complementary infor-mation about classification. Finally, classifiers are trained with these obtained subsets and an ensemble one is formed by the
majority voting strategy. The structure of the rest is organized as follows. Section2provides the framework of our ensemble gene selection algorithm by grouping genes. Experimental results con-ducted to evaluate the usefulness and effectiveness of our ap-proach is presented in Section3. Finally, conclusions and future works are given in the end.
2. Methods
As mentioned above, classification is the process of labeling samples with pre-defined classes in terms of available information, which is often embodied in genes. This implies that to achieve bet-ter classification performance, the common way for classifiers is to select those genes with the most discriminative capability. To mea-sure this capability of gene, many metrics, such as discriminative contribution [27], Pearson’s correlation coefficient, Spearman’s correlation coefficient, Euclidean distance, cosine coefficient, signal to noise ratio andt-statistic[20,28], have been proposed. However, these metrics are linear ones and some of them are parametric. As a result, they do not robustly capture the non-parameterized struc-ture shared among genes.
Unlike other criteria, information metric based on entropy are nonlinear and non-parametric[29]. Since entropy is capable of ex-actly quantifying the uncertainty of variable and no assumption about the distribution of data is made, information metric has at-tracted much attention and seems to be widely studied in practice [30]. Additionally, several empirical studies (see, e.g.[31,32]), have demonstrated that information metric is superior to others for classification in many cases. In this paper, we also place our focus on information metric. Before we delve into the details of our method, let us turn our attention to information entropy. 2.1. Information correlation coefficient
In information theory, information entropy is a fundamental concept [29]. Let X be a discrete random variable. pðxÞ and domðXÞdenote the marginal probability distribution and domain ofX, respectively. Its information amount (or uncertainty) is repre-sented asentropy HðXÞ, where
HðXÞ ¼ X x2domðXÞ
pðxÞlogpðxÞ: ð1Þ
Note that information entropy does not depend on the actual values of variableX, but only its probability distribution. For con-tinuous variable, its alternative is often taken as an integral form. Since the estimation of probability density of continuous variable is difficult and cost, here we only deal with discrete variables with finite values for the sake of simplification, and if there is no ambi-guity,domðXÞwill be dropped. In a similar vein, thejoint entropy between two variablesXandYis
HðX;YÞ ¼ X Xpðx;yÞlogpðx;yÞ: ð2Þ Mutual information is another important concept to represent relevance between two variables. It mainly scales the average reduction of entropy (uncertainty) of one variable under the con-text of another one. Given two variablesXandY, theirmutual infor-mationis
IðX;YÞ ¼X Xpðx;yÞlog pðx;yÞ
pðxÞpðyÞ: ð3Þ
From this equation, one may notice that the larger their mutual information is, the higher the relevant degree between two vari-ables is. Just owing to this, it has been extensively studied in gene selection and taken as evaluation criterion to measure the signifi-cance of genes[30]. However, an unfavorable situation for gene
selection based on mutual information is that genes with more val-ues will be chosen in higher priority. The reason is that the value of IðX;YÞincreases with the number of possible values ofX andY. Here mutual information will be normalized by the joint entropy. Given two variablesXandY, ifHðX;YÞ–0, their information cor-relation coefficient (ICC) is defined as
ICCðX;YÞ ¼ IðX;YÞ
HðX;YÞ: ð4Þ
Otherwise,ICCðX;YÞ ¼1. Clearly, 06ICCðX;YÞ61, and ifICCðX;
YÞ ¼1,XandYare strictly dependent and relevant. Contrastively, ICCðX;YÞ ¼0 indicates that they are statistically independent or irrelevant to each other. With this notion we can express a correla-tion degree by stating thatXis relevant toYwith degreeICCðX;YÞ. Moreover, ICCðX;YÞ meets reflexive, symmetric and monotonic properties. Unlike mutual information, the monotonic property guarantees that this metric is not prone to choosing those genes with more values in gene selection.
2.2. Grouping genes by approximate Markov blanket
According to previous discussion, information correlation coef-ficient can be used to represent the gene–class relevant degree, and the higher ICCðg;CÞ is, the more discriminative information embodied in genegabout the target classesC. Thus, a naive solu-tion for the problem of gene selecsolu-tion is to evaluate each candidate gene in terms of this metric, and select those genes with the high-est correlation coefficient to build a classifier. Such method of selecting top genes has been proven effective in producing good classification performance for microarray data[33]. Unfortunately, this method only involves contribution of individual gene to clas-ses and does not take into consideration the relevancies between selected genes. In fact, when two selected genes highly correlate to each other, their respective class-discriminative power will not change much after one of them has been removed[10]. In this scenario, it is a wise choice to consider both the gene–class and gene–gene correlation degrees in evaluating candidate genes, and a gene is good enough if it is highly correlated to classes and uncor-related to already selected genes.
Similarly, the information correlation coefficient can also be adopted to represent the gene–gene relevant degree. IfICCðg1;g2Þ is larger enough, geneg1is considered to be highly correlated with geneg2, and in some way, they have similar class-discriminative power in classification predication. That is to say, onceg1has been selected in advance,g2should not be in consideration later. This gives us a good indication for selecting informative genes, i.e., be-fore selecting genes, we can cluster genes which are highly corre-lated with each other into the same group, and others into different groups. Under this context, genes in the same group are highly rel-evant to each other and share certain biological pathway, while genes in different groups have their respective characteristics. Dur-ing the procedure of selection, if genegiis chosen, all genes in its corresponding group are redundant and should not be considered again. By picking one representative gene out from each group, a gene subset is produced. This gene subset has good discriminate capability to the target classes, because its members come from different groups.
For gene clustering, various techniques, such as k-means and hierarchical clustering, are available[34]. However, they are often restricted by parameters and require much more training time. Inspiring from FCBF[35], we also adopt approximate Markov blan-ket technique to group similarity genes. Given two genesgiandgj, gi is an approximate Markov blanket of gj, if and only if ICCðgi;CÞPICCðgj;CÞ and ICCðgi;gjÞPICCðgj;CÞ. This definition implies that for any geneg, it has more relevant to its approximate
Markov blanket genes than others, because the approximate Mar-kov blanket genes subsume not only the information that g has aboutC, but also about others. That is to say, the gene shares more similarity with its approximate Markov blanket genes and it can be packed into the same group where its approximate Markov blanket genes are contained. On the contrary, if a gene has no approximate Markov blanket, it forms a new group. Based on this principle, our gene grouping algorithm is shown as follows:
Algorithm1.Gene grouping algorithm using approximate Markov blanket.
Input: A microarray data setDwith gene setGand the target classesC;
Output: A set of gene groupsGS;
Step 1: Initialize the set of gene groupsGSas an empty set; Step 2: For each geneg2G, calculate its information
correlation coefficientICCðg;CÞwith the classesCand sort them in a descending order;
Step 3: Assign the first gene to a new groupG1and label it as the center of this group;
Step 4: For each genegin the sorted list, if there is a group Gi2GSsuch that the center ofGiis its approximate Markov blanket, then groupgintoGi; Otherwise, insertginto a new groupGjand labelgas its center; Step 5: Repeat Step 4, until all genes in the list have been
grouped into one of gene groups;
Step 6: Return the set of gene groupsGS¼ fG1;. . .;Gkg;
This grouping algorithm works in a straightforward way. Firstly, the gene groups GSis initialized as an empty set, and then the gene–class correlation coefficient for each gene is calculated and sorted in a descending order. The purpose of sorting is to deter-mine whether a gene has an approximate Markov blanket in ad-vance and facilitate to mark it as the center of a new gene group if it has no. After that, the grouping procedure for each gene contin-ues. At this stage, each gene will be assigned into either one of existing groups or a new group, depending on whether it has approximate Markov blanket or not. The time complexity consists of two components: sorting and grouping. Assume that the num-ber of genes ism, the time complexity of the sorting procedure is OðmlogmÞ, while the grouping one isOðmkÞ, wherekis the number of groups inGS. In the worst case where each gene forms a group containing only itself,k¼m. Besides its efficiency, another advan-tage of this grouping algorithm is that the numberkof groups is adaptively determined.
2.3. Ensemble gene selection
Once gene groups have been generated, a gene subset can be formed by picking one representative gene out from each group. Meanwhile, a corresponding classifier can be constructed by bind-ing pre-specified learnbind-ing algorithm with this gene subset. Intui-tively, the center gene is a representative one for each group. However, it may loss its center position if training samples are changed. Hence, the classifier constructed in such way is not en-ough robust to new samples. To alleviate this issue, Ein-Dor et al. [26]suggested that many different gene subsets can lead to better classification performance, although less genes contained in these subsets are common. This is a kind of ensemble learning, which ini-tially is a method of combining several decisions induced by indi-vidual classifiers into one in some way to improve the performance of the overall system[36]. Since ensemble learning can effectively improve classification performance, reliability and stability, it is now becoming a popular technique in machine learning commu-nity[36].
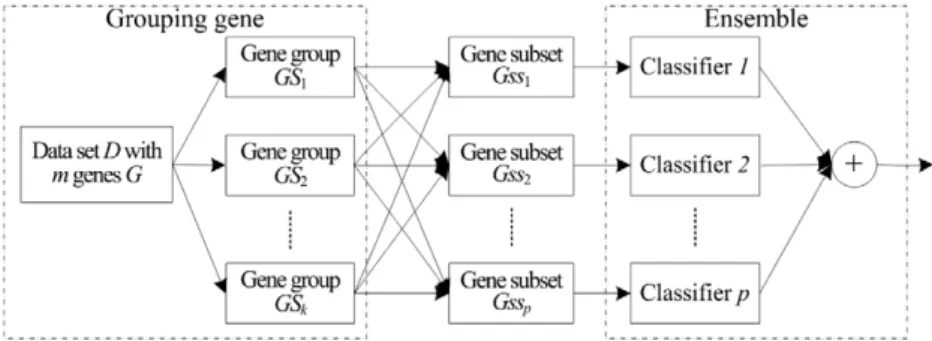
Based on this principle, our solution is to construct multiple gene subsets in the same way and then integrate them into an overall one for classification purpose. The general framework of our method is illustrated asFig. 1, wherem,kandpare the quan-tities of genes, gene groups and subsets, respectively. Usually,k–p andkis adaptively achieved by Markov blanket. In the first stage, all available genesGin a microarray data setDare grouped into k disjointed gene groups GS by Algorithm 1, where jGSj ¼ k;GSi\GSj¼ ;and[GSi¼G. After that,pgene subsetsGsscan be formed from these gene groups by choosing one representative gene from each group. That is to say, for each gene subsetGssi, it consists ofkgenes, i.e.,jGssij ¼k, and thejth gene inGssi comes from thejth gene groupGSj. It is observed that the center of gene group GSj is the approximate Markov blanket of genes in this group. Although each gene inGSjhas similar discriminative power, its center has the most discriminative power, and the more near (i.e., relevant) to the center, the more information gene has. There-fore, in picking thejth gene out fromGSj, we randomly select a rep-resentative one around the center of GSj. Finally, for each gene subsetGssi, a classifier is built and then thesep base classifiers are combined by ensemble technique with majority voting manner.
A successful ensemble classifier highly relies on two aspects: diversity and combining strategy[37]. The diversity is mainly rep-resented as different samples, genes and base classifiers. In our ensemble method, we generatepdifferent gene subsets from gene groups to increase its diversity. Additionally, for each gene group, we randomly select representative gene only from the toptgenes near around its center. It is noticeable thattis a counterpoise and its value should be determined by specific problems at hand. Iftis large, the diversity increases while the stability decreases. Con-trarily, iftis too small, the diversity is a problem and ensemble technique may loss its advantage. In our experiments, we found that our method worked well whent¼15.
3. Results and discussion 3.1. Data sets
To evaluate the performance of our proposed method, five pub-licly available gene microarray data sets were selected from litera-tures. These data sets are often used to validate the performance of classifiers and gene selectors. Their brief specifications are pre-sented in the following.
Breast cancer [38]the quantities of genes and samples in this data set are 24,481 and 97, respectively. Among these samples, 46 of which are from patients who had labeled as relapse, the rest 51 samples are from patients who remained healthy and regarded as non-relapse.
CNS (central nervous system) [39] records embryonal tumor patients in the central nervous system. It contains 60 patient samples with 7129 genes, where 21 are survivors (who are alive after treat-ment) and 39 are failures (who succumbed to their disease).
Colon cancer [40]consists of 62 samples collected from colon-cancer patients. Among them, 40 patients suffer colon cancer and the remaining are normal. Although originally expression levels have 6000 genes, 2000 genes were selected in this study for the confidence in the measured expression levels. Leukemia [1]contains the expression levels of 7129 genes for
72 bone marrow samples labeled with two classes: 47 acute lymphoblastic leukemia (ALL) and 25 acute myeloid leukemia (AML).
Prostate [41] comprises the expression levels of 12,600 genes. It contains in total 102 samples with two classes: tumor and non-tumor. Among them, 52 and 50 patients belong to tumor and non-tumor samples, respectively.
In these data sets, all genes are expressed as numerical values at different measurement levels. For convenience, we normalized each gene so that its mean and standard deviation are zero and one, respectively. Followed by Ding and Peng’s suggestion in [10], each gene is further discretized into three disjointed parti-tions, i.e., (/,0.5], (0.5, 0.5) and [0.5, +/), and each segment corresponds to a discrete value (e.g. 0, 1 and 2).
3.2. Results and discussion
We compared our methods (EGSG) with three model-free gene selection methods: FCBF[35], mRMR[10]and ECRP[19]. The rea-son of choosing them is that they are typical and popular selectors. FCBF[35] measures the relevance between genes by symmetric uncertainty and eliminate irrelevant genes by virtue of approxi-mate Markov blanket. In mRMR[10], only those genes that may bring more relevance to the classes and less redundancy to the se-lected genes at the same time will be sese-lected. ECRP[19] is an ensemble gene selector. It picks multiple gene subsets out from the original space by the manner of random partitions. Based on these gene subsets, classifiers are constructed and then integrated in majority voting way.
In our experiments, the same quantity of genes was selected for each selector to make an impartial comparison. Additionally, two classical learning algorithms, Naive Bayes (NBC)[42]andk -near-est-neighbor (kNN)[43], were adopted to build classifiers on the selected gene subsets. ForkNN,k¼3 and its distance was calcu-lated by Euclidean formula in our experiments. In assessing the performance of selectors, bootstrap and re-substitution have better
performance thank-fold cross-validation[44]. Neverthelessk-fold cross-validation seems more popular in literatures. There is no exception to our experiments, where leave-one-out cross-valida-tion (LOOCV) is adopted because it is relatively steady and accurate in obtaining an unbiased performance estimation. All source codes were implemented with VC++ 6.0 and experiments were con-ducted on a Pentium IV PC with 2.4 GHz processor and 512 MB main memory.
3.2.1. Classification error
Table 1summarizes the classification errors of NBC and 3NN by using four gene selectors, where the number of base classifiers (nc) in EGSG and ECRP is 30. From this table, one can observe that the classification errors induced by our method are not higher than those by other selectors in both classifiers, and ECRP is relatively poor. It is true because EGSG is an ensemble method, but FCBF is not, notwithstanding they share similar characteristics. For ECRP, its performance is dependent on two aspects: the number of se-lected genes and the intrinsic dimensionality of data set. If the number of selected genes is larger and the intrinsic dimensionality of data set is low, the classification performance of ECRP will be high. For example, in the NBC classifier, the error of ECRP on Leuke-miais 1.39%. This is slightly higher than other selectors.
For theLeukemiadata set, all samples were correctly recognized by classifiers with EGGS, FCBF and mRMR. Perhaps the reason is that gene selectors chose too many genes. To demonstrate this, we conducted extra experiments by selecting fewer genes. The re-sult was that under the context of zero error, the quantities of genes selected by EGSG, FCBF and mRMR in NBC (3NN) were 14(15), 19(27) and 8(12), respectively. At this point, mRMR outper-forms our method on this data set.
In [45], the classification performance of NBC with the RBF selector on the Colon, Leukemiaand Breastwere 88.71%, 98.61% and 93.81%, respectively, and the quantities of selected genes were 4, 16 and 34. Meanwhile, the corresponding accuracies of ReliefF were recorded as 85.48%, 97.22% and 79.38%. However, if we se-lected the same number of genes on these data sets, our accurate rates were 91.94%, 100% and 100%, respectively. Au et al.[15] pro-posed a gene selection algorithm based on attribute clustering, called ACA. In their paper, the classification errors of NBC with ACA onColonandLeukemiawere 35.5% and 38.2% with 7 and 50 selected genes, and these are all higher than ours: one was 8.06% and another was 0.0%.
In the 3NN classifier, Yang et al.[46]gave the classification er-rors achieved by their method onLeukemiaandProstatewith 30 se-lected genes were 5.6% and 6.9%, respectively. Under the same condition, our errors were 1.39% and 4.9%. Additionally, the perfor-mance of EGSG is also superior to that of ACA onColonand Leuke-mia. The similar situation can be found in comparing to DRAGS [16], which also adopts grouping technique to select informative genes. The difference with our method is that DRAGS groups genes into several clusters by virtue of the similarity of kernel dense estimation.
Besides ECRP, our method is also competitive in comparing with other ensemble methods. For example, the recognition rates of 3NN with 25 genes onLeukemiaandColonin[20]were not more than 97.1% and 83.9%, respectively. Due to its robustness, random forest (RF) has also been applied to select or rank genes[18]. To demonstrate EGSG outperforms the RF in [18], we selected the same quantities of genes and built the same quantities of classifiers (i.e., 2000) on theColon,ProstateandLeukemiadata sets. The re-sults show that our method achieved lower errors.
To illustrate the impact of validation manner, we carried out several added experiments with gene selectors by 5-fold and 10-fold cross-validations. The classification errors of 3NN are given inTable 2. The results tell us that our method can still work well under different validate manners, and there is no significant differ-ence. Similar cases can be found in the NBC classifier, which will not be presented here due to space limitation.
3.2.2. The ensemble quantity and stability
The quantity of base classifiers in ensemble is an important fac-tor that should be taken into consideration in its implementation. Generally, the classification performance of ensemble method in-creases along with the number of base classifiers (nc). Hence, in or-der to achieve better performance, a simple solution is to combine more base classifiers. However, when the number of base classifi-ers within an ensemble reaches a certain point, its classification performance increases faintly. On the other hand, it requires much more training time. To validate this assume, we performed EGSG on these five data sets 10 times. The mean accuracies are presented asFig. 2. From this illustration, one can observe that the classifica-tion performance were changed slightly as the number of base classifiers reached a point, and for different classifiers, the thresh-old was different. Summarily, it is reasonable for EGSG that the threshold was assigned to 30 on these five data sets in our experiments.
Table 1
The LOOCV classification errors of NBC and 3NN, using four gene selectors, EGSG, FCBF, mRMR and ECRP, on five microarray data sets. For EGSG and ECRP, the number of gene subsets was 30.
Data sets NBC 3NN
EGSG FCBF mRMR ECRP EGSG FCBF mRMR ECRP Breast 0.00 2.06 0.00 17.53 3.09 7.22 5.15 25.77 CNS 0.00 0.00 1.67 13.33 8.33 15.00 11.67 40.00 Colon 6.45 8.06 11.21 8.06 9.68 11.29 22.58 29.03 Leukemia 0.00 0.00 0.00 1.39 0.00 0.00 0.00 13.89 Prostate 0.98 2.94 1.96 34.31 1.96 2.94 2.94 32.35 Table 2
The classification errors of 3NN with four gene selectors by 5-fold and 10-fold cross-validations on five microarray data sets.
Data sets 5-fold 10-fold
EGSG FCBF mRMR ECRP EGSG FCBF mRMR ECRP Breast 3.09 11.34 5.15 27.84 3.09 7.22 5.15 25.77 CNS 6.67 15.00 11.67 35.00 8.32 13.33 11.67 35.00 Colon 8.06 11.29 22.58 29.03 8.06 11.29 24.19 30.65 Leukemia 1.39 0.00 0.00 16.67 0.00 0.00 0.00 15.28 Prostate 1.96 2.94 2.94 31.37 2.94 2.94 2.94 30.39
Fig. 2.The relationship between the mean performance and the number of classifiers in EGSG conducted on five data sets 10 times.
Besides accuracy, stability is another aspect associated with gene selection algorithms. It mainly derives from two facts: select-ing a minimum subset of genes and relatively small number of samples in data set[16,47]. To measure the stability of gene selec-tor, various metrics have been proposed. Most of them calculate the frequencies of genes occurring in the selected gene subsets (see, e.g.[16,18,46]). However, they are not suitable for ensemble gene selection, and it is unfair to evaluation the stability of ECRP with this way because its selection operation is fully random and the total number of genes is large. Like the notion of bias-variance decomposition, which is often used to measure the stability of ensemble method in machine learning community[48], we made a comparison on the stability between EGSG and ECRP by using the variance of classification accuracy. In experiments, EGSG and ECRP were conducted on data sets with different number of gene subsets 10 times and the standard deviations of accuracies are listed inTable 3.
According to the standard deviations in this table, we can con-clude that EGSG is more stable than the random one. Moreover, when the number of gene subsets (i.e., the number of base classi-fiers) near around 30, the standard deviations of EGSG on these five data sets (exceptLeukemia) drops sharply. That is to say, 30 is the turning point for the number of gene subsets in EGSG over four data sets. Additionally, another interesting fact is that the more gene subsets, the more stability of ensembles. This, however, can be interpreted by the relationship between the classification per-formance and the number of base classifiers discussed above. 4. Conclusions
In this paper, we proposed a three-stage ensemble gene selec-tion method by grouping technique for microarray data classifica-tion, i.e., grouping genes, selecting subsets and ensemble. The
simulation results on five real data sets indicate that EGSG is com-petitive and effective. Under the same context, it not only leads to better classification accuracies, but also has higher stability. How-ever, one of limitations of EGSG is that comparing with several gene selection methods, it tends to choose more genes than mRMR (e.g. theLeukemiadata set in our experiments). Additionally, the optimal value of parametert (i.e., the selection bound of genes) is hard to be determined in advance. Thus, our future work will be dedicated to cope with these issues. Besides, we will further val-idate the performance of EGSG on more data sets and under the conditions of bootstrap and re-substitution sampling.
Acknowledgments
The authors are grateful to anonymous referees for valuable and constructive comments. This work is supported by the Doctor Point Founds of Educational Department (20060183044), the National NSF of China (60873044) and Science Foundation for Young Teach-ers of Northeast Normal UnivTeach-ersity (20081003).
References
[1] Golub TR, Slonim DK, Tamayo P, Huard C, Gaasenbeek M, Mesirov JP, et al. Molecular classification of cancer: class discovery and class prediction by gene expression monitoring. Science 1999;286:531–7.
[2] Larrañaga P, Calvo B, Santana R, Bielza C, Galdiano J, Inza I, et al. Machine learning in bioinformatics. Brief Bioinform 2006;7:86–112.
[3] Dupuy A, Simon RM. Critical review of published microarray studies for cancer outcome and guidelines on statistical analysis and reporting. J Natl Cancer Inst 2007;9:147–57.
[4] Boulesteix AL, Strobl C, Augustin T, Daumer M. Evaluating microarray-based classifiers: an overview. Cancer Inform 2008;6:77–97.
[5] Natsoulis G, Ghaoui LE, Lanckriet GRG, Tolley AM, Leroy F, Dunleo S, et al. Classification of a large microarray data set: algorithm comparison and analysis of drug signatures. Genome Res 2005;15:724–36.
Table 3
The standard deviations of 3NN with EGSG and ECRP conducted on five data sets 10 times.
2 4 6 8 10 12 14 16 18 20 22 24 Breast EGSG 1.75 2.57 1.67 1.95 1.77 1.74 1.42 1.01 1.20 1.13 1.40 1.15 ECRP 3.64 4.40 3.97 4.20 3.02 3.30 3.10 1.90 3.45 4.14 3.78 3.36 CNS EGSG 3.96 4.33 3.00 2.71 2.60 3.06 3.08 3.16 3.86 3.64 1.70 1.71 ECRP 7.39 6.40 6.28 8.37 6.67 5.92 5.07 4.31 3.67 3.58 4.31 4.56 Colon EGSG 2.50 1.52 1.64 2.10 1.29 1.34 1.34 1.45 1.26 1.41 1.03 1.97 ECRP 4.09 4.19 3.37 3.90 4.88 5.86 5.73 5.50 4.85 4.23 4.67 5.97 Leukemia EGSG 0.69 0.56 0.42 0.00 0.00 0.00 0.00 0.00 0.00 0.42 0.42 0.00 ECRP 7.08 6.53 3.99 2.50 2.22 2.55 2.06 2.33 1.76 1.86 1.96 1.45 Prostate EGSG 1.98 1.32 1.55 1.48 0.99 0.96 0.98 0.90 0.90 0.63 0.63 0.65 ECRP 4.21 4.49 3.43 3.56 2.80 3.28 3.19 3.80 2.68 3.03 3.01 2.42 26 28 30 32 34 36 38 40 42 44 46 48 Breast EGSG 1.05 1.24 1.31 0.92 0.80 0.92 0.81 0.81 0.65 0.56 0.72 0.66 ECRP 4.07 3.57 4.17 4.38 3.89 3.33 3.43 3.48 3.43 3.39 3.89 3.57 CNS EGSG 1.89 2.17 2.11 1.89 1.38 2.03 1.33 1.17 1.83 1.89 1.80 2.01 ECRP 3.59 4.73 4.01 3.83 4.29 4.64 3.93 3.14 4.33 3.87 2.29 2.81 Colon EGSG 1.62 1.97 1.91 1.07 1.21 1.07 1.26 1.26 1.45 1.08 1.07 1.07 ECRP 5.46 5.20 5.45 4.09 4.14 3.94 3.71 3.49 2.55 3.23 2.81 3.34 Leukemia EGSG 0.00 0.00 0.00 0.00 0.00 0.00 0.00 0.00 0.00 0.00 0.00 0.00 ECRP 1.50 1.89 1.65 1.94 1.81 1.25 1.50 1.50 1.36 1.25 1.45 1.52 Prostate EGSG 0.63 0.65 0.65 0.48 0.49 0.45 0.63 0.48 0.65 0.48 0.48 0.48 ECRP 2.25 2.90 2.60 2.63 1.76 1.82 2.28 1.98 2.28 2.30 1.85 2.40
[6] Somorjai RL, Dolenko B, Baumgartner R. Class prediction and discovery using gene microarray and proteomics mass spectrometry data: curses, caveats, cautions. Bioinformatics 2003;19:1484–91.
[7] Saeys Y, Inza I, Larrañaga P. A review of feature selection techniques in bioinformatics. Bioinformatics 2007;23:2507–17.
[8] Hilario M, Kalousis A. Approaches to dimensionality reduction in proteomic biomarker studies. Brief Bioinform 2008;9:102–18.
[9] Nam D, Kim SY. Gene-set approach for expression pattern analysis. Brief Bioinform 2008;9:189–97.
[10] Ding C, Peng H. Minimum redundancy feature selection from microarray gene expression data. J Bioinform Comput Biol 2005;3:185–205.
[11] Shen Q, Shi W, Kong W. New gene selection method for multiclass tumor classification by class centroid. J Biomed Inform 2009;42:59–65.
[12] Zhou X, Tuck DP. MSVM-RFE: extensions of SVM-RFE for multiclass gene selection on DNA microarray data. Bioinformatics 2007;23:1106–14. [13] Yeh J-Y. Applying data mining techniques for cancer classification on gene
expression data. Cybern Syst 2008;39:583–602.
[14] Zhu Z, Ong Y-S, Dash M. Markov blanket-embedded genetic algorithm for gene selection. Pattern Recognit 2007;40:3236–48.
[15] Au W-H, Chan KCC, Wong AKC, Wang Y. Attribute clustering for grouping, selection, and classification of gene expression data. IEEE/ACM Trans Comput Biol Bioinform 2005;2:83–101.
[16] Yu L, Ding C, Loscalzo S. Stable feature selection via dense feature groups. In: Proceeding of the 14th ACM SIGKDD international conference on knowledge discovery and data mining. Las Vegas, USA: ACM; 2008. p. 803–11. [17] Boulesteix A-L, Porzelius C, Daumer M. Microarray-based classification and
clinical predictors: on combined classifiers and additional predictive value. Bioinformatics 2008;24:1698–706.
[18] Díaz-Uriarte R, de Andrés SA. Gene selection and classification of microarray data using random forest. BMC Bioinform 2006;7:3.
[19] Moon H, Ahn H, Kodell RL, Baek S, Lin C-J, Chen JJ. Ensemble methods for classification of patients for personalized medicine with high-dimensional data. Artif Intell Med 2007;41:197–207.
[20] Cho S-B, Won H-H. Data mining for gene expression profiles from DNA microarray. Int J Software Eng Knowledge Eng 2003;13:593–608.
[21] Cho S-B, Won H-H. Cancer classification using ensemble of neural networks with multiple significant gene subsets. Appl Intell 2007;26:243–50. [22] Saeys Y, Abeel T, de Peer YV. Robust feature selection using ensemble feature
selection techniques. In: Daelemans W, Goethals B, Morik K, editors. ECML/ PKDD 2008, part II, LNCS 5212. Springer; 2007. p. 313–25.
[23] Wang L, Zhou N, Chu F. A general wrapper approach to selection of class-dependent features. IEEE Trans Neural Netw 2008;19:1267–78.
[24] Okun O, Priisalu H. Dataset complexity in gene expression based cancer classification using ensembles of k-nearest neighbors. Artif Intell Med 2008. doi:10.1016/j.artmed.2008.1008.1004.
[25] Yan X, Zheng T. Selecting informative genes for discriminant analysis using multigene expression profiles. BMC Genomics 2008;9(Suppl. 2):S14. [26] Ein-Dor L, Kela I, Getz G, Givol D, Domany E. Outcome signature genes in
breast cancer: is there a unique set? Bioinformatics 2005;21:171–8. [27] Zeng XQ, Li GZ, Yang JY, Yang MQ, Wu GF. Dimension reduction with
redundant genes elimination for tumor classification. BMC Bioinform 2008;9:S8.
[28] Alexe G, Alexe S, Hammer PL, Vizvari B. Pattern-based feature selection in genomics and proteomics. Ann Oper Res 2006;148:189–201.
[29] Cover TM, Thomas JA, editors. Elements of information theory. New York: Wiley; 1991.
[30] Liu H, Sun J, Liu L, Zhang H. Feature selection with dynamic mutual information. Pattern Recognit 2009;42(7):1330–9.
[31] Forman G. An extensive empirical study of feature selection metrics for text classification. J Mach Learn Res 2003;3:1289–305.
[32] Hua J, Tembeb WD, Doughertya ER. Performance of feature-selection methods in the classification of high-dimension data. Pattern Recognit 2009;42:409–24. [33] Li T, Zhang C, Ogihara M. A comparative study of feature selection and multiclass classification methods for tissue classification based on gene expression. Bioinformatics 2004;20:2429–37.
[34] Kerr G, Ruskin HJ, Crane M, Doolan P. Techniques for clustering gene expression data. Comput Biol Med 2008;38:283–93.
[35] Yu L, Liu H. Efficient feature selection via analysis of relevance and redundancy. J Mach Learn Res 2004;5:1205–24.
[36] Dietterich T. Ensemble methods in machine learning. In: Proceedings of the 1st international workshop on multiple classifier systems; 2000. p. 1–15. [37] Tsymbal A, Pechenizkiy M, Cunningham P. Diversity in search strategies for
ensemble feature selection. Inf Fusion 2005;6:83–98.
[38] van’t Veer LJ, Dai H, van de Vijver MJ, He YD, Hart AA, Mao M, et al. Gene expression profiling predicts clinical outcome of breast cancer. Nature 2002;415:530–6.
[39] Pomeroy SL, Tamayo P, Gaasenbeek M, Sturla LM, Angelo M, McLaughlin ME, et al. Prediction of central nervous system embryonal tumour outcome based on gene expression. Nature 2002;415:436–42.
[40] Alon U, Barkai N, Notterman DA, Gish K, Ybarra S, Mack D, et al. Broad patterns of gene expression revealed by clustering analysis of tumor and normal colon tissues probed by oligonucleotide arrays. Proc Natl Acad Sci USA 1999:6745–50.
[41] Singh D, Febbo PG, Ross K, Jackson DG, Manola J, Ladd C, et al. Gene expression correlates of clinical prostate cancer behavior. Cancer Cell 2002;1:203–9. [42] Langley P, Iba W, Thompson K. An analysis of Bayesian classifiers. In:
Proceedings of the tenth national conference on artificial intelligence; 1992. p. 223–8.
[43] Kira K, Rendell L. A practical approach to feature selection. In: Proceedings of the ninth international conference on machine learning. Morgan Kaufmann; 1992. p. 249–56.
[44] Sima C, Attoor S, Braga-Neto U, Lowey J, Suh E, Dougherty ER. Impact of error estimation on feature selection. Pattern Recognit 2005;38:2472–82. [45] Yu L. Feature selection for genomic data analysis. In: Liu H, Motoda H, editors.
Computational methods of feature selection. Chapman & Hall; 2008. p. 337–53.
[46] Yang K, Cai Z, Li J, Lin G. A stable gene selection in microarray data analysis. BMC Bioinform 2006;7:228.
[47] Davis CA, Gerick F, Hintermair V, Friedel CC, Fundel K, Kuffner R, et al. Reliable gene signatures for microarray classification: assessment of stability and performance. Bioinformatics 2006;22:2356–63.
[48] Domingos P. A unified bias-variance decomposition and its applications. In: Proceedings of the seventeenth international conference on machine learning. Morgan Kaufmann, San Fransisco; 2000. p. 231–38.