http://www.sciencepublishinggroup.com/j/ijdst doi: 10.11648/j.ijdst.20200601.13
ISSN: 2472-2200 (Print); ISSN: 2472-2235 (Online)
On Modelling of Infant Mortality Rate in Nigeria with
Exponentiated Cubic Transmuted Exponential Distribution
Femi Samuel Adeyinka
Department of Mathematics, Obafemi Awolowo University, Ile-Ife, Nigeria
Email address:
To cite this article:
Femi Samuel Adeyinka. On Modelling of Infant Mortality Rate in Nigeria with Exponentiated Cubic Transmuted Exponential Distribution. International Journal on Data Science and Technology. Vol. 6, No. 1, 2020, pp. 16-22. doi: 10.11648/j.ijdst.20200601.13
Received: December 11, 2019; Accepted: December 25, 2019; Published: January 6, 2020
Abstract:
The idea of introducing extra parameters into the existing model in enhancing more flexibility is a giant stride in research. Transmutation map technique is one of the recent methods of introducing additional properties such as skewness, kurtosis and bimodality into the baseline distribution. In this article, a new exponentiated exponential distribution is developed using transmutation map. This model is referred to as exponentiated cubic transmuted exponential distribution (ECTED). The mathematical properties of the model which include survival function, hazard function, central and non- central moments, moment generating function and order statistics are established. The inherent parameters in the model are estimated using method of maximum likelihood estimation (MLE). The system of equations obtained is non-linear in parameters therefore non-linear optimization algorithms are implemented in R package. The distribution is used to model data on infant mortality rate in Nigeria. The performance of the subject model is compared with its baseline exponential distribution (ED), transmuted exponential distribution (TED), exponentiated transmuted exponential distribution (ETED) and cubic transmuted exponential distribution (CTED) using Akaike Information criterion (AIC), Corrected Akaike Information criterion (AICC) and Bayesian Information criterion (BIC). It is hope that this will serve as an alternative distribution in modelling complex real life data arising from various fields of human endeavors.Keywords: Exponentiated, Cubic, Infant Mortality, Reliability Function, Hazard Rate Function, Parameter Estimation,
Order Statistics, Transmutation1. Introduction
Exponential distribution has a lot of applications in various fields of human endeavors. The areas which include reliability analysis, biological sciences, economics, actuarial science, medicines and finance. The model has enjoyed generalizations over the years which include exponentiated exponential distribution, transmuted exponential distribution, Kw-exponential distribution, exponentiated transmuted exponential distribution to mention a few. This is to introduce flexibility into the parent model to enhance better goodness of fit in data analysis.
It worth noting that many works have been done on the transmutation of baseline distributions. Shaw et al [1] suggested a quadratic transmutation map and this was applied to exponential, uniform and normal distributions. The same map has been applied by Aryal et al [2] on the transmuted extreme value distribution, Aryal et al [3] on transmuted Weilbul distribution, Aryal et al [4] on transmuted log-logistic, Merovci et al [5] on generalized transmuted family
of distributions, Merovci et al [6] on transmuted Lindley-geometric Distribution, Merovci et al [7] on transmuted generalized Rayleigh distribution, Merovci et al [8] on transmuted Pareto distribution and Merovci et al [9] on transmuted Lindley distribution. AL-Kadim et al [10] on Cubic transmuted Weilbul distribution, Granzotto et al [11] on cubic transmuted distributions and Rahman et al [12] generalized the work of Shaw et al [1]. Others include Adeyinka et al [13] on four parameters transmuted generalized distribution, Adeyinka et al [14] on transmuted half logistic distribution, Adeyinka et al [15] on transmuted type I generalized half logistic distribution, Adeyinka [16] transmuted logistic distribution, Adeyinka [17] on type I generalized transmuted logistic distribution.
The exponentiation of transmuted distribution has been considered by Ebraheim [18] on exponentiated transmuted weibull distribution and Al-Kadim et al [19] on exponentiated transmuted exponential distribution.
distribution. A new transmuted exponential distribution will emerge having both shape and bimodality properties and it will be referred to as exponentiated cubic transmuted exponential distribution (ECTED).
2. Exponentiated Cubic Transmuted
Exponential Distribution (ECTED)
If a random variable X has exponential distribution with cumulative distribution function (cdf) and probability density function (pdf) given by
1 , 0, 00 (1)
and
, 0, 0. (2)
Using the cubic rank transmutation map in [12] given by
1 (3)
with transmutation parameters | | 1, | | 1 and 2 1. 1.
exponentiation of (3) it gives
1 , 0 (4)
with shape parameter .
The corresponding cdf and pdf of exponentiated cubic transmuted exponential distribution (ECTED) are given by
1 1 2 , 0, 0, 0 (5)
and the corresponding pdf is obtained by differentiating (5) with respect to x and it is given by
1 2 2 3 1 1 2 ",
0, 0, 0. (6)
The probability density function in (6) is called exponentiated cubic transmuted exponential distribution. When 0, 0 and 1 in (5) it reduces to the baseline exponential distribution (ED) in (1). When 0 and 1 in (5) it reduces to transmuted exponential distribution (TED). When 0 in (5) it reduces to
exponentiated transmuted exponential distribution (ETED) and when 1 in (5) it reduces to cubic transmuted exponential distribution (CTED).
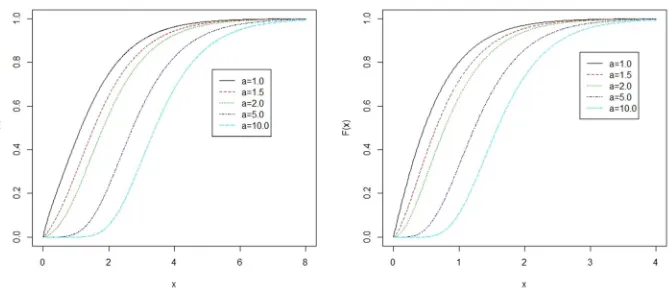
The graphs of cdf and pdf of ECTED for some selected values of parameters , , #$ λ are shown in Figure 1 and Figure 2.
Figure 1. The graphs of cdf of ECTED for various values of parameters , , #$ λ.
3. Central, Non-central Moments and Moment Generating Function
The %&' non-central moment of random variable X is given by
( )* +, * 1 − − + 2 + 2 − 3 [1 + + − 1 − + 2 +
- "
$ . (7) Using binomial expansion
[1 + + − 1 − + 2 + "= ∑ ∑ ∑ / "
0 1 2 34-0 24-"
04" 5206 /321 −1 2 3 3 + 2 2 3 + − 1 0 2 07273 . (8) By substituting (8) into (7) it becomes
∑ ∑ ∑ / "
0 1 2 34-0 24-"
04" 5206 /321 −1 2 3 3 + 2 2 3 + − 1 0 2+-, * 072737" [ 1 − − + 2 + 2 − 3 $ . (9) The integral part of (9) gives
Г *7"
9:; [072737"" < =9:;+ 072737<7 =9:;− 072737= 9:; (10)
By substituting (10) into (9)
([)* =Г *7"
9 ∑ ∑ ∑ /04", 024- 234- 0"15206 /321 −1 2 3 3 + 2 2 3 + − 10 2[072737"" < =9:;+ 072737<7 =9:;− 072737= 9:; (11)
since − 1 > 0.
The mean of ECTED is obtained by setting % = 1 in (11) to have
([) = "∑ ∑ ∑ / " 0 1 2 34-0 24-,
04" 5026 /231 −1 2 3 3 + 2 2 3 + − 1 0 2>072737"" < = ?+ 072737<7 = ?− 072737= ?@. (12)
The A&'central moment of ECTED is given by
([ − BC = ∑ 5C
*6 −B C *([ * C
*4- (13)
By substituting (11) into (13) it gives
([ − B C= ∑ ∑ ∑ ∑ / " 0 1 2 34-0 24-,
04" 5026 /231 5*C6 −1 2 3 3 + 2 2 3 + − 1 0 2 −B C * C
*4- Г *7"9 >072737"" < =9:;+
<7 =
072737 9:;− 072737= 9:;@. (14)
The variance of ECTED is obtained by setting A == in (14) to have.
([ − B = ∑ ∑ ∑ ∑ / "
0 1 2 34-0 24-,
04" 5206 /321 5*6 −1 2 3 3 + 2 2 3 + − 1 0 2 −B *
*4- Г *7"9 >072737"" < =9:;+
<7 =
072737 9:;− 072737= 9:;@. (15)
The moment generating function of ECTED is given by
D E = ([ & = ∑ &9 *! ,
*4- ([ * (16)
By substituting (11) into (16) it becomes
∑ ∑ ∑ ∑ / "
0 1 2 34-0 24-,
04" 5206 /321 −1 2 3 3 + 2 2 3 + − 1 0 2
G;&9Г *7"
* ,
*4- [072737"" < =9:;+ 072737<7 =9:;− 072737= 9:;. (17)
4. Reliability Analysis
The Survival function is given by
The survival function of ECTED is given by
H =1 1 1 2 . (18) The graphs of survival function of ECTED for different values of parameters , , #$ λ are shown in Figure 3.
Figure 3. The graphs of survival function of ECTED for different parameters , , #$ λ.
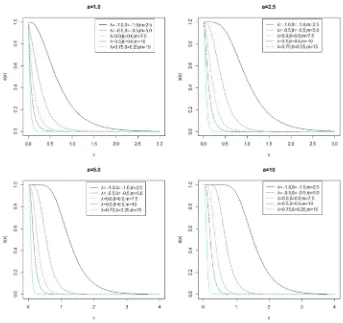
The hazard rate function is defined by
I JK .
The hazard rate function of ECTED is given by
LGMNO " < = 7 <7 = LGMN =LG?MNP "7 <7= " LGMN <7 = LG?MN7=LGQMN RG;
Figure 4. The graphs of hazard function of ECTED for different parameters , , #$ ndλ.
5. Parameter Estimation
Suppose )",),… )V are independent random variables with sample size n from ECTED. Its likelihood function is given by
W = V ∑YXZ; X∏ [V 1 2 2 X 3 X
04" ∏V04" 1 1 X 2 X
X ". (20) The log-likelihood function of (20) gives
\#W #\# ∑V04" 0 ∑V04"\# 1 2 2 X 3 X 1 ∑V04"\# 1
1 X 2 X X . (21)
By taking partial derivative of (21) with respect to each parameter and equating the result to zero the following non-linear system of equations are obtained
]^V_ ]
V ∑V \#
04" 1 1 X 2 X X 0 (22) ]^V_
]
V ∑ 0 V
04" 2 ∑ /<7 =7 =L
GMNX1 XLGMNX
O " < = 7 <7 = LGMNX =LG?MNXP V
04" 1 ∑ " < = 7 <7 = L
GMNX =LG?MNX XLGMNX
"7 <7= " LGMNX <7 = LG?MNX7=LGQMNX V
04" 0 (23) ]^V_
]< ∑
LGMNX "
O " < = 7 <7 = LGMNX =LG?MNXP V
04" 1 ∑ L
GMNX/" LGMNX1
O"7 <7= " LGMNX <7 = LG?MNX7=LGQMNXP V
04" 0 (24) ]^V_
]= ∑
`LGMNX LG?MNX " O " < = 7 <7 = LGMNX =LG?MNXP V
04" 1 ∑ L
GMNX" LGMNX7LG?MNX "7 <7= " LGMNX <7 = LG?MNX7=LGQMNX V
04" 0 (25)
The maximum likelihood estimator ab c, d, e, e f of parameters a , , , f can be obtained by solving the system of equations given in (22), (23), (24) and (25).
A non-linear optimization algorithm such as quasi-Newton algorithm can be used to numerically maximize the log-likelihood function given in (21).
6. Order Statistics
Suppose )", ) , … , )V are independent random variables which are arranged such that )" ) ⋯ )V. This arrangement is called order statistics and it is denoted by )h with the cdf and pdf of a continuous population denoted by
i and i . David [20] gave the probability density function of )h as
ij
"
k h,V h7" h " 1 V h (26)
Such that l 1, 2, … #…n
The pdf of the l&' order statistics of ECTED which is obtained by substituting (5) and (6) into (26) is given by
ij
VLGMN
k h,V h7" 1 2 2 3 1 1 2
h "
Therefore the pdf of the minimum observation of )V is obtained by setting l = 1 in (27) and this gives
i; = # [ 1 − − + 2 + 2 − 3 [1 + + − 1 − + 2 + "
m1 − [1 + + − 1 − + 2 + nV ". (28) Using binomial expansion
m1 − [1 + + − 1 − + 2 + nV "= ∑ /V "
h 1 V "
h4- −1 h[1 + + − 1 − +
2 + h (29) By substituting (29) into (28) it becomes
∑ /V " h 1 V "
h4- −1 h# [ 1 − − + 2 + 2 − 3 [1 + + − 1 − + 2 +
h7 ". (30)
On expansion
[1 + + − 1 − + 2 + h7 "= ∑ ∑ ∑ / h7 "
K 1 ^
o4-K ^4-h7 "
K4- /K^1/o^1 −1 ^ o +
2 ^ o K7^7o (31) On substitution of (31) into (30) it gives
∑ ∑ ∑ ∑ / h7 "
K 1
^ o4-K ^4-,
K4- /V "h 1/K^1/o^1 −1 h7^ o + 2 ^ o #
V "
h4- K7^7o7" [ 1 − − + 2 + 2 − 3 . (32)
The pdf of the maximum observation of )V is obtained by setting l = # in (27) and it is given by
iY = # [ 1 − − + 2 + 2 − 3 [1 + + − 1 − + 2 + V ". (33)
Similarly, on expansion (33) gives
∑ ∑ ∑ / V "
h 1
K ^4-h
K4- /hK1/K^1 −1 K ^ ^ + 2 K ^ + − 1 h K #
,
h4- h7K7^7" [ 1 − − + 2 + 2 − 3 . (34)
7. Application
The data below represent the infant mortality rate per 1,000 live births in Nigeria between 1964 and 2018.
195.0, 190.7, 186.6, 182.4, 178.2, 173.7, 169.0, 164.2, 159.0, 154.0, 149.0, 144.1, 139.5, 135.4, 131.9, 128.8, 126.4, 124.7, 123.7, 123.3, 123.3, 123.7, 124.2, 124.7, 125.0, 125.2, 125.1, 124.9, 124.5, 124.0, 123.4, 122.3, 120.9, 118.9, 116.5, 113.7, 110.9, 107.8, 104.8, 101.6, 98.6, 95.6, 92.8, 90.2, 87.9, 85.9, 84.1, 82.7, 81.5, 80.5, 79.6, 78.7, 77.9, 76.9, 75.7.
Data source: www.data.unicef.org
The results from quasi Newton algorithm implemented in R package are shown in table 1. The table shows the performance of ECTED compared with ED, TED, ETED and
CTED using Akaike Information criterion (AIC), Corrected Akaike Information criterion (AICC) and Bayesian Information criterion (BIC).
pqr = 2s − 2WW, pqrr = pqr + V 3 "3 37"
and
tqr = 2log # − 2WW.
Where k is the number of parameters in the model, n is the sample size and LL is the maximized value of log likelihood function.
Table 1. The Results of the Analysis.
Model Estimates -LL AIC AICC BIC
ED =0.008 309.42 620.84 620.92 626.85
TED =1.469 =0.421 302.51 609.02 609.25 613.04
ETED =1.931 =0.496 =1.274 295.11 596.22 596.69 598.23
CTED =2.451 =-0.211 =-0.624 291.63 589.26 589.73 591.27
ECTED =3.015 =1.492 =-0.256 =-0.717 275.87 559.74 560.54 559.75
It is observed from table 1 that ECTED performs better than other models.
8. Conclusion
A new exponentiated transmuted exponential model from cubic transmutation map which is called exponentiated cubic
literature. The results gotten from this work can be used in these field and other related disciplines. Further research can be made on the subject model especially in the area of applicability in other related fields.
References
[1] Shaw, W. T, and Buckley, I. R. (2009). Alchemy of Probability Distributions: Beyond Gram-Charlier and Cornish -Fisher Expansions, and Skewed- kurtotic Normal Distribution from a Rank Transmutation Map. arxivpreprint arxiv: 0901. 0434.
[2] Aryal, G. R, and Tsokos, C. P. (2009). On the transmuted extreme value distribution with application. Nonlinear Analysis: Theory, Methods and Application. 71 (12), el401-el407.
[3] Aryal, G. R, and Tsokos, C. P. (2011). Transmuted Weilbull distribution: A generalization of Weilbull probability distribution. European Journal of Pure and Applied Mathematics. 4 (2), 89-102.
[4] Aryal, G. R. (2013). Transmuted log-logistic distribution. Journal of Statistics Applications and probability. 2 (1), 11-20. [5] Merovci, F., Alizadeh, M., and Hamedani, G. (2016). Another Generalized Transmuted Family of Distributions: Properties and Applications. Austrian Journal of Statistics. 45, 71-93. [6] Merovci, F., Elbatal, I. (2014). Transmuted Lindley-geometric
Distribution and its Applications. Journal of Statistics Applications and Probability. 3 (1), 77-91.
[7] Merovci, F. (2014). Transmuted Generalized Rayleigh Distribution. Journal of Statistics Applications and Probability. 3 (1), 9-20.
[8] Merovci, F., Puka, L. (2014). Transmuted Pareto Distribution. Probstat. 7, 1-11.
[9] Merovci, F. (2013). Transmuted Lindley Distribution. International Journal of open Problems in Computer Science and Mathematics. 6 (2), 63-72.
[10] AL-Kadim, K. A. and Mohammed, M. H. (2017). The cubic transmuted Weibull distribution. Journal of University of Babylon, 3: 862876.
[11] Granzoto, D. C. T., Louzada, F., and Balakrishnan, N. (2017). Cubic rank transmuted distributions: Inferential issues and applications. Journal of statistical Computation and Simulation.
[12] Rahman M. M, Al-Zahrani B, Shahbaz M. Q (2018). A general transmuted family of distributions. Pak J Stat Oper Res 14: 451-469.
[13] Adeyinka F. S, and Olapade, A. K. (2019). On Transmuted Four Parameters Generalized Log-Logistic Distribution. International Journal of Statistical Distributions and Applications. 5 (2): 32-37.
[14] Adeyinka F. S, and Olapade A. K. (2019). A Study on Transmuted Half Logistic Distribution: Properties and Application. International Journal of Statistical Distributions and Applications. 5 (3): 54-59.
[15] Adeyinka F. S, and Olapade, A. K. (2019). On the Flexibility of a Transmuted Type I Generalized Half-Logistic Distribution with Application. Engineering Mathematics. 3 (1): 13-18.
[16] Adeyinka F. S. (2019). On the Performance of Transmuted Logistic Distribution: Statistical Properties and Application. Budapest International Research in Exact Sciences (BirEx) Journal. 1 (3): 34-42.
[17] Adeyinka, F. S. (2019). On the Tractability of Transmuted Type I Generalized Logistic Distribution with Application. International Journal of Theoretical and Applied Mathematics. 5 (2): 31-36.
[18] Ebraheim, A. E. N. (2014). Exponentiated transmuted weibull distribution. International Scholarly and Scientific Research & Innovation, 8 (6), 903-911.
[19] Al-Kadim K. A, Mahdi A. A. (2018). Exponentiated transmuted exponential distribution. Journal of Babylon University/Pure and Applied Sciences, 26 (2), 78-90.