for Oil and the Oil Products Market
*MA R I A DO R O Z H K I N A* *
Summary: This article discusses the important issue of
the development of the global market of oil and oil prod-ucts. It offers an overview of how this market was formed and its current status, classification, location and po-tential of countries in the oil and oil processing busi-ness. It analyzes the Ukrainian oil products market. The article discusses the shortcomings and strategic areas for the development of Ukraine’s oil transport system. It presents an optimum method for creating integration groups in order to develop the oil processing business in Ukraine for the future. The article considers the main trends and outlines development prospects for the global oil and oil products market.
Key words: oil and oil products market, alternative types
of fuel, OPEC member states, Ukrainian oil transportation system, integration groups, oil and oil processing busi-ness.
Introduction
The development of world oil and oil products markets has featured various cycles: rises, crises and falls. A review of these cycles helps to iden-tify problems and forecast prospects for such mar-kets. Oil crises have lead to the rise of prices for
* This article was translated from its original in Ukrainian.
** Maria Dorozhkina is a postgraduate student in the Department of International Management at
crude oil. In order to address the consequences of price fluctuations, it has been necessary to develop the oil production industry and facilitate integra-tion processes.
The level of development of any country is closely connected to energy consumption. Oil is the main energy source for many industries, and its share in the total consumption of power resources is regularly growing. Oil production capacities should increase significantly to satisfy the expected growth in consumption.
The main trends and prospects for the global oil and oil products market are considered based on an analysis of specific features of their formation and current status.
Ukraine has quite an advantageous geopolitical position as a transit country and has a developed oil transport system. Measures to diversify oil sources should be viewed as the key component that ensures Ukraine’s national security and facili-tates stability and modernization of the fuel and oil industry. The construction of the Brody– Plotsk–Gdansk oil pipeline should be finished and the Euro-Asian Oil Transportation Corridor (EAOTC) should be phased in to ensure oil transportation from Caspian and Persian Gulf countries.
Focusing on issues in Ukraine’s oil transport system has determined the main strategic trends of its development and allowed us to identify the opti-mum way for integrating the oil and oil processing business in Ukraine.
Specific aspects in the formation of the global oil and oil products markets
B.C.1 The word ‘oil’ (‘nafta’ in Ukrainian) derives from the Indo-European word ‘nafata’, which means ‘spilling’.2 The modern oil and gas industry began to develop rapidly in the end of the 1860s, when the drilling of oil wells began.
Undeveloped markets, a poor transportation net-work, and unstable relations between companies en-couraged vertical integration of oil companies, and stimulated the modernization of production, sale and market operations. In late 20th century, oil depos-its were discovered in more than 80 countries. Gov-ernment oil companies had leading positions in the world, but private companies also operated on the oil market (Table 1).
Table 13. World leading oil companies at the end of the 20th century (except the former USSR countries)
№ Company Country Owner
1 Saudi Aramco Saudi Arabia Government
2 Exxon Mobil U.S. Open Stock Company
3 PDVSA Venezuela Government
4 NIOC Iran Government
5 Royal Dutch / Shell U.K. / Netherlands Open Stock Company
6 BP U.K. Open Stock Company
7 Pemex Mexico Government
8 Pertamina Indonesia Government
9 TotalFinaElf France Open Stock Company
10 KPC Kuwait Government
11 Sonatrach Algeria Government
1 Energetika: istoriya, nastoyascheye i buduscheye. V. 1. Ot ognia i vody k elektrichestvu, by V.I.
Bondarenko, G.B. Varlamov, I.A. Volchyn et al., Kyiv, 2005. p. 199-200. [Energy: Past, Present and Fu-ture, volume 1, From Fire and Water to Electricity]
2 Energetika: istoriya, nastoyascheye i buduscheye. V. 1. Ot ognia i vody k elektrichestvu, by V.I.
Bondarenko, G.B. Varlamov, I.A. Volchyn et al., Kyiv, 2005, p. 199-200. [Energy: Past, Present and Fu-ture, volume 1, From Fire and Water to Electricity] 3
№ Company Country Owner
12 PetroChina China Government
13 Petrobras Brazil Government
14 Chevron U.S. Open Stock Company
15 Texaco U.S. Open Stock Company
16 Adnoc U.A.E. Government
17 ENI Italy Open Stock Company
18 Repsol YPF Spain Open Stock Company
19 INOC Iraq Government
20 Libya INOC Libya Government
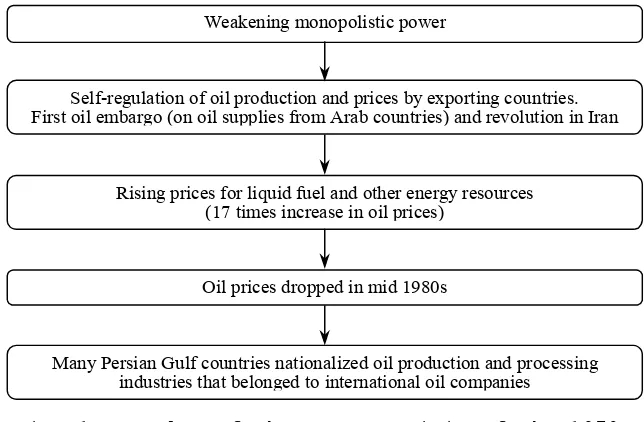
The world oil market survived three major crises: the energy crisis of 1929—32 (resulting in the Great Depression), the energy crisis from 1973 to the early 1980s (called the Great Crisis), and the 1979— 82 crisis (quite a serious one on its own terms but overshadowed by the previous crisis).4 The energy crisis in the 1970s changed the situation on the oil market (Fig. 1.)
4
Self-regulation of oil production and prices by exporting countries. First oil embargo (on oil supplies from Arab countries) and revolution in Iran
Weakening monopolistic power
Rising prices for liquid fuel and other energy resources (17 times increase in oil prices)
Oil prices dropped in mid 1980s
Many Persian Gulf countries nationalized oil production and processing industries that belonged to international oil companies
Fig. 1. Results of the energy crisis of the 1970s
Since the late 1970s, oil has been gradually re-placed by cheaper natural gas and coal in fuel and power balances. Reduced consumption of oil was ac-companied by lower oil production and exports, a de-creased role of OPEC in regulating oil supplies to the world market and dropping oil prices. New oil markets with long term supplies have appeared. Oil markets globalized and the quality of oil stabi-lized. A relatively small number of companies oper-ated in the oil and oil processing business due to the high cost of access to this market.
The oil share of total energy consumption was constantly growing; the oil share in the world en-ergy consumption was 3 % in 1900, and grew to 5 % in 1914, 17.5 % in 1939, 41.5 % in 1972, and almost 65 % in 2000. However, the oil share in the world demand for energy resources may drop to 38.8 % by 2020.5
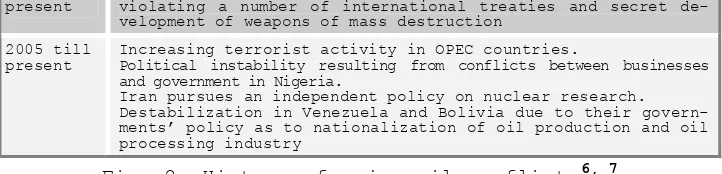
The unique nature of oil as a strategic product often causes military conflicts, trade wars and dis-putes between countries (Fig. 2).
5
1914—1918 First World War (later called the first ‘motor war’). Russia nationalized oil companies, including foreign companies 1938 Oil was the reason for ‘trade wars’. Mexico nationalized the
property of British and American oil companies, and the United States and the United Kingdom immediately imposed eco-nomic sanctions against Mexico (in particular, the U.S. re-fused to buy Mexican silver)
1939—1945 WWII (some historians call it ‘the first oil war’). Gaining access to Soviet oil deposits was one of the reasons for Ger-many’s aggression against the USSR
1951—1953 An attempt to nationalize the Iranian oil industry
1971 Iran and Iraq are on the verge of war. Iraq broke off diplomatic relations with Iran when the latter established its sovereign rule over Abu Musa Island and Tayib Islands in Ormuzd Channel through which countries of Persian Gulf exported the lion’s share of their oil
1973 The first oil embargo. Syrian and Egyptian troops attacked Is-rael. Arab oil exporting countries began to reduce their oil production every month by 5 % and banned any export of oil to the countries that supported Israel (U.S., Netherlands, Portu-gal, South Africa and Rhodesia (Zimbabwe)). World oil prices went up.
Tensions over Spratli Archipelago in the Pacific Ocean (a group of 100 islands and reefs in the South China Sea where high qual-ity oil deposits were discovered)
1974—1975 The United Nations passed a resolution calling for a new in-ternational economic order («resources, trade and markets will be distributed equally»). Most Arab countries agreed to lift embargo.
A serious economic crisis broke out in North American and West European countries as well as in Japan and Taiwan. The United States established a strategic oil reserve.
Iraq and Iran reached an agreement by which Iran granted some territorial concessions and benefits to Iraq and normalized bilateral relations.
1979 Islamic Revolution in Iran.
Iran turned from the United States’ key strategic partner in the Persian Gulf into its opponent
1980 Iraq attacked Iran.
Oil prices dropped. An economic crisis in the countries that received profits from oil sales
1983—1985 Official reestablishment of relations between the United States and Iran.
World oil prices went up from 13 to 34 dollars per barrel in two years
1986—1988 ‘Tanker war’ between Iraq and Iran
1990 Iraq invaded Kuwait. The United Nations imposed sanctions against Iraq. Coalition forces (U.S. troops forming the main component) crushed the Iraqi army and liberated Kuwait. World oil prices plummeted
1993 The first use of the U.N. ‘oil weapon’ as the largest inter-national organization imposed a ban on oil import to Haiti after the next coup there
1994 The war in Chechnya began (for control of oil transport routes through Caucasus)
present violating a number of international treaties and secret de-velopment of weapons of mass destruction
2005 till
present Increasing terrorist activity in OPEC countries. Political instability resulting from conflicts between businesses and government in Nigeria.
Iran pursues an independent policy on nuclear research. Destabilization in Venezuela and Bolivia due to their govern-ments’ policy as to nationalization of oil production and oil processing industry
Fig. 2. History of major oil conflicts6, 7
Therefore, as the oil demand grows in the world economy, more conflicts break out between countries for possession and control of oil deposits and oil transportation routes.
Positions of countries in the world oil market
The level of development of any country depends a lot on energy consumption. Today, oil remains the dominant energy source for many industries. This ar-ticle focuses on the following key cycles in the oil and oil products markets: exploration (geological, seismic), drilling (engineering — building drilling platforms), oil transportation (oil pipelines, sea transport, tankers), oil storage (oil storage tanks), oil processing and oil products storage (oil refineries, petrochemical plants, oil lubricant plants), fuel transportation and distribution, and oil products sales. We divided countries into import and export countries and the countries that use both their own and imported oil resources (for instance, the United States, Canada, Ukraine) (Table 2).
Table 2. Export/import distribution of countries on the oil and oil products market
Importing countries Exporting countries
China Russia
India Kazakhstan
Turkey Uzbekistan
6 From www.media.topping.com.ua/news/society/2005/04/20/503983.html (Neftianye voiny ХХ
veka, in Podrobnosti, 20.04.05) [Oil Wars of the 20 century, in Details]th
7 Braginskiy O. B., Shlihter E. B. Mirovaya neftepererabotka. Ekologicheskoye izmerenie, Мoscow,
Importing countries Exporting countries
Georgia Turkmenistan
Armenia Kyrgyzstan
Greece Tajikistan
Macedonia Azerbaijan
Albania Afghanistan
Montenegro Pakistan
Serbia Iran
Bulgaria Iraq
Romania United Arab Emirates
Moldova Oman
Hungary Saudi Arabia
Croatia Kuwait
Bosnia and Herzegovina Syria
Slovenia Israel
Slovakia Jordan
Czech Republic Lebanon
Poland Egypt
Ukraine Sudan
Belarus Libya
Lithuania Chad
Latvia Nigeria
Estonia Algeria
Austria Morocco
Germany Mauritania
Switzerland Mali
Italy Norway
Cyprus Denmark
Portuguese U.K.
Belgium Venezuela
Luxemburg Qatar
Netherlands Indonesia
France Gabon
Importing countries Exporting countries
Ireland Bolivia
Sweden Finland Australia Japan
For several decades, oil was the major source of primary energy. Growth of the global economy will increase demand for many types of raw material, with oil in the lead in this regard. Heating needs, elec-tricity, transportation, the level of economic de-velopment, and climate conditions of a country play a key role in shaping the demand for oil products. The demand is affected by the cost of oil explora-tion and manufacturing of oil products, the level of technology, regulations, and price fluctuations. De-veloped countries normally consume more than less developed countries, but oil demand in developing countries is significantly increasing (Fig. 3).
6.3 40.6 47.7 6.7 46.3 50.1 7.2 51.6 52.2 7.6 57.0 54.6
2010 2015 2020
2025 Transitioneconomies
Developing countries
Developed economies
Fig. 3. Forecasted oil consumption (million barrels per day)8
8
Oil demand in industrial regions will increase primarily due to the growing demand for oil products in the transportation sector which has almost no economically competitive alternative types of fuel. In developing countries, oil demand will increase in all consumption sectors (use of diesel engines for power generation, and increased demand for raw mate-rials in petrochemical industry).
The general consumption of power will increase approximately by 50 % from 2000 to 2020 (it in-creased by 34 % from 1980 to 2000)9; oil will occupy an increasingly greater share in the world energy balance. To satisfy the expected growth in demand, the world market will need to significantly increase oil production capacities by approximately 44 mil-lion barrels per day above the present level.10 The major part of additional demand will be satisfied by OPEC producers; however, it is expected that oil supplies from other countries will also be quite competitive due to increased production in the Cas-pian basin, development of offshore resources in Latin America and deep-sea drilling in Western Af-rica. According to estimates of the International Energy Agency (IEA), some 200 billion dollars need to be invested in oil production annually to expand it at pace with the growing demand; however, the real investment falls short of this estimate by 15 %—17 %.11
By the end of the 20th century, the share of oil on the world market of primary energy resources reached 40 %, more specifically — 44 % in developed countries, 42 % in developing countries, and 24 % in Central and East European countries, including the former USSR republics.12 The United States and Asian
9 From www.from-ua.com/politics/424d4a5318482/ (Kontury mirovogo buduschego. Doklad po
«Proektu-2020» Natsionalnogo razvedyvatelnogo soveta SShA). [Contours of the global future. Report on Project 2020 National Intelligence Council of the USA]
10 Rychik V. Energoyomkostyu po potrebitelyam. Prognoz mirovogo potrebleniya energii,
Toplivno-energeticheskiy kompleks, 2005, No. 1, p. 28. [Knowledge of Energy for Users. Prognosis of global en-ergy requirements. Fuel Enen-ergy Complex] 11
Tarnavskiy V. Zavershylsia unikalnyi god. Mirovoi rynok nefti v 2004 godu: itogi, tendentsyi, per-spektivy, in Toplivno-energeticheskiy kompleks, 2005, No. 1, p. 48. The end of a unique year. Global oil market in 2004; conclusions, tendencies and perspectives. Fuel Energy Complex]
12 Rychik V. Energoyomkostyu po potrebitelyam. Prognoz mirovogo potrebleniya energii,
countries (primarily China and India) are responsi-ble for almost 60 % of the expected increase in con-sumption (by 1.8 %—2 % in 2006)13. Industrial coun-tries continue to use the main portion of the world oil products. Developing countries are quickly catching up (their consumption equaled to 64 % of the demand of the Western countries in 2001 and it will increase to 94 % of the demand forecasted for the industrial countries by 2025).14
The United States steadily retain their share (about 25 %) of the world oil consumption. Depend-ence of the United States on oil supplies from other countries makes it more vulnerable as the competi-tion for reliable sources of power supply grows and the risk of interrupting supplies from oil and gas exporting countries increases. In 2004, India demon-strated a rapid growth of oil consumption by making its greatest leap in demand in the past four years (its share of the world consumption was 3.22 %). A significant role of China on the oil market is dem-onstrated by the fact that its share increased from 3.5 % to 8.3 % in the last 15 years and is getting close to 9 % in 2006.15, 16 (Fig. 4).
As a rule, consumption drops whenever oil prices go up rapidly (for instance, the consumption of oil products went down by 15 % in France in 1979-81 as oil prices went up by 3.5 times for the same pe-riod).17 The cost of oil went up by 42 % in 200518 and it is expected that the price may be some 100 dollars per barrel by the end of 2006. Profits from high oil prices allowed Saudi Arabia and other
ex-13 From iee.org.ua/ru/detailed/prognoz/476 (Inozemtsev V. VVP stran mira: Ekonomika Azii budet
faktorom globalnoi stabilnosti v 2006 g., 20.02.06) [GDP in the world: Asian economy as a factor in global stability in 2006]
14 Rychik V. Energoyomkostyu po potrebitelyam. Prognoz mirovogo potrebleniya energii,
Toplivno-energeticheskiy kompleks, 2005, No. 1, p. 28 . [Knowledge of Energy for Users. Prognosis of global en-ergy requirements. Fuel Enen-ergy Complex] 15
Gusak L. Mirovoi rynok nefti: suschestvuyet li predel rosta tsen? In Gazeta «2000». 23.09.2005. [The Global Oil Market: Is there a limit to the price increases? ]
16 From www.eia.doe.gov (Energy Information Administration — official energy statistics from the
U.S. Government). 17
Burlaka G. O prichinah krizisnyh yavleniy na rynke nefteproduktov Ukrainy, in Zerkalo nedeli, 25.06.05 — 01.07.05, No. 24 (552). [Reasons for the phenomena of crises in the petroleum products market in Ukraine]
18 From iee.org.ua/ru/detailed/prognoz/476 (Inozemtsev V. VVP stran mira: Ekonomika Azii budet
porters to keep living standards in their countries from dropping.
49.9%
19.3% 30.8%
Major consumers: United States, China, Japan, Germany, Russia, India (from 3% to 25%)
Secondary consumers: South Korea, Canada, France, Mexico, Italy, Brazil, United Kingdom, Saudi Arabia (from 2% to 3%)
Other consumers: Spain, Iran, Indonesia, Netherlands, Taiwan, Thailand and other (up to 2%)
Fig. 4. Shares of countries in the world oil consumption (in 2004)19, 20
Almost 60 % of the world oil demand is generated by member states of the Organization for Economic Cooperation and Development (OECD) and the largest oil producers (Middle East countries) — each with 5.7 % of the demand, and Saudi Arabia alone — 1.7 %. Among OECD member states, the rate of GDP growth and industrial production is much higher than the in-crease in consumption of oil products in general or their individual types in particular.21 The leading OECD countries created a modern oil refining indus-try with the technology that meets high resource saving requirements and environmental safety stan-dards. Insignificant growth in the consumption of oil products in these countries is satisfied due to reserve production capacities of primary and ad-vanced oil processing facilities, and any temporary deficit is covered with available oil reserves.
19 Gusak L. Mirovoi rynok nefti: suschestvuyet li predel rosta tsen? In Gazeta «2000». 23.09.2005.
[The Global Oil Market: Is there a limit to the price increases? ]
20 From www.eia.doe.gov (Energy Information Administration — official energy statistics from the
U.S. Government).
21 Burlaka G. O prichinah krizisnyh yavleniy na rynke nefteproduktov Ukrainy, in Zerkalo nedeli,
For instance, Germany, which is almost 100 % de-pendent on imports of oil and oil products, has the Oil Reserves Union.22 Each company, which produces or imports at least one ton of oil products, partici-pates in creating oil reserves and automatically be-comes a member of this union and pays membership fees, while the tax administration ensures compli-ance. The fee is a sort of tax, but a company is en-titled to a respective portion of oil reserves in case of oil crisis in return for participating in the costs of establishing oil reserves. Traders can in-clude this fee in their end prices and, therefore, the consumers will pay it. This model guarantees that all oil companies pay for the creation of reserves proportionally to the volumes of trade in oil prod-ucts. The Oil Reserves Union and its reserves are managed mainly by representatives of oil business, and representatives of oil companies have the major-ity of votes in the Board of Directors.
60.8% 21.9%
17.3%
Major production volumes: Saudi Arabia, Iran, Kazakhstan, Canada, China, Mexico, Norway, Russia, United States (from 5% to 14%)
Small production volumes: Algeria, Venezuela, Iraq, Kuwait, Libya, Nigeria, U.A.E. (from 2% to 4%)
Other production (up to 2%)
Fig. 5. Shares of countries in the world oil production (as of 01.01.05 р.) 23, 24, 25
22 Siromaha A. Kak dolzhny sozdavatsia neftianye rezervy: Opyt Germanii, in Zerkalo nedeli,
04.06.05–10.06.05, No. 21 (549). [How should petroleum reserves be created: The Experience Of Ger-many] 23
More difficult access for international oil com-panies to major raw resources may limit investment in oil production: many regions (for instance, the Caspian Sea, Venezuela, Western Africa, South China Sea), which are viewed as important resources for increased oil production capacities, are located in areas of high political or economic risks. Such tra-ditional oil suppliers as Middle Eastern countries also become less stable. Saudi Arabia has the larg-est share of the world oil production — 13.9 % (Fig. 5).26
8,3 10,6 11,1 13,4 14,9 16,721,3 38,4 42
66,5 67,8 70,883,6 88,7
120 128 129
0 20 40 60 80 100 120 140 Peri o d ( y ea rs) N or w ay Me xi co U .S . Chin a Ca na da A lg er ia Ru ss ia N ig er ia Qa ta r Li by a Sa ud i A rab ia V ene zu el a Ka za kh st an Ira n U .A.E. Ku wa it Ira q
Fig. 6. Approximate oil reserves in relation to oil pro-duction
(as of 01.01.05) 27, 28, 29
Rapid growth of oil demand and escalation of po-litical instability in the world in relation to oil issues result in the quick exhaustion of oil sup-plies and the global economy may encounter the prob-lem of oil hunger. As exploration in Russia is scaled down, the explored reserves have reduced since the late 1980s, however, there was a growth trend from 2001 to 2004.30 Oil demand significantly
24
From www.eia.doe.gov (Energy Information Administration — official energy statistics from the U.S. Government).
25 Oil & Gas, in Worldwide Look at Reserves and Production, Vol. 102, No. 47, December 20, 2004,
p. 22—23. 26
From www.eia.doe.gov (Energy Information Administration — official energy statistics from the U.S. Government).
27 Gusak L. Mirovoi rynok nefti: suschestvuyet li predel rosta tsen? In Gazeta «2000». 23.09.2005.
[The Global Oil Market: Is there a limit to the price increases?] 28
From www.eia.doe.gov (Energy Information Administration — official energy statistics from the U.S. Government).
29 Oil & Gas, in Worldwide Look at Reserves and Production, Vol. 102, No. 47, December 20, 2004,
p. 22—23. 30
increased in Russia in 2004 (by 2.8 %), for the first time after the USSR’s demise. This is quite predictable as the number of vehicles in the country increased significantly in recent years. Explored oil resources in the United States have decreased dramatically in recent years due to the high costs of oil production in this country; this restrains explorations by oil companies. Oil reserves in-creased by 14 % in Venezuela in only the last five years.31 Oil supplies in Iraq will suffice for the next 129 years (first place in the world), whereas deposits in Kuwait will be depleted within approxi-mately 128 years. Over 80 % of oil supplies for the West European countries come from the North Sea de-posits.32 Interestingly, approximately 1/5 of the known world oil reserves are concentrated on conti-nental sea shelves; however, their extraction is more costly. The balance of oil reserves and annual production volumes is decreasing in Saudi Arabia (Fig. 6, Fig. 7).
Over 75 % of known world oil reserves are located in OPEC countries, 90 % of which are developing countries, although some of them, such as Saudi Ara-bia, Kuwait, United Arab Emirates, are going ahead of the leading industrial countries in terms of profit per capita due to profits from oil. It is ex-pected that over 90 % of the world oil reserves will belong to the ‘Great Five’ countries of the Persian Gulf (Saudi Arabia, Iran, Iraq, U.A.E., Kuwait), Russia, Venezuela, Libya and Mexico by 2030.33
31 Gusak L. Mirovoi rynok nefti: suschestvuyet li predel rosta tsen? In Gazeta «2000». 23.09.2005.
[The Global Oil Market: Is there a limit to the price increases?].
32 Oil & Gas, in Worldwide Look at Reserves and Production, Vol. 102, No. 47, December 20, 2004,
p. 22—23. 33
72.1% 12.1%
15.8%
Major reserves: Venezuela, Iraq, Iran, Kuwait, O.A.E., Russia, Saudi Arabia (from 6% to 22%)
Small reserves: Kazakhstan, Libya, Nigeria, U.S. (from 2% to 4%)
Other reserves: Algeria, Canada, Qatar, China, Mexico, Norway and other (up to 2%)
Fig. 7. Shares of countries in the world oil reserves (as of 01.01.05) 34, 35, 36
The global trend towards a more intense competi-tion for resources, resulting from the growing oil demand, may lead to serious disruptions in the oil supply and become a major reason for the unprece-dented use of available stock and possible destabi-lization of the world oil and oil products market. To satisfy their needs in oil products, govern-ments of oil refining countries and oil corporations need to upgrade oil refineries, use raw material of better quality, control the growth of the load ratio of production capacities, and conduct a more aggres-sive and clear policy on international trade in oil and oil products.
Alternative fuel
Oil crises have decreased the economic dependence of Western countries on oil. Most experts predict that the demand will seriously exceed the supply on the world market of carbon raw materials already by
34 Gusak L. Mirovoi rynok nefti: suschestvuyet li predel rosta tsen? In Gazeta «2000». 23.09.2005.
[The Global Oil Market: Is there a limit to the price increases?]
35 From www.eia.doe.gov (Energy Information Administration — official energy statistics from the
U.S. Government). 36
2010—2020, and the oil market will be focused on the seller’s interests even more than today.37
Western Europe and Japan have managed to raise the efficiency of power consumption due to a special tax system, and the United States succeeded in doing that by introducing standards of Corporate Average Fuel Economy (CAFE). However, the resources for increasing effectiveness and environmental safety of internal-combustion engines, at least in developed countries, have been practically exhausted. Although Larry Burns, who is responsible for innovations in General Motors, believes that their efficiency in the nearest decades can be increased by another 25 %.38 However, the growth in the number of vehicles for the same pe-riod will undermine this achievement.
Alternative types of fuel are used to decrease consumption of oil products (substituting fuel oil by coal and natural gas in electricity generation, dieselization of vehicles that normally results in reduced use of diesel fuel comparing to gasoline per 100 kilometers).
New serious raw material problems have forced coun-tries to reassess the available mineral resources and it has become clear that the available reserves of many mineral resources are tied to environmentally hazardous sources, the development of which involves environmental risks and aggravates the environmental situation in the world.39
We can distinguish among the major types of oil reserves which are not taken into account in the calculation of official world resources40:
• Heavy crude oil is extracted similarly to
regu-lar oil. Heavy crude oil variations are discovered in more than 30 countries, but approximately 90 % of these reserves are located in ‘the heavy oil belt’ of Venezuela. The reserves include 1.2 trillion bar-rels. More than one third of this oil may be
ex-37 From emigration.russie.ru/news/6/8325_1.html (Neft konchitsia ranshe, chem vy dumayete,
28.04.05). [Oil will run dry earlier: what do you think about that?] 38
Prihodko O. V poiskah sredstva ot neftianoi zavisimosti, in Zerkalo nedeli, 04.06.05–10.06.05, No. 21 (549). [The search for reducing oil dependencies].
39Ekonomika zarubizhnykh krain. Textbook by A.S. Filipenko, V.A. Verhun, I.V. Burakivsky et
al., Kyiv, Lybid, 1998.[Economies of foreign countries]. 40
tracted with the help of available technology. Heavy oil is thicker, pollutes the environment more, and requires a more complicated refining process.
• Oil can also be extracted from tar sands by way
of large open mines. The largest world resource is located in Canada (some 1.8 trillion barrels). To-day, 280–300 billion barrels can be extracted, the amount of sands equals approximately 20 % of Cana-dian oil. Oil sands production requires 10 times more power, space and water than regular oil produc-tion.
• Blackstone (shale) in great amounts is located
in environmentally important U.S. areas (Colorado, Wyoming and Utah) where it occurs at various depths. Such oil companies as Shell, Exxon and ChevronTexaco invest billions of dollars in this production. Hot water is needed for this production, which is why it is much more expensive than ordinary oil production. The possibility and efficiency of using certain fuels as an alternative to gasoline is studied in order to address the issue of oil dependency (Table 3).
Efforts of the largest oil corporations to de-velop alternative energy sources are a sign of the future outlook of such sources. However, Chi Ray-mond, who heads Exxon Mobil, is convinced that 95 % of all vehicles will have combustion engines and will work primarily on gasoline in 2030. He thinks that investment in alternative power sources is a waste of money at this time.41 According to him, oil will continue to keep its leading position for a long time while alternative renewable energy sources may become marketable only where they cannot be replaced by cheaper and, in many cases, more effective carbon raw material. Today, oil and oil products markets depend more and more on the price factor.42
41 Prihodko O. V poiskah sredstva ot neftianoi zavisimosti, in Zerkalo nedeli, 04.06.05–10.06.05,
No. 21 (549). [The search for reducing oil dependencies]. 42
Table 3. Types of fuel alternative to gasoline43, 44
Name Biofuel Natural gas Combination of hydrogen fuel and fuel cells
Description
Is obtained from agricultural prod-ucts or directly from agricultural plants. Commercial use of this tech-nology will become possible already in 2008.
The EU Parliament is now considering a directive according to which EU coun-tries will have to achieve the level of biofuel consumption that would amount to 5.75 % of the total use of gasoline and diesel fuel by 2010. This level will be achieved through use of the following forms of biofuel: pure biofuel that meets specific quality standards for transport fuel;
biofuel mixed with oil products in compliance with relevant EU norms that prescribe technical specifications for transport fuel;
liquid from biofuel, in particular ETBE (ethyl-3-butyl-ether), where the biofuel volume equals 47 %.
Among the EU countries, Germany achieved the greatest success in pro-ducing ecologically clean liquid fuel which reduces the consumption of min-eral fuel and decreases hazardous air emissions.
Experts forecast that consumption of this fuel will in-crease by 25 times by 2030. Even in that case, it will equal only 4 % of the total transport fuel consumed.
Commercial use may be realistic in the remote future. Electric power is generated by chemical reaction between hyd-rogen and oxygen in fuel cells. Byproducts in-clude heat and water.
Advantages and shortcomings
Renewable resources. Fundamental change of the existing system is not required to switch to this fuel. Bio-fuel cost is much higher compared to gasoline.
Energy consumption and environ-mental pollution involved in bio-fuel production cancel out the benefits of its use compared to gasoline.
Technology of gas conversion into liq-uid synthetic fuel (GTL — gas-to-liquids) is quite cheap and ecologi-cal.
Although natural gas is the best raw ma-terial for this pur-pose, the coal or biomass may also be processed.
This fuel may also be added in tradi-tional fuel and used in regular car en-gines.
Hydrogen may be obtained from any energy resources — from mineral resources to wind power. General Mo-tors promises to make by 2010 the first million cars that use this new technology. A network of hydrogen fuel filling sta-tions will be created by that time. The cost of this system is high, but much smaller than the funds currently spent to develop the oil industry.
42 Prihodko O. V poiskah sredstva ot neftianoi zavisimosti, in Zerkalo nedeli, 04.06.05–10.06.05, No.
21 (549). [The search for reducing oil dependencies].
44 Vodiannikov О. Polityka ES v sferi vykorystannia biologichnoho palyva: napriamy adaptatsiyi
However, John Rise, chief of General Electric’s energy division, argues that even several years ago, nobody could predict that today the company will get 2 billion dollars of profits annually from wind gen-erators which where prematurely called an outdated technology. Today, the company has invested in de-veloping fuel components as well as nuclear and so-lar energy.45
A similar position is taken by Shell and BP but the share of alternative energy sources is still very small compared to oil. ВР representatives believe that the known global oil reserves will suffice to ensure supplies for the next 40 years at the current level of consumption. Presently, the oil industry produces approximately 83 million barrels a day.46 It is expected that in the nearest future, new oil de-posits will be discovered in Azerbaijan, Angola, Al-geria, the Gulf of Mexico, and other places. Accord-ing to BP Statistical Review of World Energy 2005, with the total world consumption of oil products (ex-cept the former USSR countries) at the level of 77.028 million barrels a day in 2004, the share of middle distillate was the largest (diesel fuel, etc.) (36 %) while that of gasoline was 31.5 % and that of fuel oil was 11.8 %.47 The structure of oil products consumption improves as the share of motor fuels grows, and together with the rising world prices for oil, it stimulates the development of new innovation technology in the oil refining industry that can meet the needs of resource conservation and environmental security.
In order to address the consequences of rising oil prices, it is necessary to widen the use of innova-tions that can help explore new mineral fuel depos-its, lower production costs, improve energy conserva-tion, and help the government to create a reliable system of operational and strategic fuel reserves.48
45 Prihodko O. V poiskah sredstva ot neftianoi zavisimosti, in Zerkalo nedeli, 04.06.05–10.06.05, No.
21 (549). [The search for reducing oil dependencies]. 46
From emigration.russie.ru/news/6/8325_1.html (Neft konchitsia ranshe, chem vy dumayete, 28.04.05). [Oil will run dry earlier: what do you think about that?].
47 Burlaka G., Sherstiuk R. Peredovoi zarubezhnyi opyt, in Neftianaya ekonomiya, 2006, No. 1.
De-veloped Foreign Experiences, in Oil Economics. 48
Under conditions of rising world oil prices, interna-tional oil companies prefer to invest in the develop-ment of the production sector than in mergers and ac-quisitions as at the end of 1990s.
Oil infrastructure prospects for Ukraine as a transit country
Ukraine has six oil refineries which process oil and gas condensates and manufacture oil products (Table 4).
Table 4. Ukrainian oil refineries49,50
№ Name
Oil products market share
(as per production ca-pacity)
Government’s shares in refineries
1 Kremen-chuk 36.43 % Government’s share — 43.054 %
2 Lysy-chansk 31.27 % Fully privatized
3 Kherson 13.87 % Fully privatized
4 Odesa 7.04 % Fully privatized
5 Drohobych 6.30 % Government’s share — 25 %
6 Nadvirna 5.09 % Government’s share — 26 %
The total primary distillation capacity of the six Ukrainian oil refineries today is 51 million tons of oil per year (Fig. 8).51
49 Piriashvili B. Z., Chyrkin B. P., Chukayeva I. K. Perspektyvnyi palyvno-energetychnyi balans —
osnova formuvannia energetychnoi strategiyi Ukrainy do 2030 roku, Kyiv, Naukova dumka, 2002. [Per-spective fuel-energy balances — basic formation of an energy strategy for Ukraine until 2030].
50 Energetychna strategia Ukrainy na period do 2030 roku (materially zasidannia robochoyi hrupy
Minpalyvenergo). Кyiv, Instytut zahalnoi energetyky Natsionalnoi akademii nauk Ukrainy, 2006, p. 61— 62. [An Energy Strategy for Ukraine until 2030 (materials from the meeting of the working group of the Ministry of Fuel Energy). Kyiv: Institute of general energy. National Academy of Science of Ukraine].
51 Energetychna strategia Ukrainy na period do 2030 roku (materially zasidannia robochoyi hrupy
2,6 3,22
3,6 7,09
15,98 18,62
0 2 4 6 8 10 12 14 16 million tons per yea
18 r
Nadvirna Drohobych Odesa Kherson Lysychansk Kremenchuk
Fig. 8. Total oil refining capacity of Ukrainian oil re-fineries.
The available capacities and technical level of oil refineries today allow them to completely sat-isfy the needs of the Ukrainian economy in terms of gasoline, diesel fuel, oil fuel and over 50 other products of the oil processing and petrochemical in-dustries as well as export significant volumes of these products.
The existing pipeline system (Fig. 9) should be improved so that it meets international standards, including the use of new technology for the trans-portation of oil and oil products.
Fig. 9. Ukraine’s oil transport system52
Strategic areas of development for the oil trans-port system include the following:
• increase its transit capacity, which is of both economic and political importance to this country;
• maintain a high technical level of the system to ensure its high reliability and competitiveness;
• promote integration into the common European oil pipeline network.53, 54
In the context of the latter strategic area, Ukraine’s participation in regional integration
52 Energetychna strategia Ukrainy na period do 2030 roku (materially zasidannia robochoyi hrupy
Minpalyvenergo). Кyiv, Instytut zahalnoi energetyky Natsionalnoi akademii nauk Ukrainy, 2006, p. 64. [An Energy Strategy for Ukraine until 2030 (materials from the meeting of the working group of the Ministry of Fuel Energy). Kyiv: Institute of general energy. National Academy of Science of Ukraine].
53
Zabezpechennia energetychnoi bezpeky Ukrainy, Rada natsionalnoi bezpeky i oborony Ukrainy, Natsionalny instytut problem mizhnarodnoyi bezpeky, Кyiv: NIPMB, 2003. [Ensuring Ukraine’s energy security. National Security and Defence Council of Ukraine, National Institute for International Security Issues].
54
groups appears to be quite important. We are con-vinced that the development of the oil and oil proc-essing business in Ukraine proceeds from the forma-tion of integraforma-tion groups, when any formal agreements between countries are preceded by an ex-tensive period of international economic contacts at the level of businessmen, companies and corpora-tions. The political, legal, economic, social, cul-tural and infrastruccul-tural environment is examined, adjusted and improved through developing economic relations primarily at the corporate level. It is important that relations among countries are strengthened through the formation of integration groups, identification of priority areas, improve-ment of legislation, and clear governimprove-ment policies. Since the oil processing business is interna-tional a priori, its development in Ukraine should be facilitated through integration processes that combine the major cycles of the oil and oil products market (oil production (including domestic oil pro-duction), transportation, processing and sale of oil products). Oil processing business will develop and will be efficient if guarded against unreasonable political influence and control. Potential exporters of oil to Ukraine traditionally include Russia and Kazakhstan as well as Azerbaijan and Turkmenistan.
Today, prices for oil products in Ukraine tend to grow due to rising world prices for oil and Russian export duty, higher railway tariffs for oil trans-portation, increased seasonal demand for oil prod-ucts, etc. Creating a strategic fuel reserve may be-come a significant leveler that helps regulate fuel prices.
jan, Kazakhstan, Turkmenistan, Middle East, etc., while at the same time significantly strengthening its transit capacity between oil producing countries of the Caspian region and important sales markets in Europe. It is expected that the workload of the oil pipeline system will increase up to 65 million tons per year by 2010 and up to 70 million tons per year by 2015, and that oil transportation volumes will remain at the same level or gradually reduce in fu-ture years.55, 56
Building the Brody–Plotsk-Gdansk oil pipeline and phased implementation of the Euro-Asian Oil Trans-port Corridor (EAOTC) project are necessary to en-sure oil transportation from Caspian countries (Ka-zakhstan, Azerbaijan) and Persian Gulf countries (Iran, Iraq, etc.) up to 10 million tons by 2010 and up to 20 million tons by 2015. In the future, trans-portation volumes through the Odesa-Brody system can increase up to its designed capacity of 40 million tons per year.57 Transforming the Odesa-Brody pipe-line into a normal mode will allow it to supply oil into Ukraine from other Caspian countries as well as from Iraq, Iran, Southern African countries and other countries, and bypassing Bosporus. To ensure oil supply from Iraq, it is necessary to build the Ceyhan-Samsun pipeline in Turkey. Besides Ukraine, Black Sea countries and EAOTC participants, Poland, Slovakia, Moldova and other countries are interested in this oil pipeline. Poland, the United States, Ka-zakhstan, Azerbaijan and Croatia confirmed that they are ready to work together to implement the Odesa-Brody-Plotsk-Gdansk project in accordance with its primary purpose. Negotiations with the Czech Repub-lic and Slovakia need to be conducted. Concrete ar-rangements with potential suppliers and consumers
55 Energetychna strategia Ukrainy na period do 2030 roku (materially zasidannia robochoyi hrupy
Minpalyvenergo). Кyiv, Instytut zahalnoi energetyky Natsionalnoi akademii nauk Ukrainy, 2006, p. 65. [An Energy Strategy for Ukraine until 2030 (materials from the meeting of the working group of the Ministry of Fuel Energy). Kyiv: Institute of general energy. National Academy of Science of Ukraine].
56 Piriashvili B. Z., Chyrkin B. P., Chukayeva I. K. Perspektyvnyi palyvno-energetychnyi balans —
osnova formuvannia energetychnoi strategiyi Ukrainy do 2030 roku, Kyiv, Naukova dumka, 2002. [Per-spective fuel-energy balances — basic formation of an energy strategy for Ukraine until 2030].
57 Energetychna strategia Ukrainy na period do 2030 roku (materially zasidannia robochoyi hrupy
need to be made as soon as possible since there are alternative pipelines or projects (for instance, Burgas-Alexandropolis).
Advantages of building the Odesa-Brody pipeline today include the following:
• High competition on the part of Russian compa-nies. Caspian oil is light and sweet. It may poten-tially become a competitor to the heavier and sul-phureous Urals oil exported by Russia.
• This oil pipeline is strategic for Ukraine. Good economic value of supplies has been proven as the cost is twice as low as the cost of the traditional supply route from the Russian port of Novorossiysk.
• New opportunity to transport oil via environmen-tally safe routes will release pressure on Bosporus.
• At present, economic and financial effects can only be achieved through reverse transportation (Brody-Southern [Pivdenny] Terminal).
Disadvantages of building the Odesa-Brody pipe-line include the following:
♦There is a lack of tangible investment into con-struction of the Brody–Plotsk pipeline (the estimate is some 500 million Euros, construction period: 3-4 years). The EU promised to allocate 2 million dol-lars.58
♦Caspian oil is more expensive, all European re-fineries are adjusted to process heavy and sulphure-ous Urals oil exported by Russia.
♦Caspian countries have insufficient extracting capacities.
♦Today the focus has been made on the alternative Baku-Tbilisi-Ceyhan pipeline.
♦If the Kurkuk–Umurtalik pipeline (Turkey, area of Ceyhan Port) becomes operational, Turkey will be-come a transit country for oil supplies from both the Caspian region and the Persian Gulf into Europe. The capacity of this oil pipeline and the capability of west Turkish ports to receive tankers with the capacity of over 500,000 tons59 make investment in this route more attractive than in Odesa-Brody.
58 From http://ua.proua.com/news/2004/07/08/150928.html. 59
♦There are doubts as to whether Odesa-Brody can be filled with Azerbaijan oil.
♦The situation with the privatization of two Ukrainian refineries (in Drohobych and Nadvirna), which are able to consume oil from Odesa-Brody, brings in even more uncertainty as to the prospects for this oil pipeline.
Ukraine may risk gradually losing Russian oil transits after 2010, therefore the EAOTC is the main strategic project that can help to develop Ukraine’s transit potential. It is anticipated that the EAOTC project could be expanded to Tengiz-Brody-Plotsk-Gdansk-Vilhelmshafen. The prospects for incorporat-ing Iraq oil export projects in the EAOTC project are considered in light of arrangements between Ukraine and Poland as to the cooperation of oil and gas companies of both countries.
Trends and development prospects of the world oil and oil products market
To summarize, the following provides a check list of major trends of and prospects for the global oil and oil products market, which could affect posi-tively the energy sector in general:
• Organizational trends and related prospects: ⎯Creating a reliable system of operational and strategic reserves of oil and oil products, which would stabilize the markets of oil and oil products, help to avoid fluctuations in peak periods, and re-duce dependence on oil exporting countries.
⎯Conducting a more aggressive and clear policy on international trade in oil and oil products, further reform of the competitive oil market, which will improve economic efficiency, increase investment attractiveness, strengthen positions of transnational oil corporations which have their own refineries and distribution infrastructure, and deepen integration of oil exporting and im-porting countries.
• Technological trends and related prospects: ⎯Developing the alternative energy sector and in-creasing dependence of oil and oil products market on the price factor will change the fuel structure and energy balance.
⎯Implementing new and improving the existing technology of oil production industry, upgrading re-fineries, using raw material of better quality will improve the structure of oil products consumption and quality of oil refining in the world from 70 % to 90 %.
⎯Maximum use of advanced technology of waste-gas purification in oil refining areas will ensure ap-propriate environmental safety level and reduce haz-ardous air emissions.
• Financial trends and related prospects:
⎯Raising and streamlining financial resources, diversifying sources of oil supply will improve the system of oil transportation by pipelines, improve their flow capacity, and help to meet safety re-quirements for tankers and transportation ecology.
⎯Increasing and concentrating investments, in-vesting in technology of the oil production sector (exploration and development of sea and land oil de-posits), developing the industry on the basis of scientific research (exploration of unexplored oil deposits, developing new products, etc.). These trends will improve the efficiency of oil deposit development, and consequently decrease losses of oil resources, help explore new deposits of mineral fuel, decrease production costs, improve energy con-servation, and facilitate international corporate integration in the oil processing business.
Conclusions
• Oil crises of the 20th and 21st centuries have escalated prices for liquid fuel and other energy resources, resulting in a situation where most fund-ing was streamed in the development of the produc-tion sector and the dependency of Western economies on oil consumption reduced.
• The oil share in the total consumption of energy resources is constantly growing, and the demand tends to exceed the supply. The growth of oil con-sumption will be observed in both industrial and de-veloping countries. OPEC producers will satisfy the main part of additional demand. A significant in-crease of oil production capacities is needed to satisfy the expected growth of consumption. Alterna-tive types of fuel may help to reduce consumption of oil products.
• International oil companies may limit oil pro-duction due to lack of access to main raw material resources because of the competition for resources under conditions of growing demand and serious dis-ruptions of oil supplies. Tighter competition for resources may result in unprecedented use of oil re-sources.
• Ukraine has an advantageous geopolitical posi-tion as a transit country. The existing system of Ukraine’s oil pipelines should be improved to meet international standards. Oil supply sources should be diversified to strengthen national security and ensure stable operation and development of fuel and energy sector. Its geographic position allows Ukraine to engage various sources of oil supply via independent routes from Azerbaijan, Kazakhstan, Turkmenistan, and the Middle East, and at the same time significantly strengthen the role of Ukraine as a transit country between oil producing countries of Caspian regions and important sales markets in Europe.
processing business will develop and effectively op-erate if guarded against unjustified political influ-ence and control.
• We compiled major trends and prospects for devel-opment of the world oil and oil products market as the following characteristics:
⎯Organizational: trends — creating a reliable system of strategic reserves of oil and oil prod-ucts; conducting a clear policy on international trade in oil and oil products; further reform of the competitive oil market; prospects — stabilizing oil and oil products markets; preventing fluctuations in peak periods; reducing dependence on oil exporting countries; increasing investment attractiveness; strengthening positions of transnational oil corpo-rations; facilitating integration between oil ex-porting and imex-porting countries.
⎯Technological: trends — developing the alterna-tive energy sector; upgrading oil refineries; using raw materials of better quality; maximum involvement of upgraded technology for refining waste gases in oil refining areas; prospects — changing the ture of fuel and energy balance; improving the struc-ture of oil products consumption; increasing the depth of oil refining at world refineries from 70 % to 90 %; supporting appropriate level of environ-mental safety.
⎯Financial: trends — raising and channeling fi-nancial resources; diversifying sources of oil sup-ply; increasing and concentrating investment; tech-nological investment in the oil production sector (exploration and development of sea and land oil de-posits); prospects — improving the system of trans-porting oil via pipelines; increasing their flow ca-pacity; meeting the safety requirements for tankers and transportation ecology; improving efficiency of oil development and exploration of new oil deposits, reducing oil production cost; improving energy sav-ing; expanding international corporate integration processes in the oil processing business.
1. Braginskiy O. B., Shlihter E. B. Mirovaya nefteper-erabotka. Ekologicheskoye izmerenie, Мoscow, Academia,
2002. [Global Oil Production: Environmental Measures]
2. Burlaka G. O prichinah krizisnyh yavleniy na rynke
nefteproduktov Ukrainy, in Zerkalo nedeli, 25.06.05 —
01.07.05, No. 24 (552). [On reasons of crisis phenomenon in the market of oil products of Ukraine]
3. Burlaka G., Sherstiuk R. Metamorfozy i antipody, in
Toplivno-energeticheskiy kompleks, 2005, No. 9.
[metamor-phosis and antipodes in Fuel and Energy Complex]
4. Burlaka G., Sherstiuk R. Peredovoi zarubezhnyi
opyt, in Neftianaya ekonomiya, 2006, No. 1. Developed
Foreign Experiences, in Oil Economics
5. Ekonomika zarubizhnykh krain. Textbook by A.S.
Fili-penko, V.A. Verhun, I.V. Burakivsky et al., Kyiv,
Ly-bid, 1998.[Economies of foreign countries]
6. emigration.russie.ru/news/6/8325_1.html (Neft
kon-chitsia ranshe, chem vy dumayete, 28.04.05). [Oil will
run dry earlier: what do you think about that?]
7. Energetika: istoriya, nastoyascheye i buduscheye. V. 1. Ot ognia i vody k elektrichestvu, by V.I.
Bon-darenko, G.B. Varlamov, I.A. Volchyn et al., Kyiv, 2005. p. 199-200. [Energy: Past, Present and Future, volume 1, From Fire and Water to Electricity]
8. Energetychna strategia Ukrainy na period do 2030 roku (materially zasidannia robochoyi hrupy Minpaly-venergo). Кyiv, Instytut zahalnoi energetyky Natsionalnoi
akademii nauk Ukrainy, 2006, p. 61. [An Energy Strategy for Ukraine until 2030 (materials from the meeting of the working group of the Ministry of Fuel Energy). Kyiv: In-stitute of general energy. National Academy of Science of Ukraine]
9. Gusak L. Mirovoi rynok nefti: suschestvuyet li
pre-del rosta tsen? In Gazeta «2000». 23.09.2005. [The Global
Oil Market: Is there a limit to the price increases?]
10. iee.org.ua/ru/detailed/prognoz/476 (Inozemtsev V.
VVP stran mira: Ekonomika Azii budet faktorom globalnoi stabilnosti v 2006 g., 20.02.06) [GDP in the world: Asian
economy as a factor in global stability in 2006]
11. Kornilov I. Ye. Osoblyvosti funktsionuvannia
nafto-voho rynku Ukrainy u svitli normatyviv ES i MEA u sferi
energetychnoi bezpeky, in Strategichna panorama, 2004,
No. 1, p. 116-124. [Peculiarities of Ukraine’s oil market operation in light of ES and MEA directives on energy se-curity]
12. Malovetskiy A.V. Investitsionnaya politika
of oil corporations — regional and corporative aspects, Moscow, 2002]
13. Oil & Gas, in Worldwide Look at Reserves and Pro-duction, Vol. 102, No. 47, December 20, 2004, p. 22-23.
14. Oil and Gas: Production & Marketing, in Standard & Poor’s Industry Surveys, October 18, 2001, p. 6-23.
15. Piriashvili B. Z., Chyrkin B. P., Chukayeva I. K.
Perspektyvnyi palyvno-energetychnyi balans — osnova formu-vannia energetychnoi strategiyi Ukrainy do 2030 roku, Kyiv,
Naukova dumka, 2002. [Perspective fuel-energy balances — basic formation of an energy strategy for Ukraine until 2030]
16. Preiher D. K., Kornilov I. E. Mezhdunarodnoye
regulirovaniye neftianoho rynka i osobennosti yego
raz-vitiya v regionah mira, in Neft i gaz, 2003, No. 10, p.
74-86. [International regulation of oil market and pecu-liarities of its development in the world regions]
17.Prihodko O. V poiskah sredstva ot neftianoi
zavisi-mosti, in Zerkalo nedeli, 04.06.05–10.06.05, No. 21
(549). [The search for reducing oil dependencies]
18.R. Reinhard, R. Casadesus-Masanell, D.J. Hanson. BP
and the Consolidation of the Oil Industry, 1998–2002,
July 29, 2003, p. 1- 37.
19.Rychik V. Energoyomkostyu po potrebitelyam. Prognoz
mirovogo potrebleniya energii, Toplivno-energeticheskiy
kompleks, 2005, No. 1, p. 28 . [Knowledge of Energy for
Users. Prognosis of global energy requirements. Fuel En-ergy Complex]
20.Siromaha A. Kak dolzhny sozdavatsia neftianye
rez-ervy: Opyt Germanii, in Zerkalo nedeli, 04.06.05–
10.06.05, No. 21 (549). [How should petroleum reserves be created: The Experience Of Germany]
21.Tarnavskiy V. Zavershylsia unikalnyi god. Mirovoi
rynok nefti v 2004 godu: itogi, tendentsyi, perspektivy, in Toplivno-energeticheskiy kompleks, 2005, No. 1, p. 48.
The end of a unique year. Global oil market in 2004; con-clusions, tendencies and perspectives. Fuel Energy Com-plex]
22.Viktorov S. Energetika 2030: doroga k krizisu? in
Energeticheskaya politika Ukrainy, 2003, No. 10, p. 8-10.
[Energy 2030: Road to Crisis? in Energy policy of Ukraine]
23.Vodiannikov О. Polityka ES v sferi vykorystannia
biologichnoho palyva: napriamy adaptatsiyi natsionalnoho
zakonodavstva Ukrainy do prava ES, in Yurydychnyi
zhur-nal, 2004, No. 4. [The EU and the use of biological fuel:
24.www.eia.doe.gov (Energy Information Administration — official energy statistics from the U.S. Government).
25.www.from-ua.com/politics/424d4a5318482/ (Kontury
mirovogo buduschego. Doklad po «Proektu-2020» Natsional-nogo razvedyvatelNatsional-nogo soveta SShA). [Contours of the
global future. Report on Project 2020 National Intelli-gence Council of the USA]
26.www.media.topping.com.ua/news/society/2005/04/20/50
3983.html (Neftianye voiny ХХ veka, in Podrobnosti,
20.04.05) [Oil Wars of the 20 century, in Details] th
27.Zabezpechennia energetychnoi bezpeky Ukrainy, Rada natsionalnoi bezpeky i oborony Ukrainy, Natsionalny in-stytut problem mizhnarodnoyi bezpeky, Кyiv: NIPMB, 2003.
[Ensuring Ukraine’s energy security. National Security and Defence Council of Ukraine, National Institute for International Security Issues]