Available online on 15.06.2019 at http://jddtonline.info
Journal of Drug Delivery and Therapeutics
Open Access to Pharmaceutical and Medical Research
© 2011-18, publisher and licensee JDDT, This is an Open Access article which permits unrestricted non-commercial use, provided the original work is properly cited
Open Access
Research Article
To study the comparative dissolution profiles of sustained release tablets of
metformin hydrochloride by using various hydrophilic polymers
Sharma Diksha*
1, Dev Dhruv
1, Prasad D.N.
2, Hans Mansi
1, Sahore Ruchika
11 Department of Pharmaceutics, Shivalik College of Pharmacy Nangal, Punjab, India 2 Department of Chemistry, Shivalik College of Pharmacy Nangal, Punjab, India
ABSTRACT
In this research study an attempt was made to formulate sustained release matrix tablets of Metformin Hydrochloride as it possesses relatively shorter plasma half-life, low bioavailability. The sustained release formulations of the drug were capable of maintaining the plasma level for 8-12 hours. The overall objective of this research was to formulate the tablet by using various hydrophilic polymers i.e. Xanthan gum, Guar gum, Aloe barbadensis and Methocel K4M. Tablets were prepared by wet granulation method. In Vitro studies were performed by USP XX apparatus I, basket and the data was analyzed using zero order, first order, and Korsmeyer and Higuchi models. Nine formulations were made, out of which F-9 formulation which was composed of Aloe Barbadensis in the ratio of 1:2, with combination of other polymers (xanthan gum, gu ar gum and methocel K4 M) showed maximum drug release within 12 hours with sustained release profile because Aloe barbadensis showed maximum swelling followed by entanglement of polymers chains, thus gave maximum gel strength which provides main retarding factor for the drug release. The use of three polymers (xanthan gum, guar gum and methocel K4M) alone in the different formulations i.e. from F-1 to F-6 was not able to sustain the drug release because of their rapid solubilization in acidic pH leads to pores in the matrix, finally causes surface erosion and initial disaggregation of the matrix tablet prior to gel layer formation around tablet core causes rapid release of the drug within 1 hour as compared to F-9 formulation.
Keywords: Sustained drug delivery system, Aloe Vera, Methocel K4M, Xanthan gum, Guar gum and Metformin HCl.
Article Info:Received 01 May 2019; Review Completed 31 May 2019; Accepted 06 June 2019; Available online 15 June 2019 Cite this article as:
Sharma D, Dev D Prasad DN, Hans M, Sahore R, To study the comparative dissolution profiles of sustained release tablets
of metformin hydrochloride by using various hydrophilic polymers, Journal of Drug Delivery and Therapeutics. 2019;
9(3-s):374-385 http://dx.doi.org/10.22270/jddt.v9i3-s.2856
*Address for Correspondence:
Sharma Diksha, Department of Pharmaceutics, Shivalik College of Pharmacy Nangal, Punjab, India
INTRODUCTION
The sustained release dosage form are designed in such a way that they continuously release the drug over an extended period of time after the administration of a single dose of a dug. The basic goal of this therapy is to provide a steady state blood or tissue level which is both therapeutically effective and non-toxic for prolonged period of time and finally improves patient compliance as well as toxicity to a large extent. The basic rational of sustained drug delivery system is to alter the pharmacokinetics and pharmacodynamics of the pharmacologically active drug moieties by modifying their molecular structure or physiological parameters. Basically a sustained release oral dosage form is designed to rapidly release pre-determined fraction of the total dose (loading dose) into gastrointestinal tract, which will produce the desired pharmacological response as promptly as possible and the remaining fraction
of the total dose (maintenance dose) is then released at a
controlled rate to maintain the steady state. The controlled
release of the drug product is designed so that the release rate of maintenance dose is equal to the elimination rate. The constant blood levels can be achieved from controlled release system and the prolonged release of the dosage form reduces the fluctuation in plasma by slowing down its absorption rate so that its slower drug release rate can be
achieved as well as can be maintained [3 - 5].
two to three times a day when larger doses are required which can decrease patient compliance, thus sustained release products are needed for metformin which can prolong its duration of action, improve patient compliance and reduces toxicity of drug in the body . The natural gums are widely used in the preparation of sustained release tablets. Xanthan gum, Guar gum and Aloe Vera were the natural gums used in this research work. Xanthan gum are obtained from Xanthomonas campestris. Guar gum is derived from guar plant Cyamopsis tetragonolobus (i.e. Cluster bean), finds wide application as stabilizer and thickener in pharmaceutical industry. Aloe Vera is obtained
from the mucilage of leaves of Aloe barbadensis. These
natural gums are reported to have antidiabetic effect on humans which helps to potentiate the effect of Metformin HCl. The use of these hydrophilic polymers alone for the purpose of extending drug release for the highly water soluble drugs is restricted due to rapid diffusion of the dissolved drug through its gel network. It was found that dried mucilage of Aloe barbadensis can potentiate the antidiabetic effect to a great extent as well provides maximum sustained effect because of its excellent gelling strength [6, 7].
The main objective of the present work was to formulate the drug, Metformin with various hydrophilic natural and synthetic polymers alone or in combination. As according to BCS classification Metformin falls under the category III (High solubility and low permeability). The high solubility is the main obstacle for its sustained action and high bioavailability but low permeability potentiates its sustained action. The use of various natural polymers provides pH independent drug release. Aloe barbadensis was chosen to be best fit polymer for retarding the drug release with combination of other used polymers such as xanthan gum, guar gum and methocel K4M. These polymers used alone cause’s sudden burst release of drug because of their rapid solubilization in acidic pH and initial disaggregation of drug particles before the gel formation of the used hydrophilic polymer. Tablets were prepared by wet granulation method; this method is a process of forming granules by binding the powders together with an adhesive rather than compaction. Liquid bridges are formed between particles and tensile strength of these blends increases with the amount of liquid binder. Surface tension and capillary forces are responsible for initial granule formation and their strength. Granules are said to have improved free flowing properties as well as decreased dust problems. Various excipients used such as Microcrystalline Cellulose which is most increasingly used in formulating sustained release dosage forms for the matrix tablet drug delivery. Hydrophilic polymers are included necessarily in tablets in order to form a viscous, gelling layer which helps to retard the water penetration and acts as a barrier to drug release. The majority of drug release occurs
by diffusion through and erosion of this barrier [7].
MATERIALS AND METHODS
MaterialsMetformin HCl was obtained as a gift sample from Swiss Garnier Life Sciences Mehatpur, Himachal Pradesh. Microcrystalline cellulose, Aerosil, Talc were also obtained from Swiss Garnier Life Sciences Mehatpur, Himachal Pradesh. Xanthan gum, Guar gum was obtained from Dabur Pharmaceuticals, Haridwar. Aloe barbadensis was obtained from Botanical garden of Shivalik College of Pharmacy, Nangal.
Methods
Preformulation Studies
Preformulation studies is described as the method of optimizing the delivery of drug by determining the physiochemical properties of the active compound that can affect drug performance as well as development of an
efficacious, stable and safe dosage form [1].
Physical appearance
The drug metformin hydrochloride was visually observed and was found to be
Color: White hygroscopic crystalline powder.
Odor: Odorless
Taste: Bitter taste.
Determination of max
The absorption maxima of Metformin Hydrochloride was
scanned between 200-400nm. The max of the drug was
determined by UV- visible spectrophotometric method to obtain the structural information regarding the chromophoric part of Metformin Hydrochloride.
Preparation of calibration curve of Metformin in
Phosphate buffer of pH 6.8
Metformin Hydrochloride concentration in the solution was determined by UV- Visible spectrophotometer by reading the instrument at 233nm. The standard curves of Metformin Hydrochloride were prepared in water and phosphate buffer pH 6.8.100mg of Metformin Hydrochloride was correctly weighed and transferred in to 100ml of standard flask and then volume was made up to 100ml with the phosphate buffer. Pipette out 1ml again from the prepared solution and this will serve as stock solution for the dilution make up. Finally the dilutions were made by pipetting out 1ml, 2ml, 3ml, 4ml and 5ml from the stock solution, and further they were diluted to 10ml with phosphate buffer with pH 6.8. Fourier- Transform Infrared Spectroscopy (FTIR) IR spectroscopy is the best technique for qualitative compound identification. It gives information about the group present in the particular compound. IR study was performed for identification and structural analysis of the procured drug using Shimadzu- 1800 FTIR. The potassium bromide (KBr) disk technique was employed using 100mg of spectroscopic grade dried KBr. KBr was ground into a fine powder using a mortar/pestle and compressed into disc under hydraulic pressure at 10,000psi. Metformin Hydrochloride and drug excipient mixture were placed on the KBr disc with the help of capillary tube. Each KBr disc
was scanned at a resolution of 400 cm-1 and characteristic
bands were recorded. Solubility
The solubility of a drug in a specific solvent is measured in terms of saturation solubility.
Table 1: Solubility profile for metformin hydrochloride in water, isopropyl alcohol, methylene chloride, ethanol
and acetone are:
S. No. Solvent Solubility
1. Water Freely soluble
2. Isopropyl alcohol Freely soluble
3. Methylene chloride Freely soluble
4. Ethanol Slightly soluble
Saturation solubility is the extent of solubility of the drug beyond which addition of any more amount of solute does not increase concentration of solution. The solubility of Metformin HCl was tested in various solvents. A definite quantity (10 mg) of drug was dissolved in 10ml of each investigated solvent and shaken at 25°C for 24 hours in a water bath shaker until the equilibrium was obtained.
Melting point
Melting point of the drug was determined by capillary fusion method; one sided closed capillary filled with drug and put into the Melting point apparatus. Temperature was noted at which drug converts into liquid.
Table 2: Melting point of metformin hydrochloride
Reported value Experimental value Mean value
224°C 223°C 224°C 224°C 224°C
Various Pre compression parameters Bulk density
It is defined as the ratio of total mass of powder to the bulk volume of powder. It is calculated by pouring the weighed powder (passed through standard sieve # 20) into a measuring cylinder and initial weight was noted. This initial volume was called the bulk volume. From this the bulk density was calculated according to formula mentioned below. It is expressed in gm/ml is given by
Bulk density= M/Vb
Where, M and Vb are mass of powder and bulk volume of the
powder respectively [12].
Tapped density
Tapped density is defined as the ratio of total mass of the powder to the tapped volume of the powder. Volume of powder was measured by tapping the powder for 750 times and the tapped volume was noted if the difference between these two volumes is less than 2%. If it is more than 2%, tapping is continued for 1250 times and tapped volume was noted. Tapping was continued until the difference between successive volumes was found to be less than 2% (in a bulk density apparatus). It is mainly expressed in the units of gm/ml and is given by.
Tapped density = M/Vt
Compressibility index
The compressibility index of the powder was determined by
Carr’s compressibility index [12].
Carr’s index (%) = Tapped density-Bulk density/Tapped
density×100 Hausner ratio
Bulk density and tapped density were first calculated and finally Hausner’s ratio was calculated. It indicates the flow properties of the granules and is calculated by taking the ratio of tapped density to the bulk density. Hausner’s ratio is an indirect index for the ease of powder flow. It is calculate
by the given formula [12].
Hausner ratio= Tapped density /Bulk density Lower Hausner’s ratio (<1.25) indicates better flow properties than high ones (>1.25).
Angle of Repose
Angle of repose of pure drug was determined by using fixed funnel method. The blend was allowed to pour through a funnel that can be raised vertically until a maximum cone height (h) was obtained. The height of the funnel was adjust
in such a way that the tip of the funnel just touch the apex of the powder blend. The powder blend was allow to flow through the funnel freely on the surface. The diameter of the powder cone was measured and the angle of repose was calculated using the following equation. Radius of heap (r) was measured and angle of repose (ϴ) was calculated using
the formula [12].
ϴ = tan-1 height /radius
Formulation of Sustained Release Tablets of Metformin
Hydrochloride by wet granulation method Drug was
accurately weighed and passed through # 40 sieve. The screened powder was transferred into the mortar pestle and mixed for 5 minutes. The corresponding amounts of polymers (Methocel K4M, guar gum, Xanthan gum, and Aloe Vera powder) and microcrystalline cellulose were accurately weighed, screened through screen # 40, added to mortar pestle and mixed. 5% alcoholic solution (IPA) of polyvinyl pyrrolidone (PVP K30) was then added to the powder mixture as binder forms a wet mass consistency. The wet mass was passed through a # 10 sieve and the resulting granules were placed on trays for drying into the oven at 50°C for 10 minutes. The dried granules were passed through # 22 sieve. The dried granules and the corresponding amount of magnesium stearate, talc, and aerosil were accurately weighed and then mixed properly. Mixture was compressed into tablets using an instrumental tablet press and tablets were collected during compression
for in process testing (weight and hardness) [2].
Separation of Aloe gel powder from fresh leaves of Aloe Vera
Freshly cut leaves of Aloe barbadensis were washed thoroughly with water to remove the debris of soil and then cut open to collect the inner parenchymatous tissue (gel) of the leaf. The gel was then washed with distilled water and air dried under ambient condition for 12 hours and then at 80°C in a tray dryer for 4 hours to get solid dry mass. Dried solid mass was then converted into fine powder by mechanical grinding and passed through sieve # 85.
At the end it was decided to prepare final batches F-7, F-8 and F-9 with the combination of above polymers i.e. guar gum, xanthan gum, methocel K4M and finally the most suitable natural mucilage powder of Aloe Vera with the increasing ratios with respect to the quantity of drug i.e. (1:1, 1:1.5, and 1:2). The other three polymers were kept in the same quantity for these three final batches as depicted in the table 3 and 4 [9].
the effect of sudden erosion of the matrix after the swelling of these natural polymers. As high viscosity Methocel K4M is able to attribute to high gel layer formation which serves as a protective barrier to both the influx of water and the efflux of the drug in the solution. Aloe Vera contributes to both the formation of gel layer and the chain entanglement which provides higher resistance to the drug release for sufficient period of time. Another synergistic and potentiating effect contributed by the Aloe Vera is its anti-diabetic effect thus making the drug more patients compliant. Guar gum and xanthan gum contributes their swelling and gel forming properties with the time independent controlled release by providing surface erosion of matrix.
Swelling index:
The extent and degree of swelling was measured in terms of % (percentage) weight gain by the tablet. The swelling behaviors of the formulations were studied. One tablet from each formulation was kept in a petridish containing pH 6.8 or 7.4 phosphate buffer, as the drug also shows good solubility in these both two. At the end of 1 h, the tablet was withdrawn, soaked with tissue paper, and weighed. Then after every 2 hours, weight gained by the tablets was noted, and this process was continued till the end of 12 hours. The percentage weight gain by the tablet was calculated by the following formula.
% Swelling index = Mt- Mo /Mo×100 Where, Mt = Wt. of tablet at time “t”. Mo = Wt. of tablet at time, t = 0.
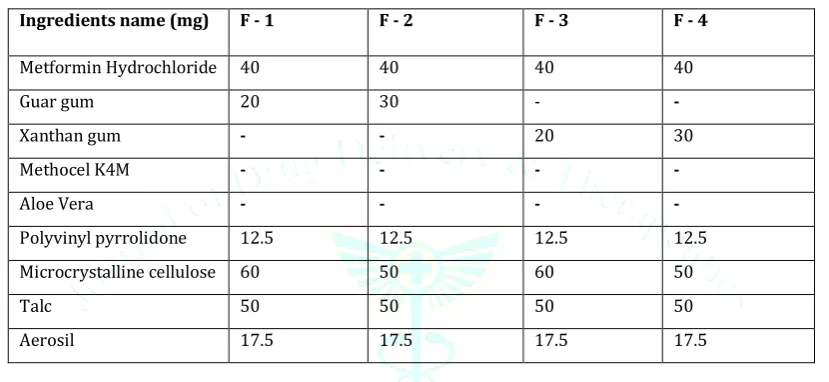
Table 3: Formulation composition of matrix tablet (F- 1 to F - 4)
Ingredients name (mg) F - 1 F - 2 F - 3 F - 4
Metformin Hydrochloride 40 40 40 40
Guar gum 20 30 - -
Xanthan gum - - 20 30
Methocel K4M - - - -
Aloe Vera - - - -
Polyvinyl pyrrolidone 12.5 12.5 12.5 12.5
Microcrystalline cellulose 60 50 60 50
Talc 50 50 50 50
Aerosil 17.5 17.5 17.5 17.5
Table 4: Formulation composition of matrix tablet (F - 5 to F - 9)
Ingredients name (mg) F - 5 F - 6 F - 7 F - 8 F - 9
Metformin Hydrochloride 40 40 40 40 40
Guar gum - - 10 10 10
Xanthan gum - - 10 10 10
Methocel K4M 20 30 10 10 10
Aloe Vera - - 50 50.5 60
Polyvinyl pyrrolidone 12.5 12.5 12.5 12.5 12.5
Microcrystalline cellulose 60 50 30 30 30
Talc 50 50 20 20 16
Aerosil 17.5 17.5 17.5 17 11.5
Evaluation of tablets
Post Compression parameters
Appearance: The tablet must be free from cracks,
depressions etc. The color and the polish must be uniform on the whole surface of tablet. The tablets should be smooth from all surfaces. [10].
Uniformity of weight
Weight variation was carried out to check that whether each of the tablets contains the proper amount of drug. The test was performed by weighing the 20 tablets individually with
the help of analytical balance, then the average weight was calculated and finally the comparison of the individual tablet weights to the average was done. The percentage of weight variation was calculated by applying the following formula. % of wt. variation = Individual wt. – Average wt. /Average wt. ×100
Hardness:
was performed using Monsanto type hardness tester. The crushing strength test was performed on 6 tablets from each
formulation. The hardness was measured in terms of kg/cm2
[10].
Friability:
For each batch of formulation the friability of 20 tablets was determined by using Roche type friabilator. The device subjects to the combined effect of abrasion and shock in a plastic chamber revolving at a speed of 25 rpm for 4 min and dropping the tablets at a height of 6 inch in each revolution. Preweighed sample of tablets were placed in the friabilator and then subjected to 100 revolutions.
Tablet thickness:
Tablet thickness is particular in reproducing appearance as well as in counting by using filling equipment. Some filling equipment devices presumes the uniform thickness of the tablets as a counting mechanism. Ten tablets were taken and
their thickness was recorded using micrometer [11].
Drug content uniformity:
The four tablets from each batch were randomly selected, weighed and then crushed in mortar. The powder equivalent to 10mg were weighed and dissolved in 50 ml methanol, from this solution 1 ml solution was again diluted to 10 ml with methanol. From this diluted solution was taken and further diluted up to 10 ml with methanol and assayed for drug content at 233 nm using blank as standard solution.
In vitro dissolution studies:
Drug release studies were conducted using USP dissolution apparatus I, basket type (Electro lab, Mumbai, India) at a
rotational speed of 100 rpm at 37±0.5 ºC. The dissolution media used were 900 mL of pH 6.8 phosphate buffer solutions for 12 hrs. Sink condition was maintained for the whole experiment. Samples usually 10 ml were withdrawn at regular intervals of time and the same volume of prewarmed (37±0.5 ºC) fresh dissolution medium was used to replace in order to maintain the volume constant. The samples withdrawn were further evaluated for drug content
in each sample after suitable dilution with
spectrophotometer. These were analyzed at 233nm [13].
Total nine formulations of sustained release tablets of Metformin Hydrochloride were made and composed of following ratios of polymers as given in the tables 5 and 6 and their dissolution rate profiles were checked at different intervals of time. The values of in vitro drug release are depicted in the Table 7 and 8.
The % of drug release was calculated from the given formula
Amount of drug release (mg) = (Concentration Dilution
factor Volume of dissolution medium)/ 1000
% drug release = Amount of drug released (mg) 100/ dose (mg) [14]
RESULTS AND DISCUSSION
ResultsDetermination of absorption maxima
The absorption maxima of Metformin Hydrochloride in phosphate buffer of pH was found to be 233.00nm which successfully resembled with pharmacopoeial standards.
Figure 1: U.V graph showing bell Shaped curve of Metformin Hydrochloride during its calibration.
Table 5: Standard curve data of metformin hydrochloride in saline phosphate buffer pH (6.8)
Figure 3: Standard curve of Metformin HCl in saline phosphate buffer of pH 6.8.
Table 6: The statistical parameters related to standard curve of metformin hydrochloride in saline phosphate buffer pH (6.8)
Sr. No. Parameters Values
1. Regression Coefficient 0.995
2. Equation of line 0.069x + 0.0119
As it is clearly depicted from the graph of figure that the value of regression coefficient for Metformin Hydrochloride is 0.995, which clearly demonstrates and proves the linear analysis of standard curve of drug.
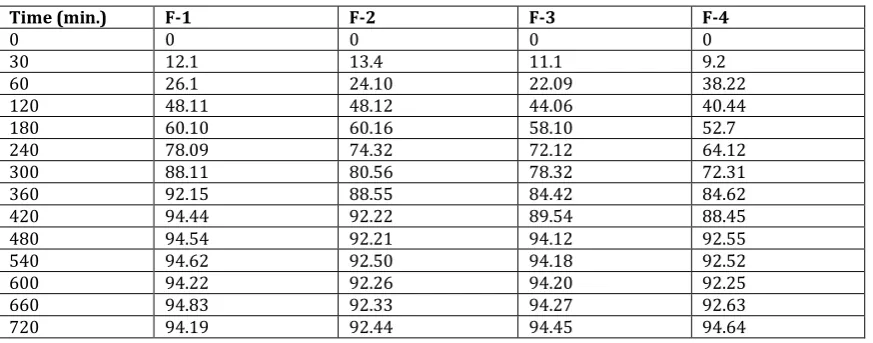
Table 7: Cumulative % drug release of formulations of sustained release tablets (F-1 to F-4).
Time (min.) F-1 F-2 F-3 F-4
0 0 0 0 0
30 12.1 13.4 11.1 9.2
60 26.1 24.10 22.09 38.22
120 48.11 48.12 44.06 40.44
180 60.10 60.16 58.10 52.7
240 78.09 74.32 72.12 64.12
300 88.11 80.56 78.32 72.31
360 92.15 88.55 84.42 84.62
420 94.44 92.22 89.54 88.45
480 94.54 92.21 94.12 92.55
540 94.62 92.50 94.18 92.52
600 94.22 92.26 94.20 92.25
660 94.83 92.33 94.27 92.63
720 94.19 92.44 94.45 94.64
Sr. No. Concentration (µg/ml) Absorbance (nm)
1. 1 0.101
2. 2 0.158
3. 3 0.212
4. 4 0.259
5. 5 0.356
6. 6 0.417
7. 7 0.498
8. 8 0.560
9. 9 0.645
Table 8: Cumulative % drug release of formulations of sustained release tablets (F-5 to F-9).
Time (min.) F-5 F-6 F-7 F-8 F-9
0 0 0 0 0 0
30 8.4 8.9 6.2 6.3 6.5
60 36.16 25.42 12.40 10.12 10.12
120 40.22 36.55 26.36 23.65 24.12
180 50.21 42.66 38.45 31.36 32.33
240 59.12 55.16 44.48 39.45 39.27
300 70.31 62.18 54.56 48.11 49.62
360 82.44 69.12 66.35 60.32 60.14
420 86.55 78.20 78.75 72.21 70.84
480 91.41 89.22 88.58 79.12 79.45
540 91.22 90.32 94.14 88.66 86.32
600 93.33 94.44 94.55 94.45 96.55
660 94.46 94.45 94.45 94.40 96.68
720 94.47 94.55 94.65 94.44 97.77
Figure 4: In vitro dissolution profiles of Metformin Hydrochloride of batches (F-1 to F-9).
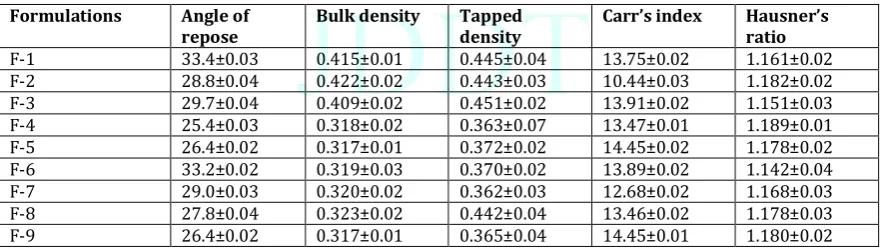
Table 9: Results of precompression parameters of powder blends of Metformin Hydrochloride
Formulations Angle of
repose Bulk density Tapped density Carr’s index Hausner’s ratio
F-1 33.4±0.03 0.415±0.01 0.445±0.04 13.75±0.02 1.161±0.02
F-2 28.8±0.04 0.422±0.02 0.443±0.03 10.44±0.03 1.182±0.02
F-3 29.7±0.04 0.409±0.02 0.451±0.02 13.91±0.02 1.151±0.03
F-4 25.4±0.03 0.318±0.02 0.363±0.07 13.47±0.01 1.189±0.01
F-5 26.4±0.02 0.317±0.01 0.372±0.02 14.45±0.02 1.178±0.02
F-6 33.2±0.02 0.319±0.03 0.370±0.02 13.89±0.02 1.142±0.04
F-7 29.0±0.03 0.320±0.02 0.362±0.03 12.68±0.02 1.168±0.03
F-8 27.8±0.04 0.323±0.02 0.442±0.04 13.46±0.02 1.178±0.03
F-9 26.4±0.02 0.317±0.01 0.365±0.04 14.45±0.01 1.180±0.02
Table 10: Results of Post compression parameters of punched tablets of Metformin Hydrochloride
Formulations Weight variation of
tablet (mg) Hardness (kg/cm2)
Thickness
(mm) Friability (%)
F-1 202.15±1.73 5.64±0.45 3.42±0.48 0.59
F-2 201.55±1.54 5.58±0.40 3.49±0.15 0.49
F-3 202.0±1.45 5.44±0.36 3.54±0.20 0.78
F-4 201.9±1.65 5.60±0.33 3.48±0.14 0.44
F-5 201.65±1.46 5.63±0.38 3.44±0.15 0.34
F-6 201.6±1.39 5.53±0.31 3.55±0.24 0.69
F-7 201.8±1.70 5.57±0.31 3.58±0.21 0.73
F-8 201.5±1.50 5.49±0.24 3.55±0.23 0.59
F-9 201.65±1.53 5.59±0.29 3.59±0.19 0.44
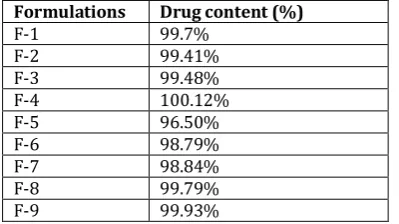
Table 11: Drug content uniformity of tablet batches
Formulations Drug content (%)
F-1 99.7%
F-2 99.41%
F-3 99.48%
F-4 100.12%
F-5 96.50%
F-6 98.79%
F-7 98.84%
F-8 99.79%
F-9 99.93%
Curve fitting analysis of in vitro dissolution studies The dissolution data obtained for best F-9 formulation was fitted to various kinetic models like Zero order, First order,
and Higuchi, Korsmeyer and Peppas models in order to know the mechanism of drug release from matrix of tablet which is usually made of hydrophilic polymers. The results are shown below.
Table 12: Zero order kinetics of F-9 formulation
Sr. No. Time % Cumulative drug release
1). 0 0
2). 30 6.5
3). 60 10.12
4). 120 24.12
5). 180 32.33
6). 240 39.27
7). 300 49.62
8). 360 60.14
9). 420 70.84
10). 480 79.45
11). 540 86.32
12). 600 96.55
13). 660 96.68
14). 720 97.77
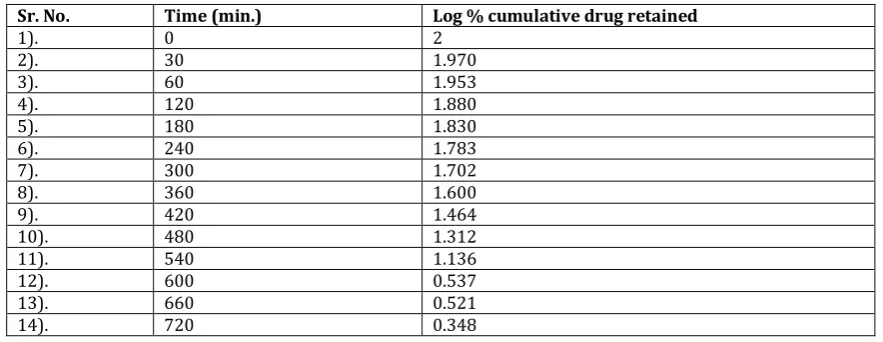
Table 13: First order kinetics of F-9 formulation
Sr. No. Time (min.) Log % cumulative drug retained
1). 0 2
2). 30 1.970
3). 60 1.953
4). 120 1.880
5). 180 1.830
6). 240 1.783
7). 300 1.702
8). 360 1.600
9). 420 1.464
10). 480 1.312
11). 540 1.136
12). 600 0.537
13). 660 0.521
14). 720 0.348
Log% cumulative drug retained was calculated by subtracting the cumulative drug release from 100 and then taking the logarithm of obtained value.
Figure 6: Graph of First order kinetics of F-9.
Table 14: Higuchi kinetics of F-9 formulation
Sr. No. Square root of time % Cumulative drug release
1). 0 0
2). 5.477 6.5
3). 7.745 10.12
4). 10.954 24.12
5). 13.416 32.33
6). 15.491 39.27
7). 17.320 49.62
8). 18.973 60.14
9). 20.493 70.84
10). 21.908 79.45
11). 23.237 86.32
12). 24.494 96.55
13). 25.690 96.68
Figure 7: Graph of Higuchi kinetics of F-9.
As the regression coefficient values for Zero order and First order were found to be 0.98 and 0.89 with high linearity and release of drug from matrix made of hydrophilic polymers involves the factors of diffusion. Diffusion is related to transport of drug from a matrix into the in vitro study fluid, which in turn depends on the concentration. As the
concentration gradient increases, the drug is released and the distance for diffusion gradually increases finally the drug diffuses at a comparatively slower rate as the distance for diffusion increases. This phenomenon is preferred to as square root kinetics or Higuchi kinetics.
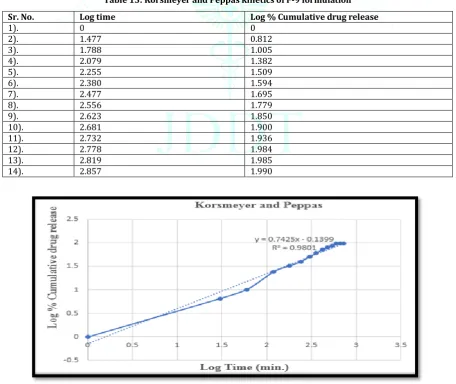
Table 15: Korsmeyer and Peppas kinetics of F-9 formulation
Sr. No. Log time Log % Cumulative drug release
1). 0 0
2). 1.477 0.812
3). 1.788 1.005
4). 2.079 1.382
5). 2.255 1.509
6). 2.380 1.594
7). 2.477 1.695
8). 2.556 1.779
9). 2.623 1.850
10). 2.681 1.900
11). 2.732 1.936
12). 2.778 1.984
13). 2.819 1.985
14). 2.857 1.990
Results of flow properties of Aloe barbadensis powder The viscosity of 1% gum solution in water was found to be 8.54 poise indicating viscous flow of gel. But the gum was made to dry with the help of tray dryer, and the powder was obtained.
Table 16: Flow properties of Aloe barbadensis powder
Sr. No. Parameters Value
1). Bulk density (g/ml) 0.35
2). Tapped density (g/ml 0.39
3). Carr’s index (%) 13.17
4). Hausner’s ratio 1.13
5). Angle of repose 23°
After seeing the in vitro release data of all formulation batches it was demonstrated that the F-9 was considered as the best formulation because it was capable to release the drug in the sustained manner with respect to time as
compared to others. The cumulative % drug release was also found to be maximum in the 12 hours with this formulation i.e. 97.77%. Due to the complete release of drug within 12 hours the effect of the drug can be seen throughout the day, thus eliminating the intake of another dose of drug in the same day. F-9 formulation composition also served to be very effective as it contains high ratio of Aloe barbadensis i.e. 1:2 (60mg) while all other used polymers ratio was kept constant throughout the process.
The regression coefficient “r” value of zero order and first order were 0.982 and 0.894. The regression coefficient “r” value for Higuchi and Korsmeyer and Peppas were found to be 0.95 and 0.98. It indicated that the release of drug from these sustained formulations was governed by diffusion controlled process. The value of “n” was found to be 0.742 indicating the anomalous non Fickian diffusion as it is depicted from the Korsmeyer and Peppas model graph of figure 8. The “n” is responsible for depicting the type of diffusion.
Stability studies
Table 17: Accelerated stability study of matrix tablets of Metformin HCl of batch F-9 at 40°C and 75% Relative
humidity.
Sr. No. Parameter Initial 1 month 2 month 3 month
1). Average weight (mg) 201.65 201.67 201.69 201.69
2). Friability (%) 0.44 0.43 0.43 0.43
3). Hardness (Kg/cm2) 5.59±0.29 5.49±0.29 5.49±0.29 5.40±0.01
4). %Drug release (up to 12 hours) 97.77 97.62 97.62 97.62
The stability study on the final and best formulation F-9 indicated that there was slight acceptable differences in average
weight, friability, hardness and in vitro drug dissolution after 3 months at 40°C/75% RH [8].
Swelling index
Figure 9: Graph of swelling index of formulations F-1 to F-9.
DISCUSSION
In the matrix tablet, Xanthan gum, Guar gum, Aloe barbadensis and Methocel K4M were used as retarding agent. And the study showed that Aloe barbadensis satisfactorily proved to be best pharmaceutical excipient in the formulation and manufacture of sustained release matrix tablets because of its high viscosity and capability to form a gelatinous layer around tablet core. The dried mucilage was capable to undergo sufficient swelling and entanglement of
dissolves, consequently a new inner layer must replace it and be cohesive as well as continuous enough to retard the influx of water and control of drug diffusion. Aloe barbadensis was chosen to be best fit polymer or natural gum because of its excellent anti-diabetic effect which combats all the side effects of Metformin such as G.I.T symptoms and thus provides synergistic action to drug.
CONCLUSION
Metformin Hydrochloride is used as an anti-diabetic drug. In the present research work the sustained release tablet was successfully formulated and studied by using different polymers by utilizing the wet granulation method. From in vitro dissolution profile analysis data the following conclusions were drawn out. Formulation batches 1 and F-2 were composed of F-20% and 30% of guar gum, released the 26.1% and 24.10% of drug respectively in 60 minutes (1 hour). Formulation batches F-3 and F-4 were composed of 20% and 30% of xanthan gum, released the 22.09% and 38.22% of drug respectively in 60 minutes. F-5 and F-6 were composed of 20% and 30% of methocel K4M, released the 36.16% and 25.12% of drug in 60 minutes. The F-7, F-8 and F-9 were composed of Aloe barbadensis with other three previously used polymers in the constant or same quantity. Aloe vera was composed in the following ratio of 1:1, 1:1.5 and 1:2. The release rates of these formulations were 6.2%, 6.3% and 6.5% in 60 minutes (1 hour). The release rates of the formulation batches F-1 to F-6 were high due to the use of hydrophilic polymers (xanthan gm, guar gum and methocel K4M) alone in these batches. The use of these polymers alone for the purpose of extending drug release for highly water soluble drugs is restricted due to rapid diffusion of the dissolved drug through the hydrophilic gel network. As these polymers are known to possess low viscosity as compared to Aloe barbadensis mucilage. It was found that by increasing the viscosity of polymer as observed in F-9 formulation, the retarding rate can be proportionately increased. Therefore F-9 was opted to be an optimized formulation thus it was fitted to regression analysis data of various models, the “r” values Higuchi model and Korsmeyer and Peppas model were 0.95 and 0.98 which indicated diffusion mechanism for drug release. Higuchi kinetics is also called as square root kinetics which is responsible for explaining the drug diffusion which occurs at comparatively slower rate when the distance for diffusion increases. The “n” value of F-9 was found to be 0.742 which indicated anomalous or non- Fickian diffusion mechanism for the drug release. After compilation of these values it was concluded that rug follows both diffusion and erosion mechanism for its release.
ACKNOWLEDGEMENTS
I, myself Diksha Sharma want to firstly thank Almighty God and my parents for their immense support during the research work. I would like to put my gratitude to the co-authors who helped a lot during this research work. Special thanks to our Head of Pharmaceutics Department, Mr. Dhruv Dev who helped a lot with the understanding of concepts which arises during research work.
CONFLICT OF INTEREST
A special vote of thanks as a token of helping hands was given to co- authors. But during the submission of this manuscript, not any kind of financial or personal help was taken. During the research work, it was kept in mind that nobody intentions are disturbed. Thus after the publication of this research work, not any kind of conflict of interest will be seen at any step. As this research work is of my keen interest, hard work and efforts.
REFERENCES
1. Sahu S, Dangi R, Patidar R, Rukhsaar, Rathi J, Asati V, Formulation and evaluation of sustain released matrix tablet of atenolol, Journal of Drug Delivery and Therapeutics, 2019; 9(1):183-189.
2. Shanmugam S, Babu R, Satheeshkumar S, Shanmugasundaram P, Formulation and evaluation of sustained release matrix tablets of levosulpiride using natural polymers, Asian Journal of Pharmaceutical and Clinical Research, 2017; Volume 10 Issue 5:286-292.
3. Kaushal M, Monali M, Mishra D, Mittal P, Sorathiya U, Shelat P, Oral controlled release drug delivery system: An overview, International Research Journal of Pharmacy, 2013; 4(3):70-76.
4. Jethara S, Patel M and Patel A, Sustained release drug delivery systems: A patent overview, Aperito Journal of Drug Designing and Pharmacology, 2014; 1:104:2-14.
5. Ratnaparkhi MP, Gupta P, Sustained release oral drug delivery system: An overview, International Journal of Pharma Research and Review, 2013; 2(3):11-21.
6. Pawan P, Mayur P, Ashwin S, Role of natural polymers in sustained release drug delivery system: Applications and recent approaches, International Research Journal of Pharmacy, 2011; 2(9):6-11.
7. Wadher KJ, Kakde RB, Umekar MJ, Formulation and evaluation of a sustained release tablets of metformin hydrochloride using hydrophilic synthetic and hydrophobic natural polymers, Indian Journal of Pharmaceutical Sciences, 2011:2018-215.
8. Sharma A, Bhatt V, Sustained release matrix type drug delivery system: A review, World Journal of Pharmacy and Pharmaceutical Sciences, 2015:1002-1022.
9. Hindustan Abdul Ahad, Sreeramulu J, Bindu Hima V, Reddy Y, Formulation and evaluation of Aloe barbadensis miller mucilage based controlled release matrix tablets of glimepiride, Asian Journal of Chemistry, 2009; Volume 21 No.8:6271-6276.
10. Adimulka S, Devandha A, Formulation and evaluation of sustained release tablets of metformin hydrochloride, World Journal of pharmaceutical Sciences, 2017; Volume 6 Issue 17:632-648.
11. Patel KB, Vyas JR, Upadhyay, Formulation and evaluation of sustained release matrix tablets of Nateglinide, Journal of Drug Delivery and Therapeutics, 2015; 5(5):19-15.
12. Lachman L, Lieberman HA, Kanig JL. The theory and practice of industrial pharmacy. 3rd ed. Mumbai: Varghese Publishing House; 1987. P. 300-304.
13. Satyanarayana T, Rajitha V, Kumar S, Shaji G, Saranya P, Formulation and evaluation of metformin hydrochloride extended release tablets, Pelagia Research Library, 2012; 3(1):58-63.
14. Dahima R, Formulation and evaluation of sustained release granules of Nitazoxanide, Journal of Chemical and Pharmaceutical Research, 2018; 10(2):20-24.
15. Nikunj B, Modi D, Bhardia PD, Formulation, development and evaluation of sustained release matrix tablets of repaglinide, 2014;3(2):370-396.