Volume 20 Number 2 pp. 97–107 C The Author(s) 2017 doi:10.1017/thg.2017.3
Heritability and GWAS Studies for
Monocyte–Lymphocyte Ratio
Bochao D. Lin,1Gonneke Willemsen,1Iryna O. Fedko,1Rick Jansen,2Brenda Penninx,2E. de Geus,1
C. Kluft,3JoukeJan Hottenga,1and Dorret I. Boomsma1
1Netherlands Twin Register, Department of Biological Psychology, Vrije Universiteit, Amsterdam, the Netherlands 2Department of Psychiatry, VU Medical Center, Amsterdam, the Netherlands
3Good Biomarker Sciences, Leiden, the Netherlands
The monocyte–lymphocyte ratio (MLR) is a useful biomarker for disease development, but little is known about the extent to which genetic and environmental factors influence MLR variation. Here, we study the genetic architecture of MLR and determine the influence of demographic and lifestyle factors on MLR in data from a Dutch non-patient twin-family population. Data were obtained in 9,501 individuals from the Netherlands Twin Register. We used regression analyses to determine the effects of age, sex, smoking, and body mass index (BMI) on MLR and its subcomponents. Data on twins, siblings and parents (N=7,513) were analyzed by genetic structural equation modeling to establish heritability and genome wide single nucleotide polymorphism (SNP) data from a genotyped subsample (N=5,892) and used to estimate heri-tability explained by SNPs. SNP and phenotype data were also analyzed in a genome-wide association study to identify the genes involved in MLR. Linkage disequilibrium (LD) score regression and expression quan-titative trait loci (eQTL) analyses were performed to further explore the genetic findings. Results showed that age, sex, and age×sex interaction effects were present for MLR and its subcomponents. Variation in MLR was not related to BMI, but smoking was positively associated with MLR. Heritability was estimated at 40% for MLR, 58% for monocyte, and 58% for lymphocyte count. The Genome-wide association study (GWAS) identified a locus onITGA4that was associated with MLR and only marginally significantly asso-ciated with monocyte count. For monocyte count, additional genetic variants were identified onITPR3,
LPAP1, andIRF8. For lymphocyte count, GWAS provided no significant findings. Taking all measured SNPs together, their effects accounted for 13% of the heritability of MLR, while all known and identified genetic loci explained 1.3% of variation in MLR. eQTL analyses showed that these genetic variants were unlikely to be eQTLs. In conclusion, variation in MLR level in the general population is heritable and influenced by age, sex, and smoking. We identified gene variants in theITGA4gene associated with variation in MLR. The significant SNP-heritability indicates that more genetic variants are likely to be involved.
Keywords:heritability, MLR, GWAS, age and sex differences, lifestyle
As early as the 1960s, the relevance of the monocyte– lymphocyte ratio (MLR) for disease prediction was pointed out. The first studies focused on infectious diseases, sug-gesting MLR reflects the balance between effector and host
(Hanifin & Cline,1970), and found MLR to predict the
de-velopment and progress of tuberculosis (Iqbal et al.,2014).
In later studies, the association between MLR and other dis-eases was studied and the MLR emerged as a predictor for
cancer (Nishijima et al.,2015). While MLR is examined in
relation to disease, studies examining the causes of variance in MLR in the general population are lacking. To fully un-derstand the role of MLR in disease, it is, however, neces-sary to understand the factors underlying variation in MLR in the general non-patient population.
We recently showed that heritability plays a role in individual differences in two other lymphoid ratios, the neutrophil–lymphocyte ratio (NLR) and the platelet– lymphocyte ratio (PLR). For NLR, the heritability was mod-erate (35%), but for PLR, heritability was high (64%), with evidence of the presence of non-additive genetic effects
received 23 December 2016; accepted 10 January 2017. First published online 14 February 2017.
(Lin et al.,2016). The first genome-wide association study (GWAS) for these two ratios identified a genome-wide locus
on theHBS1L-MYBintergenic region associated with PLR
(Lin et al.,2016), which has been associated with multiple
blood parameters, including platelet count (Lin et al.,2016).
Although the heritability of MLR has not been studied, genetic studies have been conducted for its subcomponents, the monocyte and lymphocyte levels, showing heritability estimates of 56–73% for monocyte levels and 35–66% for
lymphocyte levels (Evans et al.,1999; Hall et al.,2000). In
addition, linkage and GWAS have pointed to the genetic variants partly responsible for the individual variation in monocyte and lymphocyte levels. GWASs have identified
eight loci associated with monocyte levels:ITGA4at 2q31.3,
HLA-DRB1at 6p21.32,CCBP2at 3p22.1,RPN1at 3q21.3, LPAR1at 9q31.3, intergenic regions at 8q24 and 3q21, and
IRF8at 16q24.1 (Crosslin et al.,2013; Keller et al.,2014;
Nalls et al.,2011; Reiner et al.,2011). GWAS also identified
two loci for lymphocyte levels: 6p21 (EPS15L1gene) and
19p13 (Crosslin et al.,2013; Nalls et al.,2011). Taken
to-gether, genetic factors are likely to play a role in normal vari-ation in MLR, but the nature of the involvement remains to be determined.
Environmental and lifestyle factors may also influence MLR levels. Here, too, studies on MLR itself are lacking, but
our own study on PLR and NLR (Lin et al.,2016) showed
that lifestyles influence PLR and NLR levels, and agreed
with other studies (Azab et al.,2014; Li et al., 2015) that
smoking and BMI may also affect these parameters. In ad-dition, its subcomponents, monocyte and lymphocyte lev-els, have been found to be influenced by BMI (Tenorio et al.,
2014; Zaldivar et al.,2006) and smoking (Schwartz & Weiss,
1994), although these effects are not found in all studies
(Al-Sufyani & Mahassni,2011; Perez-de-Heredia et al.,2015).
In this article, we examined several potential causes of variance in MLR in the general population. First, age, sex, smoking, and BMI effects on MLR were investigated. Then, we studied genetic influences on MLR to provide more in-sight into its genetic architecture in a healthy population. We started by estimating the heritability of MLR and it subcomponents by extended twin family modeling. Next, we used GWAS to identify genetic variants associated with MLR variation and genome-wide complex trait analysis (GCTA) to determine the percentage of variance of MLR that is explained by significant versus all measured genetic variants (single nucleotide polymorphisms; SNPs). Subse-quently, we performed an expression quantitative trait loci (eQTL) analysis of all the top SNPs, which were significantly associated with MLR. We repeated the GWAS, GCTA, and eQTL analyses for monocyte levels, while referring to lym-phocyte levels in the results presented previously (Lin et al.,
2016). Finally, linkage disequilibrium (LD) score regression
was performed using the summary statistics of the GWAS results to determine the polygenetic effects and genetic cor-relations between MLR and subcomponents.
Methods
Participants and Phenotypes
All participants were adults registered with the Nether-lands Twin Register (NTR), who took part in a longitudi-nal study on health and lifestyle in twins and their family
members (Willemsen et al.,2013). Data were obtained as
part of NTR biobanking projects conducted in 2004–2008
(Willemsen et al.,2010,2013; Sirota et al.,2015). After
re-moving outliers (i.e., absolute values exceeding mean ±5
SD), data on monocyte and lymphocyte count were
avail-able for 9,501 participants clustered in 3,412 families. Dur-ing the interview conducted at the time of the home visit, height and weight were obtained. BMI was calculated as
weight (kg) divided by height squared (m2). Participants
reported whether they currently smoked or had smoked. If so, they were asked for the number of cigarettes smoked per day and how long they (had) smoked. Participants were divided into five categories: non-smoker, ex-smoker, light smoker (currently smoking less than 10 cigarettes a day), average smoker (currently smoking 10–19 cigarettes a day), and heavy smoker (currently smoking 20 or more cigarettes a day). Participants were asked to indicate when they were last ill and the nature of the illness. In the case of medica-tion use, the dosage, brand, and name were recorded. In ad-dition, participants indicated on the presence and nature of any chronic disease. The following exclusion criteria were used to identify individuals who may have had a compro-mised immune system at the time of blood sampling: (1)
illness reported in the week prior to sampling (N=552);
(2) C-reactive protein (CRP)≥15 (N=307); (3) basophile
count>0.02×10⁹/L (N=154); (4) report of blood-related
disease or cancer (N=84); and (5) use of anti-inflammatory
medication (N=423), glucocorticoids (N=143), or iron
supplements (N=29). Participants meeting one or more of
these criteria were labeled as unhealthy (N=1,362),
leav-ing 8,139 individuals from 3,280 families as the population that we will here refer to as the healthy population. Ge-netic twin-family modeling was conducted using data from twin families limited to at most one twin pair per family and at most two brothers and two sisters and father and mother. This resulted in a sample of 7,513 participants from 3,252 families, including 240 monozygotic male (MZM), 98 dizygotic same-sex male (DZM), 536 monozygotic fe-male (MZF), 219 dizygotic same-sex fefe-male (DZF), and 222 dizygotic opposite-sex (DOS) twin pairs. The study proto-col was approved by the Medical Ethics Committee of the VU University Medical Center Amsterdam and all partici-pants provided informed consent.
Procedure
between the 2nd and the 4th day of the menstrual cycle or, if on hormonal birth control, were visited in their pill-free week. Participants were asked to fast from the evening before and to refrain from smoking or physical exercise 1 hour before blood sampling (for more details see
Willem-sen et al.,2010). Peripheral blood was collected in
anticoag-ulant vacuum tubes, which were inverted 8–10 times imme-diately after the blood draw. All samples were transported to the laboratory facility in Leiden, the Netherlands, within 3–6 hours after blood sampling. The blood samples were then directly used or stored to measure parameters of inter-est or extract DNA or RNA at a later moment (see Lin et al.,
2016; Willemsen et al.,2010). The hematological profile was
obtained from EDTA blood samples with a Coulter system (Coulter Corporation Miami, USA). This profile consisted of total white blood cell count, percentages and numbers of neutrophils, lymphocytes, monocytes, eosinophils, and ba-sophils, and indicators of red blood cell types and platelets.
We calculated MLR as the absolute monocyte count (109/L)
divided by the absolute lymphocyte count (109/L). CRP was
determined from a heparin plasma sample using the 1,000 CRP assay (Diagnostic Product Corporation).
Genotype Data
For DNA isolation, we used the GENTRA Puregene DNA isolation kit on frozen whole blood samples, which were collected in EDTA tubes. All procedures were performed according to the manufacturer’s protocols (Boomsma et al.,
2008). Genotyping was done on multiple platforms,
includ-ing a number of partly overlappinclud-ing subsets of participants. The following platforms were used: Affymetrix Perlegen 5.0, Illumina 370, Illumina 660, Illumina Omni Express 1
M, and Affymetrix 6.0 (for details see (Lin et al.,2016). The
individual SNP markers were lifted over to Build 37 (HG19) of the Human Reference Genome using the LiftOver tool (http://genome.sph.umich.edu/wiki/LiftOver). Genotype calls were made with platform specific software (BIRD-SUITE APT-Genotyper Beadstudio) for each specific array. Phasing of all samples and imputing cross-missing
plat-form SNPs was done with MACH 1 (Li et al.,2010). The
phased data were then imputed with MINIMAC (Howie
et al.,2012) in batches of around 500 individuals for the
au-tosomal genome using the above 1000G Phase I integrated reference panel for 561 chromosome chunks obtained by
the CHUNKCHROMOSOME program (Liu et al.,2013).
SNPs were removed if the Mendelian error rate was>0.02,
if the imputed allele frequency differed more than 0.15
from the 1000G reference allele frequency, and if MAF<
0.01 and if R2<0.80. Hardy–Weinberg Equilibrium was
calculated on the genotype probability counts for the full
sample and SNPs were removed, if the pvalue<.00001.
After imputation, MZ twins were reduplicated back into the data. This left 6,010,458 SNPs in the GWAS analyses.
As several different platforms were used, additional SNP quality control (QC) included an evaluation of the SNP
platform effects, and SNPs showing platform effects were removed. This was done by defining individuals on a spe-cific platform as cases and the remaining individuals as con-trols. Allelic association was then calculated and SNPs were removed if the specific platform allele frequencies were significantly different from the remaining platforms with
pvalue<.00001. In total, 5,987,253 SNPs survived this QC
and these SNPs were then used to build the genetic re-lationship matrix (GRM) for all individuals. The selected SNPs were transformed to best guess Plink binary format and subsets were made for each of the 22 chromosomes. The GRMS for all NTR samples were then calculated using
GCTA (Yang et al.,2011). We generated 24 GRMs in total.
A first autosomal GRM reflects an identity-by-state (IBS) matrix for all individuals. This GRM is determined from all autosomal SNPs and is used to estimate the SNP
heri-tability (h2
g). A second autosomal GRM represents closely
related individuals (identity-by-state [IBS]>0.05), so any
remaining pairwise relationship estimates smaller than 0.05 were set to zero in this matrix. This matrix is used as sec-ond covariate matrix in the GWAS and GCTA studies to account for the family structure of individuals and to
esti-mate the narrow-sense heritability (h2) of applying an
addi-tive model. Finally, 22 GRMs were created that included all autosomal SNPs except for those on the one chromosome that is tested in the GWAS (the leave one chromosome out or LOCO strategy). These matrices were used in the GWASs as a covariate matrix to remove artificial inflation due to all kinds of subsample stratification.
Statistical Analyses
First, using age- and sex-corrected values, we tested for differences in MRL, monocyte, and lymphocyte levels
be-tween the healthy and unhealthy population using at-test.
Next, within the healthy population, we explored the age and sex effects by linear regression. To detect the influence of lifestyle on variation in the MLR level, we included BMI and smoking behavior in a regression analysis conducted separately by sex, taking age into account. Analyses were
conducted in STATA (Stata Corp.,2013) using the cluster
option to correct for the family structure within the data. Using genetic structural equation modeling in OpenMx
(Boker et al., 2011), the heritability of MLR, monocyte
count, and lymphocyte count was estimated in the healthy population. MLR, monocyte count, lymphocyte count, and
age were standardized usingzscores. Parameters were
esti-mated by maximum likelihood. We summarized the family resemblance with respect to MLR by means of correlations
corrected for age, sex, and age×sex effects. Then, we fitted
a series of genetic models. The total phenotypic variance was decomposed into four sources of variation: additive ge-netic (A), non-additive gege-netic (D), common environmen-tal (C), and unique environmenenvironmen-tal (E) variation. The com-mon environmental variance reflects the variance shared
family members was modeled as a function of A, D, and C. We allowed for a correlation in phenotype between spouses
(µ). In fitting the genetic models, we included as covariates
age, sex, sex×age. We fitted the full model as described
and tested the presence of assortative mating (i.e., the cor-relation between phenotypes of spouses) and the presence of shared environment and non-additive influences. The nested submodels were compared to the full model by log likelihood ratio test (-2LL) using a significance level of 0.05.
GWAS
We performed two GWASs: one for MLR level and one for monocyte count, using the quality controlled imputed SNPs, including age, sex, three Dutch principal components (PCs) generated with the Eigensoft software and genotype
platform as covariates (N=5,892; see Methods and
Abdel-laoui et al.,2013). As we had already conducted a GWAS
for lymphocyte count, using a largely overlapping sample
(N=5, 901, overlap of 5,890 individuals) we did not rerun
this analysis but instead refer here to the results published in
Lin et al. (2016). Analyses were performed with the GCTA
software running a mixed linear model association model
to account for relatedness (Tucker et al.,2015). To avoid
in-flated test statistics in datasets with related individuals and other remaining cryptic stratification, we used two covari-ate GRM matrices: the matrix for all individuals, excluding the chromosome under analysis (LOCO analysis) and the
matrix only focusing related individuals with IBS>0.05
(Tucker et al.,2015). For the GWAS, we assumed the
statis-tically significant threshold as apvalue less than 5×10⁻⁸
(Pe’er et al.,2008), and we refer to as marginally significant
whenpvalues exceed this threshold but remain below 10−4.
eQTL Analysis
To detect possible causal effects for significant genetic vari-ants, we conducted eQTL analyses, in which eQTL effects were detected with a linear model approach using
Matrix-eQTL (Shabalin,2012). The analysis specified expression
level as the dependent variable and SNP genotype values as the independent variable. The eQTL dataset is described in
detail elsewhere (Jansen et al., in press; Wright et al.,2014).
eQTL effects were defined as cis when the distance between probe set–SNP pairs was smaller than 1M base pairs (Mb), and as trans when the SNP and the probe set were separated by more than 1 Mb on the genome according to hg19.
GCTA and Linkage Disequilibrium Score Regression We performed GCTA analyses to estimate narrow-sense heritability, the fraction of genetic variance explained by the significant SNPs detected in the GWAS and the fraction of genetic variance explained by the known significant SNPs from the published literature. These analyses were done for MLR level, monocyte count, and lymphocyte count. A re-stricted maximum likelihood analysis procedure was used
under a linear design (Yang et al.,2011). Sex, age, genotype
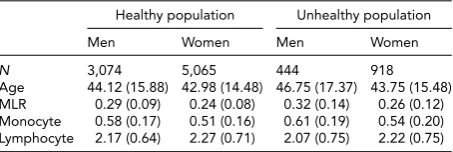
TABLE 1
Average Levels (SD) for MLR and Its Subcomponents in the
Healthy and Unhealthy Population for Men and Women
Healthy population Unhealthy population
Men Women Men Women
N 3,074 5,065 444 918
Age 44.12 (15.88) 42.98 (14.48) 46.75 (17.37) 43.75 (15.48) MLR 0.29 (0.09) 0.24 (0.08) 0.32 (0.14) 0.26 (0.12) Monocyte 0.58 (0.17) 0.51 (0.16) 0.61 (0.19) 0.54 (0.20) Lymphocyte 2.17 (0.64) 2.27 (0.71) 2.07 (0.75) 2.22 (0.75)
platform, and three Dutch PCs were included as covariates. We used two covariance matrixes to estimate narrow sense
heritability (h2), and GWAS and known loci heritability
(Zaitlen et al.,2013). The first GRM is the full autosomal
GRM as described previously. The second GRM is the
closely related (IBS > 0.05) matrix. Pearson correlations
between the phenotypes of interest were calculated in R
(R Core Team.,2014). Whether polygenetic effects
(Bulik-Sullivan et al.,2015) influenced MLR and its compositions
was explored by LD score regression. The SNP heritability
(Finucane et al.,2015) of MLR, monocyte count,
lympho-cyte count, and genetic correlations (Bulik-Sullivan et al.,
2015) among the phenotypes were determined by LD score
regression on our computed GWAS summary statistics. The genetic correlation of two traits can be calculated by the slope from the LD regression on the product of effect sizes
(zscore) for two phenotypes of interest. In order to do this,
we used the HapMap3 LD scores (N SNPs=1,293,150)
computed for each SNP based on the LD observed in European ancestry individuals from the 1,000 Genomes project (accessible online at http://github.com/bulik/ldsc). QC for genetic data is the default setting in the program.
Results
Health Status, Sex, Age, and Lifestyle
Table 1gives the descriptive statistics for MLR and its sub-components, the monocyte and lymphocyte count, for the healthy and unhealthy parts of the population. The com-parison of the healthy and unhealthy population (see Meth-ods for definition), taking sex and age into account as well as family structure, showed, as expected, that individuals in the unhealthy population had on average a higher MLR
ratio, t(9,499) = −7.95, p< .001, and monocyte count,
t(9,499)= −5.06,p<.001, and a lower lymphocyte count,
t(9,499)= −2.57,p=.01). We continued our
investiga-tion in the healthy populainvestiga-tion, examining the influence of age and sex. Men had higher MLR levels than women,
b= −0.0176,p<.01, and MLR increased with age in both
men and women,b=0.0013,p<.001. There was also
evi-dence for an age×sex interaction: the age effects were
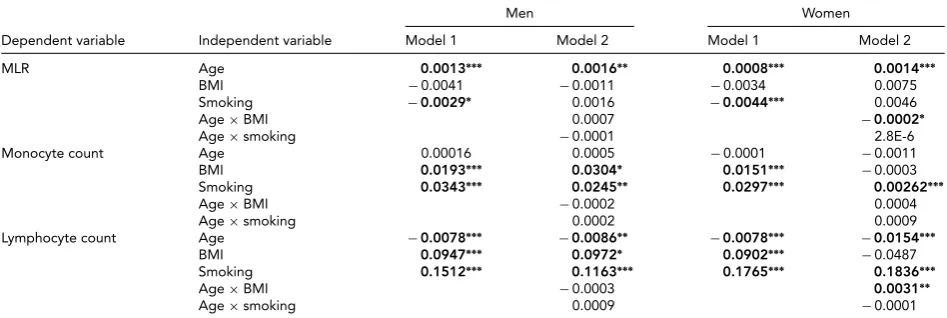
TABLE 2
Results of the Linear Regression Analyses (Regression Coefficients) for MLR and Its Subcomponents for Men and Women
Men Women
Dependent variable Independent variable Model 1 Model 2 Model 1 Model 2
MLR Age 0.0013∗∗∗ 0.0016∗∗ 0.0008∗∗∗ 0.0014∗∗∗
BMI −0.0041 −0.0011 −0.0034 0.0075
Smoking −0.0029∗ 0.0016 −0.0044∗∗∗ 0.0046
Age×BMI 0.0007 −0.0002∗
Age×smoking −0.0001 2.8E-6
Monocyte count Age 0.00016 0.0005 −0.0001 −0.0011
BMI 0.0193∗∗∗ 0.0304∗ 0.0151∗∗∗ −0.0003
Smoking 0.0343∗∗∗ 0.0245∗∗ 0.0297∗∗∗ 0.00262∗∗∗
Age×BMI −0.0002 0.0004
Age×smoking 0.0002 0.0009
Lymphocyte count Age −0.0078∗∗∗ −0.0086∗∗ −0.0078∗∗∗ −0.0154∗∗∗
BMI 0.0947∗∗∗ 0.0972∗ 0.0902∗∗∗ −0.0487
Smoking 0.1512∗∗∗ 0.1163∗∗∗ 0.1765∗∗∗ 0.1836∗∗∗
Age×BMI −0.0003 0.0031∗∗
Age×smoking 0.0009 −0.0001
Note: Estimates in bold are significant (∗p<.05,∗∗p<0.01,∗∗∗p<.001). MLR=monocyte count ratio; BMI=body mass index; Age×BMI=interaction of age and BMI; Age×smoking=interaction of age and smoking; Model 1: blood variable=b0+b1×age+b2×BMI+b3×smoking; Model 2: blood variable=b0+b1×age+b2×BMI+b3×smoking+b4×age×BMI+b5×age×smoking.
in women and increased with age. These age effects were similar in men and women. To test the effects of BMI and smoking, we included this variable in a regression analysis conducted separately by sex and taking age into account.
The results, shown inTable 2(model 1), indicate that
smok-ing is related to a decrease in MLR level in both men and women. BMI was not associated with MLR in either sex.
However, an age×BMI interaction was seen for MLR in
women (model 2): the age effects were alleviated by an in-creased BMI level. The BMI and smoking effects were also examined in the MLR subcomponents: Higher BMI and be-ing a smoker were related to higher monocyte and lympho-cyte levels. For lympholympho-cyte count in women, there was
ev-idence for an age×BMI interaction, again indicating a
re-duction of the BMI effect at an older age.
Heritability
The known genetic relations among mono- and di-zygotic twins and their family members were used to model famil-ial resemblance in MLR, and monocyte and lymphocyte count as a function of genetic and environmental
param-eters. These models included sex, age, and sex×age effects
as fixed effects.Table 3contains the familial correlations as
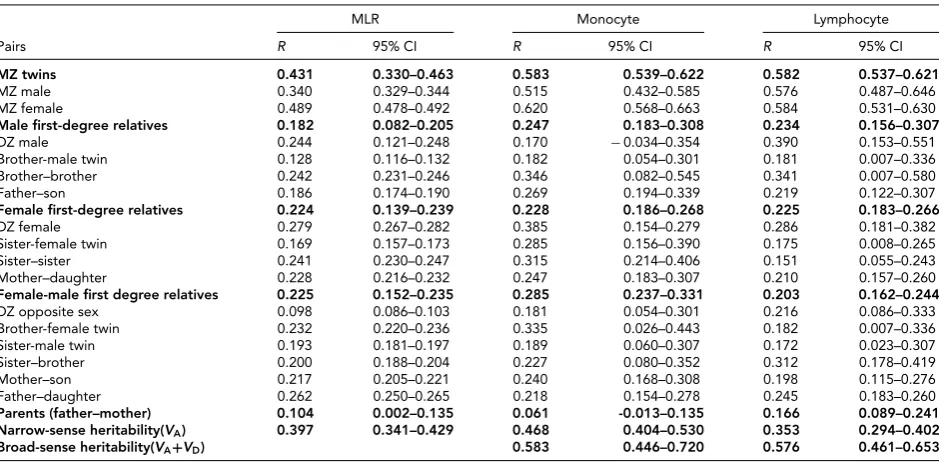
obtained for MLR, monocyte, and lymphocyte count. For MLR, twin pair correlations did not depend on sex, and the correlations did not differ across DZ twin and sibling rela-tions. The correlations in MZ males and MZ female twin pairs were equal as were the other male and female first-degree relative correlations. The resulting MZ correlation was 0.43 (CI is 0.33–0.46) and the DZ correlation was 0.22 (0.14–0.24), with spousal correlations significant at 0.104 (0.002–0.135). The pattern of twin correlations showed no evidence for non-additive or common environmental ef-fects. This was confirmed by model fitting in which the her-itability of MLR was estimated at 40% (0.34–0.43).
We also conducted these series of genetic modeling anal-yses for monocyte and lymphocyte count. For monocyte count, there were no significant spousal correlations and the MZ correlation was 0.58 (0.54–0.62) while the DZ corre-lation was 0.27 (0.21–0.31). In line with the pattern of the correlations, genetic modeling estimated the broad sense heritability at 58%, with non-additive effects accounting for 12% and no evidence for the influence of common envi-ronmental factors. For lymphocyte count, we estimated the
heritability in the current set (N=5,892, with>99%
over-lap with the set described in Lin et al., 2016) and, as to
be expected, results were similar to those published in Lin
et al. (2016) with a broad sense heritability at 58% and
non-additive effects accounting for 22%.
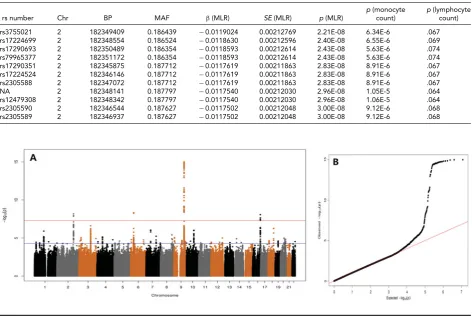
GWAS
Figures 1,2and3show the QQ and Manhattan plots from the GWAS for MLR, monocytes and lymphocytes. After ad-justing for age, sex, genotype platform, and PCs, and using the LOCO and family-based GRM correction, the GWAS
λs were 0.9965 for MLR and 1.0166 for monocyte count.
For MLR, associations were found with 11 SNPs situated
on theITGA4(VLA-4 subunit alpha) gene on chromosome
2q31 (Figure 1andTable 4). The top SNP rs3755021 T
al-lele was linked to a decrease in MLR level (β= −0.012,
p=2.21E-8). This SNP was not associated with
lympho-cyte count, but in our study was marginally significantly
associated with monocyte count (β= −0.018,p=
6.34E-6), and has also been associated with monocyte count in
a linkage study (Maugeri et al., 2011) and two previous
GWA studies (Crosslin et al.,2013; Nalls et al.,2011). The
G allele of rs6740847 in this region has been linked to
de-creasedITGA4expression levels in blood, which increases
the number of circulating monocytes and may indicate this
TABLE 3
Familial Correlations (Confidence Interval) for MLR Monocyte and Lymphocyte Count Within the Healthy Population
MLR Monocyte Lymphocyte
Pairs R 95% CI R 95% CI R 95% CI
MZ twins 0.431 0.330–0.463 0.583 0.539–0.622 0.582 0.537–0.621
MZ male 0.340 0.329–0.344 0.515 0.432–0.585 0.576 0.487–0.646
MZ female 0.489 0.478–0.492 0.620 0.568–0.663 0.584 0.531–0.630
Male first-degree relatives 0.182 0.082–0.205 0.247 0.183–0.308 0.234 0.156–0.307
DZ male 0.244 0.121–0.248 0.170 −0.034–0.354 0.390 0.153–0.551
Brother-male twin 0.128 0.116–0.132 0.182 0.054–0.301 0.181 0.007–0.336
Brother–brother 0.242 0.231–0.246 0.346 0.082–0.545 0.341 0.007–0.580
Father–son 0.186 0.174–0.190 0.269 0.194–0.339 0.219 0.122–0.307
Female first-degree relatives 0.224 0.139–0.239 0.228 0.186–0.268 0.225 0.183–0.266
DZ female 0.279 0.267–0.282 0.385 0.154–0.279 0.286 0.181–0.382
Sister-female twin 0.169 0.157–0.173 0.285 0.156–0.390 0.175 0.008–0.265
Sister–sister 0.241 0.230–0.247 0.315 0.214–0.406 0.151 0.055–0.243
Mother–daughter 0.228 0.216–0.232 0.247 0.183–0.307 0.210 0.157–0.260
Female-male first degree relatives 0.225 0.152–0.235 0.285 0.237–0.331 0.203 0.162–0.244
DZ opposite sex 0.098 0.086–0.103 0.181 0.054–0.301 0.216 0.086–0.333
Brother-female twin 0.232 0.220–0.236 0.335 0.026–0.443 0.182 0.007–0.336
Sister-male twin 0.193 0.181–0.197 0.189 0.060–0.307 0.172 0.023–0.307
Sister–brother 0.200 0.188–0.204 0.227 0.080–0.352 0.312 0.178–0.419
Mother–son 0.217 0.205–0.221 0.240 0.168–0.308 0.198 0.115–0.276
Father–daughter 0.262 0.250–0.265 0.218 0.154–0.278 0.245 0.183–0.260
Parents (father–mother) 0.104 0.002–0.135 0.061 -0.013–0.135 0.166 0.089–0.241
Narrow-sense heritability(VA) 0.397 0.341–0.429 0.468 0.404–0.530 0.353 0.294–0.402
Broad-sense heritability(VA+VD) 0.583 0.446–0.720 0.576 0.461–0.653
Note: Correlations in bold type were obtained from submodels in which all matching correlations of the tested subgroup of family relations were constrained to be equal.
FIGURE 1
(Colour online) Manhattan and QQ plot for MLR level with SNPs having a minor allele frequency above 0.01 (λ=0.996503).
For monocyte count, the four top hits were rs13029501 atITGA4,rs55929401 located at a region nearbyLPAR1at
9q31.3, rs391855 atIRF8, and rs9469532 at 6p21. The most
significant locus rs13029501 at 9q31 has been previously associated with monocyte count in European and Japanese
populations (Ferreira et al., 2009; Kamatani et al.,2010;
Maugeri et al.,2011; Nalls et al.,2011). This SNP is 14.6kb
upstream of the SNP most significant associated MLR level (rs3755021, the pair wise LD is 0.22). It is located in a region 163kb downstream of lysophosphatidic acid
receptor 1 gene (LPAR1, also known as EDG2) and
in-creasesLPAR1expression, which is linked to an increased
number of monocytes (Maugeri et al.,2011). As indicated
previously, genetic variants nearby the ITGA4region are
involved in the down regulation of ITGA4 expression,
which increases the number of monocytes circulating in
peripheral blood. TheIRF8gene has also been associated
before with monocyte count and has been identified as
multiple sclerosis susceptibility loci (De Jager et al.,2009).
Animal model studies showed thatIRF8as a transcription
factor plays an essential role in the regulation of lineage commitment during monocyte differentiation (Kurotaki
et al., 2013; Terry et al., 2015; Yanez et al., 2015). The
top SNP at 6p21 rs9469532 is an intergenic genetic
vari-ant nearby ITPR3, LOC101929188, and LOC105375023.
The HLA-DRB1 region 1,043kb upstream of this SNP has previously been associated with monocyte count
TABLE 4
Significant SNP Associations for MLR
p(monocyte p(lymphocyte
rs number Chr BP MAF β(MLR) SE(MLR) p(MLR) count) count)
rs3755021 2 182349409 0.186439 −0.0119024 0.00212769 2.21E-08 6.34E-6 .067
rs17224699 2 182348554 0.186524 −0.0118630 0.00212596 2.40E-08 6.55E-6 .069
rs17290693 2 182350489 0.186354 −0.0118593 0.00212614 2.43E-08 5.63E-6 .074
rs79965377 2 182351172 0.186354 −0.0118593 0.00212614 2.43E-08 5.63E-6 .074
rs17290351 2 182345875 0.187712 −0.0117619 0.00211863 2.83E-08 8.91E-6 .067
rs17224524 2 182346146 0.187712 −0.0117619 0.00211863 2.83E-08 8.91E-6 .067
rs2305588 2 182347072 0.187712 −0.0117619 0.00211863 2.83E-08 8.91E-6 .067
NA 2 182348141 0.187797 −0.0117540 0.00212030 2.96E-08 1.05E-5 .064
rs12479308 2 182348342 0.187797 −0.0117540 0.00212030 2.96E-08 1.06E-5 .064
rs2305590 2 182346544 0.187627 −0.0117502 0.00212048 3.00E-08 9.12E-6 .068
rs2305589 2 182346937 0.187627 −0.0117502 0.00212048 3.00E-08 9.12E-6 .068
FIGURE 2
(Colour online) Manhattan and QQ plot for monocyte count with SNPs having a minor allele frequency above 0.01 (λ=1.0166495).
FIGURE 3
(Colour online) Manhattan and QQ plot for lymphocyte count with SNPs having a minor allele frequency above 0.01 (λ=1.022341).
As published in Lin et al. (2016), there were no
sig-nificant hits when conducting the GWAS for lymphocyte count. However, it is of interest to note that the locus on chromosome 6p21, which was associated with the mono-cyte level, was also marginally associated with MLR (for
rs9469532,β= −0.069,p=7.69E-5) and lymphocyte count
(for rs114641912,β= −0.059,p=6.19E-6). This region
harbors candidate genes likeITPR3(Oishi et al.,2008) and
TABLE 5
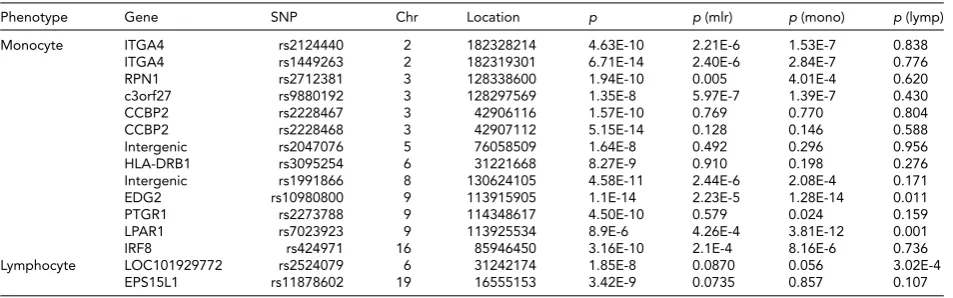
Known Blood Cell Count Loci and their Significance in Our GWAS
Phenotype Gene SNP Chr Location p p(mlr) p(mono) p(lymp)
Monocyte ITGA4 rs2124440 2 182328214 4.63E-10 2.21E-6 1.53E-7 0.838
ITGA4 rs1449263 2 182319301 6.71E-14 2.40E-6 2.84E-7 0.776
RPN1 rs2712381 3 128338600 1.94E-10 0.005 4.01E-4 0.620
c3orf27 rs9880192 3 128297569 1.35E-8 5.97E-7 1.39E-7 0.430
CCBP2 rs2228467 3 42906116 1.57E-10 0.769 0.770 0.804
CCBP2 rs2228468 3 42907112 5.15E-14 0.128 0.146 0.588
Intergenic rs2047076 5 76058509 1.64E-8 0.492 0.296 0.956
HLA-DRB1 rs3095254 6 31221668 8.27E-9 0.910 0.198 0.276
Intergenic rs1991866 8 130624105 4.58E-11 2.44E-6 2.08E-4 0.171
EDG2 rs10980800 9 113915905 1.1E-14 2.23E-5 1.28E-14 0.011
PTGR1 rs2273788 9 114348617 4.50E-10 0.579 0.024 0.159
LPAR1 rs7023923 9 113925534 8.9E-6 4.26E-4 3.81E-12 0.001
IRF8 rs424971 16 85946450 3.16E-10 2.1E-4 8.16E-6 0.736
Lymphocyte LOC101929772 rs2524079 6 31242174 1.85E-8 0.0870 0.056 3.02E-4
EPS15L1 rs11878602 19 16555153 3.42E-9 0.0735 0.857 0.107
Note: Chr=chromosome;p=pvalues from previous studies;p(mlr)=pvalues for MLR in current study;p(mono)=pvalues for monocyte count in current study;p(lymp)=pvalues for lymphocyte count in current study.
TABLE 6
Overview of eQTL Results: The Association Between Genetic Variants of Interest (β) with Gene Expression Level, Uncorrected for Blood
Composition
GWA SNP of Top SNP in
interest eQTL analysis Gene LDr2 β FDR
rs3755021 rs2305591 ITGA4 0.32 0.191 1.4e-05
rs13029501 rs2305591 ITGA4 0.03 0.203 1.34e-05
rs13029501 rs16867443 CERKL 0.43 0.132 1.34e-05
rs9469532 rs115378869 HLA-DPB1 0.04 0.106 3.07e-04
rs391855 rs1568391 IRF8 0.45 0.13 1.34e-05
rs55929401 rs7023923 LPAR1 0.24 0.42 1.34e-05
Note: LDr2: LD between GWAS SNP and top SNP in eQTL analysis.β=eQTLβof GWA SNP, FDR=eQTL FDR GWA SNP.
other loci with ‘potential association peaks’, meaningp
val-ues are low but do not reach the required significance level, have been found to be associated with immune disease
such asERAP1at 5q15 (Alvarez-Navarro et al.,2015) and
CNTN5at 11q22 (Thomas et al.,2014).
Table 5 shows the loci for monocyte and lymphocyte count found in previous studies and their significance lev-els for MLR and its subcomponents in the current study. For
some loci,pvalues were low, indicating a ‘potential’ for
as-sociation, even though they did not reach the required sig-nificance level. For example, rs9880192, located in the
inter-genic region betweenc3orf27and rs1991866, an intergenic
variant at 8q24.21, showspvalues<10−6for monocyte level
and<10−3for MLR.
eQTL Results
Among the significant GWA loci for MLR and blood cell counts, there were a number of associations between the
SNPs of interest and nearby gene expression (Table 6).
However, the SNPs identified in our GWAS have low LD (r2
<0.8) with the top SNPs associated with gene expression,
which suggest the GWAS SNPs are not part of the functional eQTL locus. Furthermore, no eQTLs with trans-effects were identified. In conclusion, we did not detect any cis- or trans-effects for the SNPs of interest.
GCTA and LD Score Regression
The results of the GCTA are shown inTable 7. From the
GCTA we found a narrow-sense heritability of 43.3% for MLR, 54.1% for monocyte count, and 51.7% for lympho-cyte count. The significant SNPs obtained in the GWAS for MLR explained 0.6% of the variance in MLR, and the significant SNPS obtained in the GWAS for mono-cyte count explained 4.4% of the variance in monomono-cyte count. All known loci from published literature together explained 1.3% of MLR variance, 2.4 % of monocyte count variance and 0.3% of lymphocyte count variance. In LD
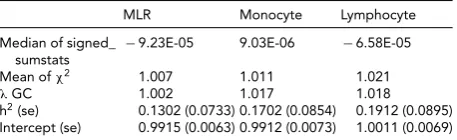
score regression, allλvalues were larger than the LD score
regression intercept, and intercepts were close to 1,
indi-cating that the inflation of thepvalue distribution from the
GWAS results is caused by polygenetic effects, rather than population stratification. The SNP heritability of MLR, monocyte count, and lymphocyte count when applying LD score regression was 13%, 17%, and 19%, respectively (seeTable 8).
In addition, we observed positive phenotypic
corre-lations between MLR and monocyte count (r = 0.550,
p<.0001) and between monocyte count and lymphocyte
count (r=0.386,p<.0001), and a negative phenotypic
cor-relation between MLR and lymphocyte count (r= −0.494,
TABLE 7
Narrow Sense Heritability (Standard Error) and the Proportion of Genetic Variance Explained by Known Significant SNPs (Standard Error) According to GCTA Analyses for Monocyte Count Ratio and its Subcomponents
Proportion of genetic Proportion of genetic
Narrow-sense variance explained by variance explained by
Phenotype heritability (SE) p significant SNPs (SE) p known loci (SE) p
MLR 0.43358 (0.025) 3.0E-8 0.005828 (0.008) 9.6E-9 0.01329 (0.006) 4.1E-13
Monocyte 0.5408 (0.022) 2.0E-12 0.043714 (0.024) 8.5E-5 0.02342 (0.009) 5.9E-11
Lymphocyte 0.51737 (0.023) 4.9E-8 NA NA 0.00274 (0.002) 0.014
Note:pvalues in bold type indicate significant estimates.
TABLE 8
LD Score Regression Results for MLR, Monocyte Count and Lymphocyte Count
MLR Monocyte Lymphocyte
Median of signed_
sumstats −
9.23E-05 9.03E-06 −6.58E-05
Mean ofχ2 1.007 1.011 1.021
λGC 1.002 1.017 1.018
h2(se) 0.1302 (0.0733) 0.1702 (0.0854) 0.1912 (0.0895) Intercept (se) 0.9915 (0.0063) 0.9912 (0.0073) 1.0011 (0.0069)
Note: Estimates for heritability and intercept with SE in brackets. All esti-mates are significant (p>0.05).
associations, no significant genetic correlations were de-tected between any pair of variables.
Discussion
We presented a detailed examination of the causes of vari-ance in MLR in the general population. Health status was, as expected, an important determinant of MLR level: indi-viduals with a compromised immune system, our so-called unhealthy group, had on average a higher MLR than the healthy participants. In the healthy population, smoking, sex, and age and their interactions were important determi-nants of variation in MLR and its subcomponents. Smoking was associated with a higher MLR and this is in line with the higher MLR in the individuals with a compromised im-mune system in our study and the higher MLR seen in can-cer patients. Genetic factors also were shown to play a role in MLR variation in the general population. Heritability for MLR was estimated at 40% and MLR level was associated
with a locus nearITGA4. Earlier studies have shown this
locus to be associated with monocyte levels. Heritability es-timates were higher for MLR subcomponents (58% for both lymphocyte and monocyte count) and, in contrast to MLR, there was evidence for non-additive effects. Monocyte level
was also associated withITGA4,and four more genes were
related to monocyte level in our analyses, replicating find-ings in previous GWA studies. For lymphocyte level, no sig-nificant genetic variants emerged.
From these results, it is clear that the genetic variants associated with blood cell counts may also influence their balance, as reflected in their ratios. In addition to the
ge-netic variants inITGA4genes, which were significantly
as-sociated with both MLR and monocyte count, there were
a number of loci that were significantly associated with monocyte count that may also affected MLR level: the
loci nearLPAR1,IRF8,andITPR3were marginally
signif-icant associated with MLR level. Also, a locus nearc3orf27
was marginally significantly associated with both MLR and monocyte count. We did not see evidence for pleiotropic ge-netic variants associated with MLR and lymphocyte count. To understand the role of the genetic variants in MLR varia-tion, we investigated what is known about the role the iden-tified genetic variants play in regulating gene expression. However, we did not find any evidence for cis-effects or trans-effects of these genetic variants.
Among three phenotypes, the narrow-sense heritability
h2of lymphocyte (35.3% in the healthy population) was the
lowest, but its SNP heritability was the highest (19.12% from the LD score regression). These results suggest more com-mon autosomal SNPs may be associated with lymphocyte count. The LD score regression results showed that poly-genetic effects, rather than confounding factors, explain both ratio and count variance. Although there are signif-icant overall correlations and an overlap in associated ge-netic variants has been detected between MLR and mono-cyte count, no significant genetic correlations were detected among variables, suggesting that the polygenetic effects are too small to be detected with the current sample size.
Overall, this series of studies provided more insight into the causes of variation in MLR within the general popu-lation. While the genetic pathways as well as non-genetic causes of variance still need more clarification, it is clear that these factors need to be taken into consideration when studying the relationship between MLR and disease devel-opment.
Acknowledgments
BD Lin is supported by a PhD grant (201206180099) from the China Scholarship Council. This study was supported by multiple grants from the Netherlands Organization for Scientific Research (NWO: 016-115-035, 463-06-001, and 451- 04–034), ZonMW (31160008 and 911-09-032); Institute for Health and Care
Re-search (EMGO+) and Neuroscience Campus Amsterdam
Research Infrastructure (BBMRINL: 184.021.007). Geno-typing was made possible by grants from NWO/SPI 56-464-14192, Genetic Association Information Network (GAIN) of the Foundation for the National Institutes of Health, Rutgers University Cell and DNA Repository (NIMH U24 MH068457-06), the Avera Institute, Sioux Falls (USA) and the National Institutes of Health (NIH R01 HD042157-01A1, MH081802, Grand Opportunity grants 1RC2 MH089951 and 1RC2 MH089995).
References
Abdellaoui, A., Hottenga, J. J., de Knijff, P., Nivard, M. G., Xiao, X., & Scheet, P. (2013). Population structure, migration, and diversifying selection in the Netherlands.European Journal of Human Genetics, 21, 1277–1285.
Al-Sufyani, A. A., & Mahassni, S. H. (2011). Obesity and im-mune cells in Saudi females.Innate Immunity, 17, 439–450. Alvarez-Navarro, C., Martin-Esteban, A., Barnea, E., Admon, A., & de Castro, J. A. L. (2015). Endoplasmic reticulum aminopeptidase 1 (ERAP1) polymorphism relevant to in-flammatory disease shapes the peptidome of the bird-shot chorioretinopathy-associated HLA-A∗29:02 antigen. Molecular & Cellular Proteomics, 14, 1770–1780.
Azab, B., Camacho-Rivera, M., & Taioli, E. (2014). Average values and racial differences of neutrophil lymphocyte ratio among a nationally representative sample of United States subjects.PLoS One, 9, e112361.
Boker, S., Neale, M., Maes, H., Wilde, M., Spiegel, M., & Brick, T. (2011). OpenMx: An open source extended structural equation modeling framework. Psychometrika, 76, 306– 317.
Boomsma, D. I., Willemsen, G., Sullivan, P. F., Heutink, P., Meijer, P., & Sondervan, D. (2008). Genome-wide associ-ation of major depression: Description of samples for the GAIN major depressive disorder study: NTR and NESDA biobank projects.European Journal of Human Genetics, 16, 335–342.
Bulik-Sullivan, B. K., Loh, P. R., Finucane, H. K., Ripke, S., Yang, J., & Patterson, N. (2015). LD score regression dis-tinguishes confounding from polygenicity in genome-wide association studies.Nature Genetics, 47, 291–295.
Bulik-Sullivan, B., Finucane, H. K., Anttila, V., Gusev, A., Day, F. R., & Loh, P. R. (2015). An atlas of genetic corre-lations across human diseases and traits.Nature Genetics, 47, 1236–1241.
Crosslin, D. R., McDavid, A., Weston, N., Zheng, X. W., Hart, E., & Andrade, M. (2013). Genetic variation associated with circulating monocyte count in the eMERGE Network. Hu-man Molecular Genetics, 22, 2119–2127.
De Jager, P. L., Jia, X., Wang, J., de Bakker, P. I., Ottoboni, L., & Aggarwal, N. T. (2009). Meta-analysis of genome scans and replication identify CD6, IRF8 and TNFRSF1A as new mul-tiple sclerosis susceptibility loci.Nature Genetics, 41, 776– 782.
Evans, D. M., Frazer, I. H., & Martin, N. G. (1999). Genetic and environmental causes of variation in basal levels of blood cells.Twin Research, 2, 250–257.
Farragher, T. M., Goodson, N. J., Naseem, H., Silman, A. J., Thomson, W., & Symmons, D. (2008). Association of the HLA-DRB1 gene with premature death, particularly from cardiovascular disease, in patients with rheumatoid arthri-tis and inflammatory polyarthriarthri-tis.Arthritis and Rheuma-tism, 58, 359–369.
Ferreira, M. A., Hottenga, J. J., Warrington, N. M., Medland, S. E., Willemsen, G., & Lawrence, R. W. (2009). Sequence variants in three loci influence monocyte counts and ery-throcyte volume.American Journal of Human Genetics, 85, 745–749.
Finucane, H. K., Bulik-Sullivan, B., Gusev, A., Trynka, G., Reshef, Y., & Loh, P. R. (2015). Partitioning heritability by functional annotation using genome-wide association summary statistics.Nature Genetics, 47, 1228–1235. Hall, M. A., Ahmadi, K. R., Norman, P., Snieder, H.,
MacGregor, A. J., & Vaughan, R. W. (2000). Genetic influence on peripheral blood T lymphocyte levels.Genes & Immunity, 1, 423–427.
Hanifin, J. M., & Cline, M. J. (1970). Human monocytes and macrophages. Interaction with antigen and lymphocytes. Journal of Cell Biology, 46, 97–105.
Howie, B., Fuchsberger, C., Stephens, M., Marchini, J., & Abecasis, G. R. (2012). Fast and accurate genotype impu-tation in genome-wide association studies through pre-phasing.Nat Genet, 44(8), 955–959.
Iqbal, S., Umbreen, A., & Zaidi, S. B. H. (2014). Monocyte lym-phocyte ratio as a possible prognostic marker in antituber-culous therapy.JRMC, 18(2), 178–181.
Jansen, R., Hottenga, J. J., Nivard, M., abdellaoui, A., Laport, B., & de Geus, E. J. (in press). Conditional eQTL analy-sis reveals allelic heterogeneity of gene expression.Human Molecular Genetics.
Kamatani, Y., Matsuda, K., Okada, Y., Kubo, M., Hosono, N., & Daigo, Y. (2010). Genome-wide association study of hema-tological and biochemical traits in a Japanese population. Nature Genetics, 42, 210–215.
Keller, M. F., Reiner, A. P., Okada, Y., van Rooij, F. J., Johnson, A. D., & Chen, M. H. (2014). Trans-ethnic meta-analysis of white blood cell phenotypes.Human Molecular Genetics, 23, 6944–6960.
Kurotaki, D., Osato, N., Nishiyama, A., Yamamoto, M., Ban, T., & Sato, H. (2013). Essential role of the IRF8-KLF4 tran-scription factor cascade in murine monocyte differentia-tion.Blood, 121, 1839–1849.
Li, J., Chen, Q. Y., Luo, X. H., Hong, J., Pan, K. Y., & Lin, X. H. (2015). Neutrophil-to-lymphocyte ratio positively corre-lates to age in healthy population.Journal of Clinical Lab-oratory Analysis, 29, 437–443.
Li, Y., Willer, C. J., Ding, J., Scheet, P., & Abecasis, G. R. (2010). MaCH: Using sequence and genotype data to estimate hap-lotypes and unobserved genotypes.Genetic Epidemiology, 34, 816–834.
Lin, B. D., Montoro, E., Bell, J., Boomsma, D. I., de Geus, E. J., & Jansen, R. (2016).SNP heritability and effects of ge-netic variants for neutrophil-to-lymphocyte and platelet-to-lymphocyte ratio. Manuscript submitted for publication. Liu, E. Y., Li, M., Wang, W., & Li, Y. (2013). MaCH-admix:
Genotype imputation for admixed populations. Genetic Epidemiology, 37, 25–37.
Maugeri, N., Powell, J. E., Hoen, P. A., de Geus, E. J., Willemsen, G., & Kattenberg, M. (2011). LPAR1 and ITGA4 regulate peripheral blood monocyte counts.Human Mutation, 32, 873–876.
Nalls, M. A., Couper, D. J., Tanaka, T., van Rooij, F. J., Chen, M. H., & Smith, A. V. (2011). Multiple loci are associ-ated with white blood cell phenotypes.Plos Genetics, 7, e1002113.
Nishijima, T. F., Muss, H. B., Shachar, S. S., Tamura, K., & Takamatsu, Y. (2015). Prognostic value of lymphocyte-to-monocyte ratio in patients with solid tumors: A systematic review and meta-analysis.Cancer Treatment Reviews, 41, 971–978.
Oishi, T., Iida, A., Otsubo, S., Kamatani, Y., Usami, M., & Takei, T. (2008). A functional SNP in the NKX2.5-binding site of ITPR3 promoter is associated with susceptibility to sys-temic lupus erythematosus in Japanese population.Journal of Human Genetics, 53, 151–162.
Okada, Y., Hirota, T., Kamatani, Y., Takahashi, A., Ohmiya, H., & Kumasaka, N. (2011). Identification of nine novel loci as-sociated with white blood cell subtypes in a Japanese pop-ulation.PLOS Genetics, 7(6), e1002067.
Pe’er, I., Yelensky, R., Altshuler, D., & Daly, M. J. (2008). Esti-mation of the multiple testing burden for genomewide asso-ciation studies of nearly all common variants.Genetic Epi-demiology, 32, 381–385. doi:10.1002/gepi.20303.
Perez-de-Heredia, F., Gomez-Martinez, S., Diaz, L. E., Veses, A. M., Nova, E., & Warnberg, J. (2015). Influence of sex, age, pubertal maturation and body mass index on circulating white blood cell counts in healthy European adolescents-the HELENA study.European Journal of Pediatrics, 174, 999–1014.
R Core Team. (2014).R: a language and environment for statis-tical computing. Vienna, Austria: R Foundation for Statisti-cal Computing.
Reiner, A. P., Lettre, G., Nalls, M. A., Ganesh, S. K., Mathias, R., & Austin, M. A. (2011). Genome-wide association study of white blood cell count in 16,388 African Americans: The Continental Origins and Genetic Epidemiology Network (COGENT).PLOS Genetics, 7, e1002108.
Schwartz, J., & Weiss, S. T. (1994). Cigarette smoking and pe-ripheral blood leukocyte differentials.Annals of Epidemiol-ogy, 4, 236–242.
Shabalin, A. A. (2012). Matrix eQTL: Ultra fast eQTL anal-ysis via large matrix operations.Bioinformatics, 28, 1353– 1358.
Sirota, M., Willemsen, G., Sundar, P., Pitts, S. J., Potluri, S., & Prifti, E. (2015). Effect of genome and environment on metabolic and inflammatory profiles. PLoS One, 10, e0120898.
Stata Corp. (2013).Stata statistical software: Release 13. Col-lege Station, TX: StataCorp LP.
Tenorio, T. R., Farah, B. Q., Ritti-Dias, R. M., Botero, J. P., Brito, D. C., & Moura, P. M. (2014). Relation between leukocyte count, adiposity, and cardiorespiratory fitness in pubertal adolescents.Einstein, 12, 420–424.
Terry, R. L., Deffrasnes, C., Getts, D. R., Minten, C., van Vre-den, C., & Ashhurst, T. M. (2015). Defective inflammatory monocyte development in IRF8-deficient mice abrogates migration to the west nile virus-infected brain.Journal of Innate Immunity, 7, 102–112.
Thomas, D., Gazouli, M., Karantanos, T., Rigoglou, S., Karamanolis, G., & Bramis, K. (2014). Association of rs1568885, rs1813443 and rs4411591 polymorphisms with anti-TNF medication response in Greek patients with Crohn’s disease. World Journal of Gastroenterology, 20, 3609–3614.
Tucker, G., Loh, P. R., MacLeod, I. M., Hayes, B. J., Goddard, M. E., & Berger, B. (2015). Two-variance component model improves genetic prediction in family datasets.American Journal of Human Genetics, 97, 677–690.
Willemsen, G., de Geus, E. J., Bartels, M., van Beijsterveldt, C. E., Brooks, A. I., & Estourgie-van Burk, G. F. (2010). The netherlands twin register biobank: A resource for genetic epidemiological studies.Twin Research and Human Genet-ics, 13, 231–245.
Willemsen, G., Vink, J. M., Abdellaoui, A., den Braber, A., van Beek, J. H., & Draisma, H. H. (2013). The adult netherlands twin register: Twenty-five years of survey and biological data collection.Twin Research and Human Genetics, 16(1), 271–281.
Wright, F. A., Sullivan, P. F., Brooks, A. I., Zou, F., Sun, W., & Xia, K. (2014). Heritability and genomics of gene expression in peripheral blood.Nature Genetics, 46, 430–437. Yanez, A., Ng, M. Y., Hassanzadeh-Kiabi, N., & Goodridge,
H. S. (2015). IRF8 acts in lineage-committed rather than oligopotent progenitors to control neutrophil vs monocyte production.Blood, 125, 1452–1459.
Yang, J., Lee, S. H., Goddard, M. E., & Visscher, P. M. (2011). GCTA: A tool for genome-wide complex trait analysis. American Journal of Human Genetics, 88, 76–82.
Zaitlen, N., Kraft, P., Patterson, N., Pasaniuc, B., Bhatia, G., Pollack, S., & Price, A. L. (2013). Using extended genealogy to estimate components of heritability for 23 quantitative and dichotomous traits.PLOS Genetics, 9, e1003520. Zaldivar, F., McMurray, R. G., Nemet, D., Galassetti, P., Mills,