Energy Consumption Anatomy of 802.11 Devices
and its Implication on Modeling and Design
Andres Garcia-Saavedra
*, Pablo Serrano
*, Albert Banchs
*†, Giuseppe Bianchi
‡{agsaaved,pablo,banchs}@it.uc3m.es, [email protected]
*Universidad Carlos III de Madrid †Institute IMDEA Networks ‡CNIT / Universita’ Tor Vergata
Avda. Universidad, 30 Avda. Mar Mediterráneo, 22 Via del Politecnico, 1
28911 Leganés, Spain 28918 Leganés, Spain 00133 Roma, Italy
ABSTRACT
A thorough understanding of the power consumption behav-ior ofreal worldwireless devices is of paramount importance to ground energy-efficient protocols and optimizations on re-alistic and accurate energy models. This paper provides an in-depth experimental investigation of the per-frame energy consumption components in 802.11 Wireless LAN devices. To the best of our knowledge, our measurements are the first to unveil that asubstantialfraction of energy consump-tion, hereafter descriptively namedcross-factor, may be as-cribed to each individual frame while it crosses the proto-col/implementation stack (OS, driver, NIC). Our findings, summarized in a convenient new energy consumption model, contrast traditional models which either neglect or amortize such energy cost component in a fixed baseline cost, and raise the alert that, in some cases, conclusions drawn using traditional energy models may be fallacious.
Categories and Subject Descriptors
C.2.1 [Computer-Communication Networks]: Network Architecture and Design—Wireless Communication
General Terms
Design, Experimentation, Measurement, Performance
Keywords
WLAN, 802.11, Energy consumption anatomy, Energy mea-surements, Cross-factor
1.
INTRODUCTION
The increase in energy density of current state of the art (Lithium-Ion) batteries is far from following Moore’s Law, the current challenge being “just” a twofold density increase in the next 10 years [37]. This is not a good technological premise behind the energy greediness of wireless connectiv-ity, second only to that required to backlight displays in
Permission to make digital or hard copies of all or part of this work for personal or classroom use is granted without fee provided that copies are not made or distributed for profit or commercial advantage and that copies bear this notice and the full citation on the first page. To copy otherwise, to republish, to post on servers or to redistribute to lists, requires prior specific permission and/or a fee.
Co-NEXT’12,December 10-13, 2012, Nice, France. Copyright 2012 ACM 978-1-4503-1775-7/12/12 ...$15.00.
most handheld devices. Moreover, battery powered wireless devices are becoming ubiquitous, and are frequently part of the network infrastructure itself; even besides the obvi-ous case of wireless sensor networks, battery powered relays or opportunistic intermediaries are widely considered in ad hoc, mesh, DTN scenarios, or emergency deployments.
It is hence not nearly a surprise that ahuge research ef-fort has been dedicated to find ways for reducing energy consumption in the wireless access and communication op-eration [24, 39]. For instance, with reference to the 802.11 WLAN (WiFi) technology [2], indeed the focus of this paper, energy efficiency improvements span very diverse aspects of the 802.11 operation, from management procedures [34], to usage of opportunistic relays [19] or infrastructure on de-mand [22], to PHY [31] and MAC [12] layer parameters’ optimizations, and so on.
Obviously, aquantitative treatment of the attainable en-ergy improvements is greatly simplified by the availability of realistic and accurate energy models, also considering that
fine-grained per-frame experimental measurements (versus coarse aggregate power consumption statistics) may be non trivial to achieve. Most of the literature works, including but not limited to [7, 9, 11, 12, 15, 17, 23, 30, 40], ground their proposed analyses, optimizations, or algorithm/protocol de-signs, on the widely accepted paradigm that the energy toll may be ascribed to two components: a baseline one, plus a second one linear with (transmission/reception) air time. The specific weights are of course tailored to the interface state (transmit, receive, idle, sleep), and can be gathered by data sheets [13] or experimental measurements [1, 16].
Questioning the classical per-frame energy model
With such a widespread acceptance, questioning the above mentioned classical energy model seems tough. Actually, such model makes perfectly sense if we just focus on the network interface card consumption. But, in practice, pro-cessing in the host device drains energy as well. So, the ques-tion at stake is whether (and to what extent) there is someenergy toll in the device, which is imputable to TX/RX pro-cessing, but which isimproperly accounted in such classical model, e.g., because it can be neither considered (i) indepen-dent of the radio operation and thus (implicitly) accounted in the fixed baseline energy consumption component, nor (ii) strictly proportional to the traffic load in bytes, hence (implicitly) accounted in the linear air time energy cost com-ponent.
a (we believe) compelling answer, via extensive and tailored experiments1 providing a detailed anatomy of the energy consumption in the protocol stack.
Two major findings appear to emerge. First, asubstantial
energy consumption occurs while a frame is delivered across the protocol stack, namely from the operating system to the driver to the NIC (and conversely for reception). Such “new” energy cost component, descriptively referred to as
cross-factor, cannot be neglected; on the contrary, in some experiments it even accounts tomore than halfof the per-frame energy cost. Second, such cross-factor can be neither dealt with as an extra baseline component, nor (perhaps more surprisingly) as a cost proportional to the traffic load. Actually, this energy toll appears mostlyassociated to the very fact that a frame is handled, i.e., irrespective (to a very large extent) of the actual frame size in bytes.2
Our findings, which we wrap into a convenient and easy to exploit new energy model, have a twofold implication. First, they suggest new energy reduction strategies, such as
batchingpackets while they travel across the protocol stack, or avoiding stack crossing when possible (the energy savings for both strategies are preliminary quantified via tailored experiments). Second, the fact that a substantial amount of energy is drained by the processing of packet units (i.e., inde-pendent of their size, or air time, or modulation and coding scheme) may play havoc with some specific optimizations proposed in the past. For instance, we show that energy-efficient optimizations leveraging relay nodes may yield qual-itatively different conclusions when the cross-factor energy component is accounted for.
Our contribution
This paper makes the following original contributions.
Power consumption characterization. In contrast to previous works, our measurement methodology is (i) based on a convenient power measurement device rather than spe-cialized hardware and complex measurement configurations; (ii) it exploits techniques to reduce measurement uncertain-ties due to scale limitation, and (iii) it characterizes thetotal
device power consumption versus that consumed by just the wireless interface.
Power consumption anatomy and unveiling of the cross-factor. Targeted measurements devised to break down the energy cost in specific components, reveal (and quantify) that a substantial fraction of energy is consumed by the pro-cessing of packets throughout the protocol/implementation stack. Suchcross-factorenergy toll exhibits two notable fea-tures: (i) in some (common) radio settings, it may become the dominantsource of energy consumption, and (ii) it is primarily associated to the frame processing itself, rather than to the amount of bytes handled. Interpreting such cost as proportional to the load seems thus intuitively appeal-ing, and may work as long as the frame size is fixed, but is incorrect for the general case of variable frame sizes.
New energy model and relevant validation. We summarize our findings in a simple and convenient energy model which overcomes traditional models limited to NIC
1Primarily on a Soekris net4826-48 device, but the general findings are duly confirmed by further measurements on two other platforms, an Alix2d2 and a Linksys WRT54GL. 2While some previous works had already identified a per-frame energy cost, such cost was ascribed to different factors from the ones we find in this paper (like e.g. control frames).
consumption [7, 9, 11, 12, 15, 17, 23, 30, 40]. We validate such new energy model with several experiments.
Practical implications. Focusing (for space reasons) on selected use-case examples, we show that some energy optimizations proposed in the past may yield fundamentally different conclusions when revisited with the awareness of our more realistic energy consumption findings. Of course, such conclusion may or may not apply on a case by case basis, but, on a more general line, our findings appear to raise the alert that there might be other cases where past conclusions should be reconsidered. Moreover, we discuss possible new means to take advantage of our findings for improved energy efficiency; we especially quantify, through software developed for measurement purposes, the savings introduced by two schemes that simplify the crossing of the protocol stack.
2.
RELATED WORK
Energy consumption of devices. A number of pre-vious works in the area analyze, like us, the consumption of the complete device, either a laptop [1, 3, 25] or a mo-bile phone [10, 33]. Some of these works deal with specific issues, such as quantification of the consumption of com-ponents other than wireless interfaces (e.g., CPU, screen, memory) [10], power consumption measurements via avail-able APIs for estimating the battery discharge state [25], as-sessment of trade-off between CPU consumption due to data compression and wireless consumption due to data transmis-sion [3], but do not tackle the per-frame energy consumption domain. Only [1] briefly mentions that the energy consump-tion associated to packet processing might be non negligi-ble, but does not provide any measurement or evidence. [33] finds that message size can have a non-intuitive impact on the energy consumption, but their guess is either the exis-tence of some power management threshold or a bug in the wireless firmware (indeed, energy bugs in mobile devices are a current concern [28]). We distinguish from all these works in the fact thatwe perform a fine-grained per-packet energy consumption decomposition, versus their energy consump-tion analyses on a much coarser scale.
Energy consumption of interfaces. Unlike the previ-ous papers, most characterizations of the wireless interface consumption are done on a per-packet basis. The seminal work of [16] shows that transmission/reception of an 802.11 frame has a linear dependency on its length. This result is caused by the four different states a wireless NIC can be in, namely: sleep, idle, receiving and transmitting. [16] also identifies a fixed cost per frame, caused by control frames (e.g., RTS/CTS). The results are extended in [14] for differ-ent modulation and coding schemes and transmission power configurations, and a similar approach is followed in a re-cent work [18] for the case of 802.11n. While in these cases the 802.11 interface is treated as a whole, [32] distinguishes between the (approximately constant) Application-Specific Integrated Circuit (ASIC) consumption, and the Power Am-plifier (PA) consumption occurring only outside idle periods. None of these works analyze the energy consumption of a frame as it is delivered to/from the NIC.
ac-tive, idle}[9, 11],{transmission, reception, idle}[15, 17, 40], and so on. More specifically, the common approach followed by all these papers (as well as that recently included in the NS3 network simulator [41]) is to model the NIC consump-tion using data sheet parameters [13], and add to this a fixed amount to account for the non-wireless power con-sumption of the device. In [30], the authors propose an extended model that accounts for the power conversion effi-ciency of the PA, but eventually the model suffers from the same limitations. As we will see in this paper, these energy consumption models fail to capture crucial aspects of how energy is consumed in real world devices, and therefore their use might bias conclusions.
Energy efficient mechanisms. Proposals for energy-efficient operation can be found at practically all layers of the 802.11 stack. Starting from the lowest layer, [31] pre-computes the optimal rate-power configuration for each data frame. Several works aim at reducing the energy wastage in the WLAN by adapting the contention parameters [12, 17] or extending the backoff operation [7, 23]. The use of co-operative relaying for energy efficiency is analyzed in [19]; [27] exploits idle period predictions to switch from active to sleep states. Increasing the sleep state time is the main energy saving target in the standard Power Saving Mecha-nism (PSM) [39], and in traffic management (and shaping) schemes such as NAPman [34], or in ‘infrastructure on de-mand’ schemes [22] devised to (de)activate Access Points based on client load. All these proposals are based either on (i) the energy consumption of the PA, which might be de-tailed but underestimates the consumption of the complete device, or on (ii) the coarse-grained estimated consumption of the complete device, which precludes a thorough under-standing of the per-packet delivery implications.
3.
METHODOLOGY TO MEASURE ENERGY
802.11 devices
For development convenience, most results have been ob-tained using aSoekris net4826-48device, equipped with an Atheros AR5414-based 802.11a/b/g Mini-PCI card, and configured to use the 802.11a PHY. The hardware comprises a 233MHz AMD Geode SC1100 CPU, 2 Mini-PCI sockets, 128 Mbyte SDRAM and 256 Mbyte compact flash circuits for data storage, extended with a 2 GB USB drive. The OS is a Gentoo 10.0 Linux (kernel 2.6.24), and the driver is MadWifi v0.9.4.
Two additional platforms, employing different WLAN PHY and bands, and different hardware architectures, have been further used to verify the most crucial findings (e.g., Fig. 1), to remove the doubt that such findings could be biased by the specifically chosen reference device or WLAN band/card/ PHY. These two additional platforms are: (i) anAlix2d2
device, equipped with a Broadcom BCM4319 802.11b/g Mini-PCI card, 500 MHz AMD Geode LX800, 256 MByte SDRAM, kernel 2.6.29, and (ii) aLinksys WRT54GLdevice, equip-ped with an integrated Broadcom BCM4320 802.11b/g chip-set, 200Mhz BCM5352 CPU, 16 MByte RAM, kernel 2.6.32. To generate traffic, we used themgentool3 to send UDP packets. Additional devices in monitor mode have been em-ployed to sniff all traffic to confirm that all wireless activity was caused only by our experiments. To ensure that no
pack-3http://cs.itd.nrl.navy.mil/work/mgen/
ets were dropped at any layer of the protocol stack, which may bias the conclusions of the results, we checked that the information logged by the system at the different layers matched the actual wireless transmissions that we observed through the external sniffer.
Power-related issues
Power consumption was measured via a low-cost PCE PA-6000 power meter,4 which provides instantaneous values of current voltage and power factor (among other parameters), at a sample rate above 3 sample/second. This instrument can be connected in series between an AC or DC power source and the device under study, withoutdismantling it, as for instance needed with some specialized equipments, which thus may restrict experimentation to, e.g., devices using card extenders.
For what concerns powering the devices while gathering measurements, we extensively tested two alternatives: via AC supply, and via DC supply. At last (discussion omit-ted for space reasons), we resoromit-ted to the second configu-ration, to prevent periodic AC power fluctuations from the wall socket which would have affected accuracy. The PCE PA-6000 power meter was thus powered with 6 AA batter-ies, and we employed a Protek 3033B device5 to power the wireless device.
3.1
Improving measurements accuracy
Power measurements were obtained by measuring the volt-age v and the current i, and taking the relevant product
p=v·i. Reducing the native inaccuracies of the measure-ment instrumeasure-ment employed was a major practical challenge. Indeed, according to the vendors’ specification sheet, the PA-6000 provides a resolution of Δv= 0.1V for the volt-age and Δi= 0.01Afor the current. Considering a typical baseline power measurement for the considered device, these inaccuracies yield the following relative errors:
v= 12.5±0.1V = 12.5V ±0.8%
i= 0.20±0.01A= 0.20A ±5%
p≈2.5±0.145W = 2.5W ±5.8%
where in the last power measurement expression we have made usage of the well known fact that the relative error for the productp=v·iis approximated by the sum of the relative errors forvandi[38].
Reducing uncertainty
In most of our experiments, an uncertainty in the order of more than 5% is too coarse, as it would undermine our abil-ity to quantify small, but for our purposes extremely mean-ingful, trends (e.g., power consumption variations for an in-creased frame size). The methodology that we followed in order to improve this accuracy6 consists in using, instead of a single device, K devices in parallel running the same experiment(over different non-interfering wireless channels,
4http://www.industrial-needs.com/technical-data/ power-analyser-PCE-PA-6000.htm
5http://www.protektest.com/ProdInfo.asp? prodId=3033B
Table 1: Accuracy improvement with K devices.
K v(V) iK (A) pK (W) pd(W)
1 12.6
±0.1 0.19
±0.01
2.4±6.1 % 2.4 ±6.1 %
2 12.4 0.41 5.1±3.2 % 2.5 ±3.2 %
3 12.2 0.63 7.7±2.4 % 2.56±2.4 %
4 12.3 0.84 10.3±2.0 % 2.58±2.0 %
of course). Thus, the instrument’s uncertainty on the cur-rent measurements, namely 0.01 A, now applies to thetotal
current (as well as the total power, voltage being the same) drained by theK(equivalent) devices, yielding a relative er-ror reduction of a factorK. The power consumed by a single device is finally computed as 1/Kth of the total power, with the same (reduced) relative error (division by a constant does not affect the relative error [38]).
Table 1 shows measurements taken over 30 seconds on
K= 1 to 4 devices in parallel, for the case of devices with-out wireless interfaces, which is the configuration that con-sumes the least power and therefore has the largest relative errors. The table reports measured voltagev, total current
iK, total consumed power pK with associated uncertainty, and per-device consumed power pd with associated uncer-tainty. WithK = 4, accuracy improves from about 6% of single device measurements to a more satisfactory 2%.7
In the rest of the paper we use such a parallel device
methodology in which each experiment is conducted withK different devices of the same type (software and hardware) performing the same operations. Unless otherwise specified, we will use K = 4 for 802.11a and K = 3 for 802.11g.8 As shown by the results of the next section, theseKvalues provide sufficient accuracy to analyze the behavior of the different energy components of 802.11 devices.
4.
ENERGY CONSUMPTION ANATOMY
In order to characterize the power consumption of the 802.11 devices, we have conducted an in-depth experimental investigation of the considered 802.11 devices. For space reasons, all the measurements presented here are for the devices operating under the infrastructure mode; however, we verified that the devices show a very similar behavior when operating under the ad-hoc and monitor modes.
A pre-requirement for characterization of 802.11 devices consists in quantifying their “baseline” power consumption, i.e., when the devices neither send nor receive traffic. Ta-ble 2 reports measurements for the Soekris platform in three “baseline” configurations. Note that plugging the wireless card (“WiFi off”) increases consumption by 0.29 W (+12.6%), whereas loading the driver and associating to an AP (“Idle”) further increases the consumption by 0.98 W, indeed an ex-tra 25% increment. The power consumed in the “Idle” state, namedρid, will be used as baseline reference in what follows.
4.1
Understanding transmission costs
Results in this section aim at characterizing the energy cost of transmissions, and providing our best effort to ac-7From the experiments conducted in this paper, we con-firmed that the maximum difference observed between our measurements and the proposed model matches the mea-surement inaccuracy predicted, which validates the results of this section.
8The reason for usingK= 3 in the latter case is that 802.11g only allows 3 non-interfering channels.
Table 2: Soekris Baseline consumption profile
Config. Description Cons. (W)
w/o card no NIC connected 2.29±2.2%
WiFi off NIC connected 2.58±2.0%
driver not loaded (+0.29)
Idle(ρid) NIC activated+associated to AP 3.56±1.7%
no RX/TX besides beacons (+0.98)
curately explain and justify the relevant findings. For this reason, in the remainder of this section, results are obtained for unicastunacknowledgedframes, so as to avoid biasing re-sults with the cost of ACK reception (separately quantified later on). ACKs have been disabled by setting the noack-policy bit of the WMM parameters for the Access Point parameter set: this introduces an Information Element in beacon frames that prevents associated stations from reply-ing with ACKs (confirmed by sniffed traces). Unless oth-erwise specified, each result is obtained by measuring the power consumption over a 20 seconds experiment.
Transmission power consumption patterns
A large number of total device power consumption mea-surements have been carried out, spanning several combi-nations of four quantities/parameters: (i) frame size L in the range 100 to 1500 bytes, (ii) modulation and coding schemes (MCS ∈ {6, 12, 24, 48} Mbps), (iii) configured transmission power9 (txpower ∈ {6, 9, 12, 15} dBm), and (iv) frame generation rateλg, up to 2000 frames per second (fps).
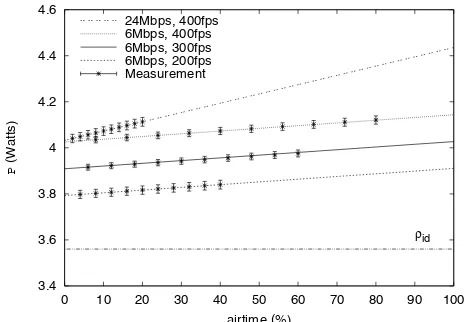
It turns out that the most insightful way to represent such results is viapower/airtime plots, shown in Fig. 1.10 Since these results appear crucial, we repeated them for all the three platforms (Soekris in Fig. 1-a, Alix in Fig. 1-b, and Linksys in Fig. 1-c), adapting when needed the parameters (for instance, the very cheap Linksys device cannot sustain a load greater than about a thousand fps). Such plots report the average power consumed by the whole device, versus the percentageτtxof channel airtime, computed as
τtx=λgTL, (1)
where λg is the frame generation rate, andTL=TP LCP + (H +L)/MCS is the time required to transmit a frame of size L using the modulation and coding scheme MCS, duly accounting for the Physical Layer Convergence Pro-tocol preamble TP LCP, and the MAC overhead H (MAC header plus FCS). For reference purposes, the plots also re-port the baseline power consumption ρid when the target device is in “Idle” state.
Besides thequantitativedifferences among the considered platforms, these plots provide compelling evidence that the total device power consumption, denotedP, appears artic-ulated into three main components,11
P=ρid+Ptx+Pxg(λg), (2)
9We have selected four values within the range of allowed transmission power values, which goes from 5 to 15 dBm. 10The values shown in the figures are the result of applying a
simple linear regression to the measurements and computing their standard asymptotic error [26].
3.5 4 4.5 5 5.5 6 6.5
0 10 20 30 40 50 60 70 80 90 100
P
(Watts)
airtime (%)
id 24Mbps, 1200fps, 15dBm
24Mbps, 400fps, 15dBm 6Mbps, 400fps, 15dBm 6Mbps, 400fps, 5dBm Measurement
(a) Soekris
3.6 3.8 4 4.2 4.4 4.6 4.8 5
0 10 20 30 40 50 60 70 80 90 100
P
(Watts)
airtime (%)
id 24Mbps, 1200fps, 15dBm
24Mbps, 400fps, 15dBm 6Mbps, 400fps, 15dBm 6Mbps, 400fps, 5dBm Measurement
(b) Alix
2.6 2.8 3 3.2 3.4 3.6 3.8 4 4.2 4.4
0 10 20 30 40 50 60 70 80 90 100
P
(Watts)
airtime (%)
id 24Mbps, 800fps, 15dBm
24Mbps, 400fps, 15dBm 6Mbps, 400fps, 15dBm 6Mbps, 400fps, 5dBm Measurement
(c) Linksys Figure 1: Total power consumed by (unacknowledged) transmissions vs. airtime percentage τtx.
0 0.5 1 1.5 2 2.5
0 500 1000 1500 2000
Pxg
(Watts)
g (fps) 6Mbps,15dBm
12Mbps,15dBm 24Mbps,15dBm 48Mbps,15dBm
6Mbps, 12dBm 12Mbps,12dBm 24Mbps,12dBm 48Mbps,12dBm
6Mbps, 9dBm 12Mbps,9dBm 24Mbps,9dBm 48Mbps,9dBm
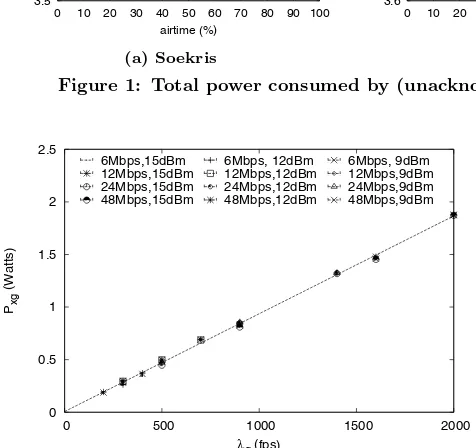
Figure 2: Relation betweenPxg(λg) and λg.
where:
• The first component,ρid, is the (platform-specific) base-line power consumption;
• The second component, Ptx, is the classical one in traditional energy consumption models, which linearly grows with the airtime percentageτtx, i.e.,Ptx=ρtxτtx. The slope ρtxdepends on the target platform and on the radio transmission parameters MCS andtxpower: the greater the MCS and/or thetxpower, the greater the slope;
• The third component, Pxg(λg), accounts for the fact that the above linear trend does not start from the baseline power consumption levelρid, but ratherstarts
from a relatively large positive offset(e.g., in the Soekris case, +12% and +35% increment over the baseline level ρid for 400 and 1200 fps, respectively); offset which is not accounted by classical energy models [7, 9, 11, 12, 15, 17, 23, 30, 40]. Moreover, Fig. 1 suggests that such component depends only on the frame gen-eration rateλg.
Per-frame processing toll
To more closely investigate the nature of such emerging power consumption offsetPxg(λg), Fig. 2 plots its value ob-tained from several measurements taken for different con-figuration of the NIC parameters (MCS,txpower) over the Soekris platform (results are qualitatively analogous for the
TCP/IP Driver ASIC PA
Kernel space Wireless NIC
mgen
User space
(a) (b) (c)
Figure 3: Interfaces and modules crossed during transmission.
other two platforms). The plot clearly shows that Pxg(λg) is proportional to the frame generation rate λg, whereas it is practicallyindependent ofthe frame size or the radio set-tings.
Thus, if we denote withγxg=Pxg(λg)/λgthe proportion-ality constant, it appears thatγxg is theenery toll
associ-ated to the processing of each individual frame, irrespective of its size or radio transmission parameters. Note that this energy toll isnot associated to protocol operations such as RTS/CTS or ACKs, indeed disabled in such experiments.
Cross-factor
To grasp deeper insights on the reasons behind such a per-frame energy tollγxg, (namedcross-factor, for reasons that will become clear throughout this section), we have engi-neered tailored measurements on the Soekris platform, de-vised toquantifyhow this energy toll splits across the frame processing chain along the protocol-implementation stack (roughly) depicted in Fig. 3.
Specifically, we have run three sets of experiments, where we discard packets at a given level of the stack and we mea-sure the relevant power consumed up to that level:
• App. - packets are regularly generated bymgen, but are discarded before being delivered to the OS, i.e., at the mark (a) in Fig. 3, by sending them to the “sink device” (/dev/null);
• TCP/IP- packets are discarded at the bottom of the TCP/IP stack (mark (b) in Fig. 3), by deactivating the ARP lookup function, so that the device cannot retrieve the MAC destination from the ARP cache and therefore must drop the frame;
0 0.2 0.4 0.6 0.8 1.0 1.2 1.4 2.2 2.4 2.6
App.TCP/IPDriverTotalModel App.TCP/IPDriverTotalModel App.TCP/IPDriverTotalModel App.TCP/IPDriverTotalModel App.TCP/IPDriverTotalModel0 0.2 0.4 0.6 0.8 1.0 1.2 1.4 2.2 2.4 2.6
per-frame energy (mJ)
48Mbps 100B/Packet
300 fps
48Mbps 100B/Packet
1200 fps
48Mbps 750B/Packet
1200 fps
48Mbps 1400B/Packet
1200 fps 6Mbps 1400B/Packet
400 fps Measurement
Model: transmission Model: cross-factor
Figure 4: Per-frame energy cost in transmission.
Representative measurements (energy per frame) are shown in Fig. 4, along with the total energy consumption per prop-erly transmitted frame (‘Total’) and the values predicted by applying equation 2 (‘Model’).
The figure clearly shows that the energy toll due to frame processing is practically independent of the frame genera-tion rate andthe frame size. Moreover, it shows that the energy consumed while crossing the host device stack (i.e., up to the driver included) issubstantial, around 0.75 mJ per frame, and may become the major energy cost in several scenarios (e.g., short packets and/or large MCS - in essence short airtime).
Finally, even if direct measurements were not technically attainable below the driver level, Fig. 4 permits to deter-mine that a further constant per-frame energy drain occurs at the driver-to-NIC interface level and/or below. Its quan-tification may be estimated by analyzing the energy con-sumed with very short packets and large MCS, being wireless transmission cost marginal in this case (very small airtime). Summarizing, for a Soekris device, the cross-factor coeffi-cient amounts to about 0.93 mJ. Such per-frame processing cost appears to roughly split as follows: 24% application; 33% TCP/IP stack, 21% driver, and 22% NIC.
The above results clearly show that the energy toll is caused by the frame processing at the different layers of the protocol stack, which depends on the operating system implementation. To gain insight into the impact of the OS on the cross-factor, we evaluated the energy consumption of Soekris devices running OpenBSD. The measurements ob-tained confirm that the qualitative behavior with OpenBSD is the same as with Linux, and show that the cross-factor is of the same order for both operating systems (1.27 mJ for OpenBSD and 0.93 mJ for Linux).
A key result from the above is that the the energy toll is independent of the frame size. To better understand the rea-sons for this, we conducted some tailored experiments with applications that perform memory and CPU operations with data elements of different sizes, and observed that the result-ing energy consumption is largely independent of the size of the data elements involved. This explains why the energy consumed in crossing the stack, which involves similar types of operations, is agnostic of the frame size.
0 0.2 0.4 0.6 0.8 1
0 1 2 3 4 5
Pxg
+P
tx
+P
retx
(Watts)
R Measurement
Model: Pxg Model: Ptx Model: Pretx
Figure 5: Impact of retransmissions on the power consumption.
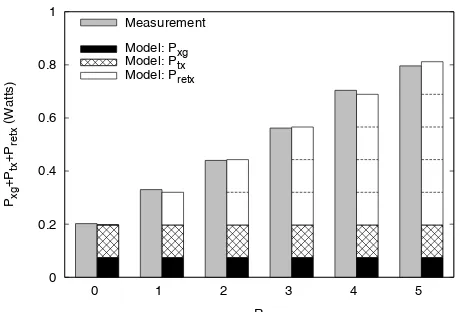
Retransmissions
Intuitively, retransmissions at the MAC layer, e.g. after a failed transmission, should not be affected by the cross-factor toll. This can be verified by provisionally assuming
that this is the case, i.e., modeling retransmission cost as purely due to the over the air transmission cost component, and then checking whether the resulting model matches ex-perimental measurements.
Along this line, letPretxbe the power drained by retrans-missions, and assume that
Pretx=R·ρtxτtx=R·ρtxλgTL. (3) where R is the number of retransmissions. Then, thetotal
power consumed by packets retransmittedRtimes is readily obtained as the baseline componentρidplus:
Pxg(λg) +Ptx+Pretx, (4) where the first addendum is the per-frame processing toll (paid once), the second addendum is the power consumed by the very first transmission, and the last addendum is the extra retransmission cost as per (3). Fig. 5 compares the modeling prediction (4) with the power (additional to the baseline component ρid) consumed by a device configured to send 1400 B UDP frames generated at a rate of 80 fps to fake addresses (to prevent the reception of ACKs). The number of allotted retransmissions R (configured via the ah_setupTxDescdriver’s descriptor) was varied from 0 to 5, and, for simplicity (i.e., to avoid the need to non trivially configure the driver so as to prevent MCS downgrade in front of persistent losses), frames were transmitted over the wireless channel using the 6 Mbps basic MCS. As shown in Fig. 5, theoretical results tightly match the experimental measurements, thus confirming that the cross-factor has (if any) negligible impact on retransmission.
4.2
Reception power consumption analysis
The analysis of the power consumption of the device while3.4 3.6 3.8 4 4.2 4.4 4.6
0 10 20 30 40 50 60 70 80 90 100
P
(Watts)
airtime (%)
id 24Mbps, 400fps
6Mbps, 400fps 6Mbps, 300fps 6Mbps, 200fps Measurement
Figure 6: Power consumed by (unacknowledged) re-ception versus airtime.
in Fig. 6 (Soekris device), airtime now given byτrx=λrTL. Thetxpowerparameter is not shown, as it does not affect the power consumption (as indeed well known from [14]).
Fig. 6 exhibits the same qualitative pattern found in the transmission scenario. The increment of the power consump-tion overρidis composed of two components: a first one lin-ear with the airtime and accounting for the power required to receive frames, Prx (indeed in line with traditional en-ergy models), and a second one proportional to the number of frames received and accounting for the cross-factor energy toll,Pxr(λr). The total power consumption at the receiving side is thus:
P=ρid+Prx+Pxr(λr) =ρid+ρrxτrx+λrγxr, (5)
whereγxris the cross-factor in reception, i.e., the per-packet processing toll to deliver the received frame across the pro-tocol stack, andρrxτrxis the traditional reception cost pro-portional to the airtime. Again, Fig. 6 confirms that results from the above equation (lines) closely match the experi-mental measurements (symbols).
4.3
Characterization of additional aspects
To complete our anatomy, it remains to characterize the additional power consumed for sending/receiving acknowl-edgments (both the previous sections have considered unac-knowledged operation), and the power consumption experi-enced while overhearing a collision.ACKs and other control frames
Since ACK frames, like retransmissions, do not have to cross the stack but are internally generated by the NIC, we assume that their power consumption can be characterized by just the cost of the relevant ACK transmission or reception. Un-der such assumption, the power consumed for replying with ACKs to received frames (arriving at rate λr) is trivially given by
Ptx,Ack=ρtxλrTAck, (6)
where TAck =TP LCP +ACK/MCSC is the time required to transmit an ACK frame, i.e., a PLCP preamble plus the 14B ACK frame transmitted at the modulation and coding schemeMCSC configured for control traffic. Similarly, the
0 0.2 0.4 0.6 0.8 1 1.2 1.4 1.6
6 Mbps
100B 6 Mbps550B 48 Mbps100B 48 Mbps550B 48 Mbps1000B Pxr
+P
rx
+P
tx,Ack
(Watts)
Measurement
Model: Pxr + Prx Model: Ptx,Ack
Figure 7: Impact of ACKs on reception.
power consumed to receive an ACK is readily computed as
Prx,Ack=ρrxλgTAck. (7)
For space reasons, we show in Fig. 7 the experimental valida-tion for the ACK transmission case, only. Such experimental results, obtained withλr= 1000 fps, confirm that the mea-surements match the results predicted by the model, which includes the energy consumed by the reception of frames (Pxr+Pxr) and the transmission of the ACKs (Ptx,Ack).
We also verified that other control frames that do not cross the stack, such the RTS and CTS frames, show the same behavior and their consumption is given by the cost of the corresponding transmission or reception only (results are not shown for space reasons).
Collisions and other transmissions
At last, we analyze the impact on the energy consumption in reception when the medium is occupied by collisions or by transmissions addressed to another device (i.e., sent to another MAC address).
To analyze the energy consumed by collisions, we config-ured a communication between two nodes and set up another node to act as interferer. This interferer was implemented by setting the carrier sense threshold at the highest value, which practically results in no carrier sensing, and using the lowest values for the CW, SIF S and MCS parame-ters while deactivating the use of ACKs. In order to control the amount of time the interferer was sending data (i.e., the ‘interference rate’), we used thequiet elementoption to si-lence the interface for a given amount of time every beacon period. Prior to our measurements, we performed extensive tests using different configurations of thetxpower parame-ter and varying the relative physical location of the devices, to have a configuration in which simultaneous transmissions resulted in all frames being lost (i.e., no capture effect).
Table 3: Impact of collisions on reception.
Sent Int. Rate Received Meas. Model
1.2 Mbps 0% 1.2 Mbps 3.67 3.68
2.4 Mbps 50% 1.2 Mbps 3.67 3.68
2.4 Mbps 100% 0 Mbps 3.56 3.56
2.4 Mbps 0% 2.4 Mbps 3.80 3.81
4.8 Mbps 50% 2.4 Mbps 3.80 3.81
4.8 Mbps 100% 0 Mbps 3.56 3.56
To analyze the impact of the transmissions addressed to another station, we configured a communication between two nodes and measured the energy consumption at a third node that was in the transmission range of this communica-tion. We observed that the energy consumed by this node was the same as if the medium was idle, which confirms that transmissions addressed to other stations practically do not consume energy. This is in agreement with our previous re-sults: according to (5), the energy cost of listening to the PLCP plus headers is only 38μJ/frame (for 6 Mbps MCS), which has practically no impact on the overall consumption.
5.
ENERGY CONSUMPTION MODEL
The complete model
Based on the results obtained in the previous section, we now build thecomplete model for the power consumption of 802.11 devices. Summarizing our findings of (1)–(7), we have that the power consumed by an 802.11 device consists of the following components: (i) the idle consumption,ρid, (ii) the cross-factor for the packets generated by the application,
Pxg, (iii) the power required to transmit them,Ptx, (vi) the power consumed in retransmissions, Pretx, (v) the power spent in receiving frames,Prx, (vi) the cross-factor for the received frames,Pxr, and (vii) the power spent on sending and receiving ACK frames,Prx,AckandPtx,Ack:
P=ρid+Ptx+Pxg+Pretx+Prx+Pxr+Prx,Ack+Ptx,Ack.
(8) By substituting the expressions obtained in the previous section for all the above components and regrouping the terms, we obtain:
P = ρid+ρtx(λgTL+λgTLR+λrTAck)
+ ρrx(λrTL+λgTAck) +γxgλg+γxrλr. (9)
By taking into account thatλgTL+λgTlR+λrTAck cor-responds to the transmission airtime percentage τtx, and
λrTL+λgTAckto reception airtime percentageτrx, the above equation can be rewritten as:
P=ρid+ρtxτtx+ρrxτrx+γxgλg+γxrλr. (10)
The above expression gives the model for the power con-sumption of an 802.11 device that we propose in this paper. As already mentioned in the previous section, the key differ-ence between the above model and the ‘traditional’ one used in many previous works [7, 9, 11, 12, 15, 17, 23, 30, 40] is that the traditional model only includes the first three compo-nents (namelyρid,ρtxτtxandρrxτrx) while our model adds to these three components two additional ones (γxrλr and
γxgλg). As shown by our measurements, these two addi-tional components account for a very significant portion of the power consumption, which renders the traditional model highly inaccurate.
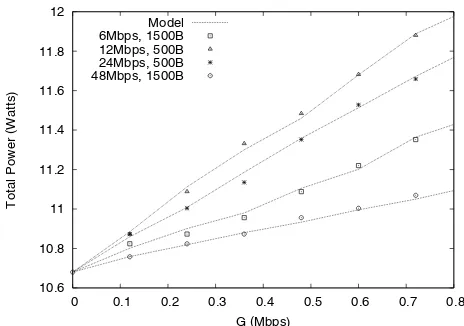
10.6 10.8 11 11.2 11.4 11.6 11.8 12
0 0.1 0.2 0.3 0.4 0.5 0.6 0.7 0.8
Total Power (Watts)
G (Mbps) Model
6Mbps, 1500B 12Mbps, 500B 24Mbps, 500B 48Mbps, 1500B
Figure 8: Model validation with multiple stations.
Out of the 9 variables in (10), 5 are constant parameters that depend on the device and the configuration of its com-munication parameters (ρid,ρtx,ρrx,γxrandγxg), while the other 4 parameters are variables that depend on the num-ber of stations in the WLAN and their traffic generation behavior (τtx,τrx,λr andλg). In the following, we charac-terize the 5 constant parameters that determine the power consumption of the considered 802.11 devices for different values of MCSand txpower. To obtain these parameters, we use the expressions for the simple linear regression and the standard asymptotic error [26]. Following this, we ob-tain the numerical values given in Tables 4, 5 and 6 for the parameters that characterize the energy consumption of the Soekris, the Linksys and the Alix devices, respectively.
Model Validation
To validate our model in a general scenario with multiple sending and receiving stations, we consider a WLAN with one AP and three stations. Each station generates unicast traffic to the AP at a rateG, while the AP sends unicast traf-fic at the same rate Gto each station. To apply the model of (10), we need to obtain the parametersτtx,τrx,λr and
λg. These can be obtained from typical statistics recorded by the wireless driver, namely, number of generated frames (Ng), successful frames (Ntx), transmissions attempts (Nat), and received frames (Nrx). With these, if the experiment is run for a duration ofT,λg andλrare computed as
λg=Ng/T, λr =Nrx/T. (11)
To computeτtxwe account for all transmission attempts of the device plus the time spent sending the Acks, i.e.,
τtx= (NatTL+NrxTAck)/T. (12)
Similarly, to computeτrxwe need to take into account the frames and the Acks received,
τrx= (NrxTL+NtxTack)/T. (13)
Table 4: Parametrization of the power consumption model for the Soekris device.
MCS 6 Mbps 12 Mbps 24 Mbps 48 Mbps
ρrx(W) 0.16±8% 0.27±5.6% 0.6±11% 1.14±3.5%
ρtx(W)
6 dBm 0.52±3.1% 0.55±4.6% 0.81±5.3% 1.2±1.6% 9 dBm 0.57±2.1% 0.59±1.8% 0.88±2.3% 1.24±2.7% 12 dBm 0.70±1.7% 0.73±2.2% 1.02±2.8% 1.37±3.1% 15 dBm 0.86±2.2% 0.89±2.3% 1.17±2.5% 1.58±3.3%
ρid(W) 3.56±1.7% γxg(mJ) 0.93±1.2% γxr (mJ) 0.93±2.2%
Table 5: Parametrization of the power consumption model for the Linksys device.
MCS 6 Mbps 12 Mbps 24 Mbps 48 Mbps
ρrx(W) 0.19±5.3% 0.29±3.4% 0.53±2.3% 0.74±4.4%
ρtx(W)
6 dBm 0.70±1.1% 0.72±2.2% 0.75±2.0% 0.81±3.7% 9 dBm 0.77±1.4% 0.81±2.6% 0.84±2.3% 0.88±3.4% 12 dBm 0.84±1.2% 0.85±1.5% 0.92±2.4% 0.99±4.0% 15 dBm 0.97±0.9% 1.0±1.5% 1.04±2.1% 1.08±3.7%
ρid(W) 2.73±0.4% γxg(mJ) 0.46±3.3% γxr (mJ) 0.43±4.2%
Table 6: Parametrization of the power consumption model for the Alix device.
MCS 6 Mbps 12 Mbps 24 Mbps 48 Mbps
ρrx(W) 0.24±4.2% 0.27±3.7% 0.31±6.4% 0.44±6.8%
ρtx(W)
6 dBm 0.27±7.4% 0.33±9.1% 0.35±11.4% 0.38±5.2% 9 dBm 0.30±6.7% 0.35±8.6% 0.36±11.1% 0.39±5.3% 12 dBm 0.35±5.7% 0.38±7.9% 0.39±7.7% 0.43±7.0% 15 dBm 0.4±7.5% 0.44±6.8% 0.45±8.9% 0.46±8.7%
ρid(W) 3.68±0.5% γxg (mJ) 0.11±7.6% γxr (mJ) 0.09±8.5%
6.
IMPLICATIONS ON DESIGN
The new energy consumption insight gathered in this pa-per may have significant implications on the design of energy-efficient mechanisms. On the one hand, existing schemes may need to be revisited so as to properly account for the impact of the cross-factor component. Indeed, according to traditional power consumption models (i.e., only baseline component plus a toll proportional to the airtime), mech-anisms yielding shorter airtimes would surely bring about energy gains. With the cross factor, thismight not be any-more the case, when the power savings attained at the radio interface are paid with an increased frame handling and its associated (non marginal) power consumption. On the other hand, the gained knowledge that a frame crossing the stack brings about afixedpenalty unrelated to the frame size may be exploited to devise techniques to avoid or reduce such energy toll.
In the following, with no pretense of completeness, we present quantitative examples that show how our new in-sights may affect existing energy efficient mechanisms as well as inspire novel approaches.
6.1
Reconsidering existing schemes
Packet relaying
Packet relaying in WLANs is commonly used to improve performance [6] and energy efficiency [19]. The rationale is that the use of a relay permits shorter transmission times, which compensate the impact of the extra number of hops, introducing a net gain. However, classical energy-efficiency analyses do not balance the airtime energy saving with the energy drain introduced by the additional frame processing,
a penalty which mayfundamentally affect the relevant con-clusions.
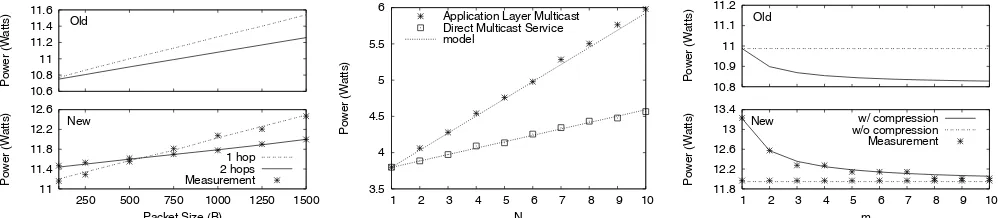
To quantitatively support this claim, we deployed a two-hop scenario comprising three nodes (sender, relay and re-ceiver), and compared the power consumption in two differ-ent configurations (MCSchosen as in [6]): (i) traffic directly sent to the receiver (1-hop, at 6 Mbps), and (ii) relay node used (2-hops, both at 48 Mbps). Traffic is generated at a rate ofλg = 400 fps with different frame sizesL, and packet forwarding in the relay is performed at the routing layer. In both configurations, the relay node is always active.12
Three types of results are shown in Fig. 9a: (i) exper-imental measurements, (ii) theoretical predictions using a traditional model that neglects the impact of crossing the protocol stack (‘old’), and (iii) predictions using the model presented in this paper (‘new’), with a cross-factor of 0.8 mJ at the relay to capture the cost of forwarding a packet at the routing layer.
Not (anymore) surprisingly, results for the two models are
qualitatively different. According to the traditional model, packet relaying always provides a gain, since the energy con-sumption of the 2-hops case is always smaller than that of the 1-hop case. In contrast, according to the actual mea-surements and our model, we only gain from using the relay when packets are sufficiently long (i.e., when the airtime cost becomes dominant over the cross-factor penalty).
Multicasting in WLAN
In order to multicast a packet stream from an AP to N stations in a WLAN, two alternatives are possible: (i) an application layer multicast (ALM) service [20], and (ii) the
11 11.4 11.8 12.2 12.6
250 500 750 1000 1250 1500
Power (Watts)
Packet Size (B) New
1 hop 2 hops Measurement 10.6
10.8 11 11.2 11.4 11.6
Power (Watts)
Old
(a) Power consumption with and with-out relay as a function of the frame size.
3.5 4 4.5 5 5.5 6
1 2 3 4 5 6 7 8 9 10
Power (Watts)
N Application Layer Multicast Direct Multicast Service model
(b) Power consumption as a function of the number of multicast receivers.
11.8 12.2 12.6 13 13.4
1 2 3 4 5 6 7 8 9 10
Power (Watts)
m
New w/ compression
w/o compression Measurement 10.8
10.9 11 11.1 11.2
Power (Watts)
Old
(c) Power consumed as a function of the compression factor.
Figure 9: Revisiting previous schemes under the new model.
Direct Multicast Service (DMS), part of the 802.11aa stan-dard [4].13 In the first case, the application generates each frame for each destination; in the second case, the MAC layer takes care of replicating the frame for each station subscribed to the multicast group.
Both approaches generate the same traffic over the air. Thus, according to the traditional model they should con-sume the same energy, whereas we expect DMS to be sig-nificantlymore energy efficient, since less frames cross the protocol stack.
Indeed, we have experimentally verified this claim by de-ploying both techniques in a WLAN testbed, and by measur-ing the relevant power consumption of the AP. The exper-imental settings are: MCS= 48 Mbps,L= 1000 B,λg = 200 fps and a varying number of stationsN. Fig. 9b shows that measurements well match the model predictions.14 More interestingly, results show that DMS can save up to 25% (1.5 W) of the total power consumption (i.e., as much as 60% of the consumption over the baseline energy costρid) with re-spect to ALM forN= 10.
Data compression in multi-hop networks
In wireless multi-hop networks, data compression at inter-mediary nodes has been proposed to reduce the information relayed to the next hop [5, 35]. According to traditional en-ergy models, this operationsurelysaves energy, whereas our new energy consumption insights suggest that this may not be always true.
To analyze this, we used a three-node testbed consisting of a source, a sink and a relay, all usingMCS= 48 Mbps. The source node generates 500-byte packets at 1200 fps and sends them to the relay. The relay runs an application that receives these packets, and emulates compression by for-warding 1 frame for every m frames received. Thus, our experiments do not capture the processing toll of the com-pression, and hence results reflect the best possible case for the performance of this compression scheme.
Fig. 9c shows total power consumption results (experi-mental ones, as well as predictions from old and new energy model), for different values of the compression ratiom, when
13Both alternatives apply to traffic generated by a station as well as by a sender in the Internet; in the latter case, the traffic reaches the AP, which uses these techniques to multicast the traffic in the WLAN.
14The model accounts for a cross-factor of 0.75 mJ to reach the MAC and of 0.18 mJ from the MAC to the wireless card.
data is compressed (and forwarded) at the application layer. These results are compared against the case where data is not compressed at the relay node but simply forwarded to-wards the sink at the routing layer.
As anticipated, the old model (top curve) predicts that compression is always advantageous. However, experimen-tal results, matched by the new model predictions (bottom curve) show that data compression does not provide any gain in terms of energy consumption, not even for compres-sion rates as high as 10. The reason is that the energy gain resulting from the data compression is outweighted by the extra cost of handling the packets at the application layer (cross-factor of 0.93 mJ for sending and 0.93 mJ for receiving) instead of the routing layer (cross-factor of 0.8 mJ for forwarding). This example thus shows that mechanisms devised on the basis of traditional energy models may not only fail to provide the expected energy gains but may even
worsen the actual energy consumption.
6.2
Novel ways to tackle energy efficiency
Packet Batching
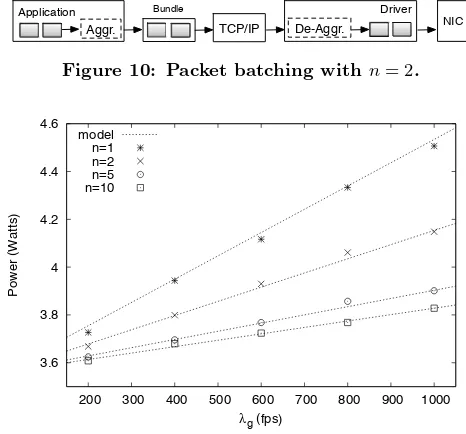
As emerged in our work, energy consumption across the pro-tocol stack relates to the handling of frame units, and is practically independent of the frame size. This suggests a straightforward energy saving strategy: batch packets into bundles at the highest suitable layer for a considered sce-nario, deliver the bundle across the stack, thus paying the energy price associated to a single unit, and then restore the original frames as late as possible down the stack. Un-like previous aggregation schemes for wireless networks, this mechanism (i) does not change the packets that are actually sent, but only modifies the way they are handledwithinthe device [21], and (ii) does not save energy by reducing the cumulativetail energy consumed as a result of lingering in high power states after completing a transmission [8, 29].
We quantified the attainable energy savings by imple-menting the scheme depicted in Fig. 10, which consists of (i) an “aggregator” at the application layer, which waits for
n packets to generate a bundle and pass it to the TCP/IP stack, and (ii) a “de-aggregator” at the wireless driver, which splits the bundle back into the original frames. Experi-mental measurements are reported in Fig. 11 for 100 bytes packets, bundled up to an “aggregation factor”n = 10, and for various (application layer) frame generation rates
λg. Frames are transmitted over the wireless channel at
Application
Aggr. TCP/IP
Bundle
De-Aggr. Driver
NIC
Figure 10: Packet batching withn= 2.
3.6 3.8 4 4.2 4.4 4.6
200 300 400 500 600 700 800 900 1000
Power (Watts)
g (fps) model
n=1 n=2 n=5 n=10
Figure 11: Energy consumption as a function of the ‘aggregation factor’.
Results shown in Fig. 11 have a twofold implication. First, they provide further evidence that the cross-factor toll is practically independent of the frame size: the model matches well the measurements, and the use of ann-bundle reduces the energy toll above the driver byn. Second, energy savings are notable: with 1000 fps, an aggregation factor of 10 yields a saving of almost 0.8 W, and even the aggregation of just two packets may yield considerable savings (e.g., from 4.5 W to 4.15 W).
Obviously, casting the above described scheme into tar-get applications (or even more general frameworks) is not straightforward,15and is out of the scope of this paper. Nev-ertheless, the above results suggest that such effort may be rewarded with notable energy saving.
Raw sockets
Since energy is consumed while crossing each layer of the protocol stack, another way to reduce energy consumption is toskip layers when they are not strictly necessary (e.g., in direct host-to-host wireless communication). To quantify the relevant gains, we have implemented an application that usesraw sockets, thus skipping the TCP/IP OS stack. Ta-ble 7 compares the power consumed using raw sockets (‘raw’) versus that consumed by using standard sockets (‘UDP’), and reports the difference (‘Δ’), for different configurations ofL,MCS andλg.
Results show that the cross-factor can be reduced by ap-prox. 0.2 mJ when skipping the TCP/IP layer, in line with the results of Fig. 4. This suggests to application develop-ers with severe energy concerns that an extra development effort to avoid an unnecessary protocol stack is worth.
15Further technical problems must be dealt with, including the interaction with the TCP/IP protocol stack (e.g., if the target application requires data to be delivered as indepen-dent TCP/IP packets) and the application’s requirements (e.g., the target application scenario must tolerate the extra batching delay introduced).
Table 7: Impact of using raw sockets.
Power (W)
MCS L (B) fps raw UDP Δ Δ/fps
6 Mbps 1000 0.5k 4.26 4.35 0.09 0.19 mJ
12 Mbps 500 1k 4.50 4.69 0.19 0.19 mJ
24 Mbps 100 2k 5.05 5.48 0.43 0.21 mJ
48 Mbps 100 2k 5.03 5.44 0.41 0.20 mJ
7.
CONCLUSIONS
In this paper, we have conducted a thorough measurement analysis of the power consumption of 802.11 devices that, in contrast to previous works, provides a detailed anatomy of the per-packet consumption and characterizes the total consumption of the device, and not only of its wireless in-terface. Our analysis is, to the best of our knowledge, the first one to reveal that a substantial fraction of energy is consumed when packets cross the protocols stack (the cross-factor). While other platforms than the ones analyzed (like e.g. mobile devices) may present quantitatively different re-sults, our analysis shows that the cross-factor is likely to be substantial and cannot be neglected. Based on our find-ings, we have proposed a convenient energy consumption model that accurately predicts the power consumption of WLAN devices. We have shown that some schemes tar-geting energy efficiency may not provide the expected gains, and even worsen performance, when the cross-factor is taken into account. We have further shown some illustrative ex-amples where the understanding gained with our analysis can be used to devise novel algorithms that save energy by reducing the cross factor, either by bundling packets, skip-ping parts of the protocol stack, or operating at the MAC layer. The lessons learned from these experiments provide some guidelines for applications developers pursuing energy-efficient operation in WLANs.
8.
ACKNOWLEDGMENTS
This work has been supported by the European Commu-nity’s Seventh Framework Programme under grant agree-ment no. 257263 (FLAVIA project) and by the Spanish Min-istry of Economy and Competitiveness under grant agree-ment TEC2010-10440-E (DISTORSION project). We would like to thank F. Giust, M. Gramaglia and P. Salvador for their help in running remote experiments. We would also like to thank the shepherd and anonymous reviewers for their valuable feedback.
9.
REFERENCES
[1] Power Consumption and Energy Efficiency Comparisons of WLAN Products. White paper, Atheros Comm., Apr. 2004.
[2] IEEE 802.11: Wireless LAN Medium Access Control (MAC) and Physical Layer (PHY) Specifications, 2007.
[3] Data Transfer over Wireless LAN Power Consumption Analysis. White paper, Intel Corp., Feb. 2009.
[4] IEEE 802.11: Amendment 2. MAC Enhancements for Robust Audio Video Streaming, 2012.
[5] S. J. Baek, G. de Veciana, and X. Su. Minimizing energy consumption in large-scale sensor networks through distributed data compression and hierarchical aggregation. IEEE J. Selected Areas Comm.,
[6] P. Bahl et al. Opportunistic use of client repeaters to improve performance of WLANs.IEEE/ACM Trans. on Networking, 17(4):1160–1171, Aug. 2009.
[7] V. Baiamonte and C.-F. Chiasserini. Saving energy during channel contention in 802.11 WLANs.Mobile Networks and Appl., 11(2):287–296, Apr. 2006. [8] N. Balasubramanian, A. Balasubramanian, and
A. Venkataramani. Energy consumption in mobile phones: A measurement study and implications for network applications. InProc. of ACM Internet Measurement Conference, Nov. 2009.
[9] R. Bruno, M. Conti, and E. Gregori. Optimization of efficiency and energy consumption in p-persistent CSMA-based wireless LANs.IEEE Trans. on Mobile Computing, 1(1):10–31, Mar. 2002.
[10] A. Carroll and G. Heiser. An analysis of power consumption in a smartphone. InProc. of USENIX ATC, June 2010.
[11] M. Carvalho, C. Margi, K. Obraczka, and
J. Garcia-Luna-Aceves. Modeling energy consumption in single-hop IEEE 802.11 ad hoc networks. InProc. of ICCCN, Oct. 2004.
[12] J.-C. Chen and K.-W. Cheng. EDCA/CA:
Enhancement of IEEE 802.11e EDCA by contention adaption for energy efficiency.IEEE Trans. on Wireless Comm., 7(8):2866–2870, Aug. 2008.
[13] S. Chiaravalloti, F. Idzikowski, and L. Budzisz. Power consumption of WLAN network elements. Technical report, Tech. Univ. Berlin, Aug. 2011.
[14] J.-P. Ebert, B. Burns, and A. Wolisz. A trace-based approach for determining the energy consumption of a WLAN network interface. InProc. of European Wireless, Feb. 2002.
[15] M. Ergen and P. Varaiya. Decomposition of energy consumption in IEEE 802.11. InProc. of IEEE ICC, June 2007.
[16] L. Feeney and M. Nilsson. Investigating the energy consumption of a wireless network interface in an ad hoc networking environment. InProc. of IEEE INFOCOM, Apr. 2001.
[17] A. Garcia-Saavedra, P. Serrano, A. Banchs, and M. Hollick. Energy-efficient fair channel access for IEEE 802.11 WLANs. InProc. of IEEE WoWMoM, June 2011.
[18] D. Halperin, B. Greenstein, A. Sheth, and D. Wetherall. Demystifying 802.11n power consumption. InProc. of HotPower, Oct. 2010. [19] X. He and F. Li. Throughput and energy efficiency
comparison of one-hop, two-hop, virtual relay and cooperative retransmission schemes. InProc. of European Wireless, Apr. 2010.
[20] M. Hosseini, D. Ahmed, S. Shirmohammadi, and N. Georganas. A survey of application-layer multicast protocols.IEEE Comm. Surveys and Tutorials, 9(3):58 –74, Sept. 2007.
[21] A. Jain and M. Gruteser. Benefits of packet aggregation in ad-hoc wireless network. Technical report, Univ. of Colorado at Boulder, Aug. 2003. [22] A. P. Jardosh et al. Green WLANs: On-Demand
WLAN Infrastructures.Mobile Networks and Appl., 14(6):798–814, Dec. 2009.
[23] E.-S. Jung and N. H. Vaidya. An Energy Efficient MAC Protocol for Wireless LANs. InProc. of IEEE INFOCOM, June 2002.
[24] G. Y. Li et al. Energy-efficient wireless
communications: tutorial, survey, and open issues.
IEEE Wireless Comm., 18(6):28–35, Dec. 2011. [25] E. Lochin, A. Fladenmuller, J. yves Moulin, S. Fdida,
and A. Manet. Energy consumption models for ad-hoc mobile terminals. InProc. of Med-Hoc Net, June 2003. [26] J. S. Milton and J. C. Arnold.Introduction to
probability and statistics, 4th ed.McGraw-Hill Higher Education, 2003.
[27] A. W. Min, R. Wang, J. Tsai, M. A. Ergin, and T.-Y. C. Tai. Improving energy efficiency for mobile platforms by exploiting low-power sleep states. In
Proc. of Computing Frontiers, May 2012.
[28] A. Pathak, Y. C. Hu, and M. Zhang. Bootstrapping energy debugging on smartphones: a first look at energy bugs in mobile devices. InProc. of ACM HotNets, Nov. 2011.
[29] F. Qian et al. Characterizing radio resource allocation for 3G networks. InProc. of ACM Internet
Measurement Conference, Nov. 2010.
[30] D. Qiao, S. Choi, A. Jain, and K. G. Shin. MiSer: an optimal low-energy transmission strategy for IEEE 802.11a/h. InProc. of ACM Mobicom, Sept. 2003. [31] D. Qiao, S. Choi, and K. Shin. Interference analysis
and transmit power control in IEEE 802.11a/h wireless LANs.IEEE/ACM Trans. on Networking, 15(5):1007–1020, Oct. 2007.
[32] E. Rantala, A. Karppanen, S. Granlund, and P. Sarolahti. Modeling energy efficiency in wireless internet communication. InProc. of ACM MobiHeld, Aug. 2009.
[33] A. Rice and S. Hay. Measuring mobile phone energy consumption for 802.11 wireless networking. Pervasive and Mobile Computing, 6(6):593–606, Dec. 2010. [34] E. Rozner, V. Navda, R. Ramjee, and S. Rayanchu.
NAPman: network-assisted power management for WiFi devices. InProc. of ACM MobiSys, June 2010. [35] A. B. Sharma, L. Golubchik, R. Govindan, and M. J.
Neely. Dynamic data compression in multi-hop wireless networks. InProc. of ACM SIGMETRICS, June 2009.
[36] C. Sun and C. Yang. Is two-way relay more energy efficient? InProc. of IEEE GLOBECOM, Dec. 2011. [37] J.-M. Tarascon. Key challenges in future Li-battery
research.Phil. Trans. of Royal Society A, 368(1923):3227–3241, July 2010.
[38] J. R. Taylor.An introduction to error analysis. Oxford University Press, 1982.
[39] S.-L. Tsao and C.-H. Huang. A survey of energy efficient MAC protocols for IEEE 802.11 WLAN.
Computer Comm., 34(1):54–67, Jan. 2011. [40] X. Wang, J. Yin, and D. P. Agrawal. Analysis and
optimization of the energy efficiency in the 802.11 DCF.Mobile Networks and Appl., 11(2):279–286, Apr. 2006.
[41] H. Wu, S. Nabar, and R. Poovendran. An energy framework for the network simulator 3 (NS-3). In