http://www.sciencepublishinggroup.com/j/ijics doi: 10.11648/j.ijics.20170206.13
ISSN: 2575-1700 (Print); ISSN: 2575-1719 (Online)
Transmission Characteristics of High Frequency Signal in
Low Voltage Power Lines
Xiao Chen
1, Jie Fan
1, Kaining Luan
1, Yongxian Yi
2, Faye Zhang
3, *1
Jiangsu Electric Power Company, Nanjing, China 2
Jiangsu Electric Power Company Research Institue, Nanjing, China 3
School of Control Science and Engineering, Shandong University, Jinan, China
Email address:
437243106@qq.com (Faye Zhang) *
Corresponding author
To cite this article:
Xiao Chen, Jie Fan, Kaining Luan, Yongxian Yi, Faye Zhang. Transmission Characteristics of High Frequency Signal in Low Voltage Power Lines. International Journal of Information and Communication Sciences. Vol. 2, No. 6, 2017, pp. 104-109. doi: 10.11648/j.ijics.20170206.13
Received: October 18, 2017; Accepted: November 9, 2017; Published: December 5, 2017
Abstract:
Power line carrier communication using 1MHz ~ 30MHz as carrier signal can improve the bandwidth of data transmission. Using the high frequency signal as a carrier signal, with the increase of signal frequency, the attenuation range of low voltage power line channel is also increased. On the basis of the structure of low voltage power grid, the transmission attenuation model of high frequency signal in low voltage power line channel is established by using transmission line theory. The attenuation in different locations and loads is measured by experiments. Analytical results show that the attenuation of the signal increases with frequency in the 1~30MHz band. The attenuation of the signal is time varying to a certain extent. The attenuation of the signal is also impacted by the load. As the load increases, the attenuation of the signal increases.Keywords:
Transmission Characteristics, Power Line Communication, Low Voltage Distribution Network1. Introduction
An electric meter is a device that measures the amount of electric energy consumed by a resident, a business, or an electrically powered device. Traditionally, it is read by people once-a-month to visit your home for billing purposes. Automatic meter reading (AMR) is the technology of automatically collecting consumption, diagnostic, and status data from energy metering devices and transferring that data to a central database for billing, troubleshooting, and analyzing [1]. AMR mainly saves electric utility providers the expense of periodic trips to each physical location to read a meter [2]. And the billing can be based on near real-time consumption. With the development of Smart Grid, advanced metering infrastructure (AMI) extends automatic meter reading (AMR) technology [3] [4]. AMI is providing two way communications, allowing commands to be sent toward the home electric meter for multiple purposes, including time-based pricing information, demand-response actions, or remote service disconnects.
With the development of AMR and AMI technology,
hand, the frequency selective attenuation of the power lines as the frequency increases and seriously affect the communication distance [11]; on the other hand, considering the signal transmission of smart meter power and low voltage power device of the general requirements, the high frequency signal in the transmission of power, power constraints, the attenuation effect, the communication distance is limited, and the electromagnetic interference increased [12]. So PLC technology applied to the existing smart meters is in a narrow band. In order to achieve reliable power line data transmission, it is necessary to study the special channel of power lines. The attenuation characteristics of indoor power supply sockets are measured by [13]. It is considered that the signal attenuation is low in the 100kHz~400kHz frequency band and increases with the increase of frequency. Reference [14] considers that branch network is the main cause of signal attenuation.
To realize high speed data transmission for the smart meter in the smart grid, the broadband power line carrier with a high frequency signal is needed to study. And now, the research and application of power line transmission signals in 1MHz~30MHz mainly focus on indoor [15] [16]. For high speed transmission of smart meter data, it is necessary to study the characteristics of outdoor power lines channel according to the characteristics of low voltage distribution network in China.
2. Structure of Low Voltage Distribution
Network
Low voltage distribution network is started from transformers (10kV/380V). It serves as the final transition to the customer. Close to each end user, a distribution transformer takes the primary-distribution voltage (commonly 10kV) and steps it down to a low voltage secondary circuit (commonly 220/380V) as shown in Figure 1. From the distribution transformer, the secondary distribution circuits connect to the end user where the connection is made at the service entrance. The distribution infrastructure is extensive. It is delivered electricity to customers in cities, in the suburbs, and in very remote regions. Distribution circuits are often found along roads and streets. Urban construction is mostly underground; rural construction is mainly overhead. Suburban structures are a mix, with a good deal of new construction going underground. In most cases, only one distribution transformer supplies power to customers, and the customers’ load is at the end of the distribution network. A mainly urban utility may have less than 150 meters of distribution circuits for each customer. A rural utility can have over 300 meter of primary circuit per customer.
Low voltage distribution circuit can be divided into two sections as Figure 1. One section is lateral line, from the distribution transformer to public buildings. Overhead line three-phase four wire or four wire cable line is generally used. The other section is customer line from the lateral line to the
customer’s meter. And single-phase two-wire cable line is generally used.
Figure 1. Low voltage distribution network.
Figure 2. Two port distributed transmission line mode.
3. Transmission Line Model of Power
Line
3.1. Transmission Line Theory
Using broadband power line carrier communication, the high frequency signal of 1MHz~30MHz is transmitted on the power line, the wavelength of the signal is relatively short, from 10m to 300m. The ratio of the wavelength of the signal to the length of the power line is small, so the distributed parameters should be used for the analysis of the power line transmission signal. The two port transmission line model with uniform parameters is shown in Figure 2. In Figure 2, R is the series resistance per unit length, L is series inductance, C is shunt capacitor, and G is parallel conductance.
transmission line is called a uniform transmission line model. According to the theory of the two port network, the relation between the input voltage and the current and the output voltage and current is:
cosh Z sinh sinh cosh Z c c d d U U d d I I γ γ γ γ = 1 2 1 2 ɺ ɺ
ɺ ɺ (1)
The impedance of the power line will also cause attenuation to the carrier communication signal. Because the transmission line is perceptual, the attenuation degree increases with the transmission signal frequency and the transmission distance. An impedance matching transmission line with a unit length of d. The transfer function is:
( ) U
H e
U − = 2= γd
1
f ɺ
ɺ (2)
where γ α= + jβ is propagation constant, α is attenuation factor, β is phase factor. According to the theory of transmission line:
( )( )
j R j L G j C
γ α= + β = 0+ ω 0 0+ ω 0 (3)
3.2. Transmission Line Parameters of Low Voltage Power Lines
Overhead lines and underground cable are commonly used low voltage power lines are mainly overhead lines and cable lines. The power supply radius of low voltage line is generally 100m~150m, and the maximum is not more than 250m. Overhead lines usually adopt the mode of four-wire arranged in parallel, and the theory of parallel twin wires can be used to solve the parameters. The four-wire of the cable line are closely arranged, so the skin effect should be taken into account.
3.2.1. Parameters of Overhead Lines
The low voltage power line carrier single generally uses phase to ground coupling, and the communication channel is single-phase power line. According to the distribution of the actual application of line, considering the transverse arrangement of single phase, so the geometric single-phase transmission line and the zero line between the mean distance cannot be precisely calculated, the parameters in the calculation can be used to estimate the wire geometric mean distance uniform set to 0.8m. Overhead lines are usually made of aluminum core XLPE insulated wire. The selection of wire number should consider the development needs and facilities of standardization. The lateral line area usually is 50mm2, 70mm2, 120mm2, 150mm2 or 240mm2. The customer line adopts copper core XLPE insulated wire or cable, and the conductor cross section area is no less than 10 mm2.
According to the theory of electromagnetic field, the inductance of wire is calculated for two wire transmission:
R S
ρ =
0 (4)
(ln . )
( ln . ) (H/m)
eq r eq D L r D r µ µ π − = + = + × 0 0 7 0 5 2
2 0 5 10
(5)
( ) (F/m)
ln eq . ln eq C
D D
r r
πε −
= = × 10
0 2 1 10
18 (6)
For low voltage power lines, corona losses are negligible, G0=0.
For common aluminum core XLPE insulated lines, the parameters of the overhead lines are calculated as shown in the following table (Table 1):
Table 1. Characteristics of overhead line.
Conductor R0 (Ω/km) L0 (μH/m) C0 (pF/m)
JKLYJ-50 0.671 1.111 10.47
JKLYJ-70 0.466 1.075 10.84
JKLYJ-120 0.275 1.022 11.44
JKLYJ-150 0.225 1.002 11.68
JKLYJ-240 0.140 0.9538 12.29
3.2.2. Parameters of Underground Cables
Commonly used in cable line is XLPE cable YJV, the line area usually is 50mm2, 70mm2, 120mm2, 150mm2 or 240mm2. The calculated parameters of the cable line are shown in Table 2.
Table 2. Characteristics of underground cable.
Conductor R0 (Ω/km) L0 (µH/m) C0 (pF/m)
YJV-50 0.435 0.2337 60.47
YJV-70 0.310 0.2002 74.03
YJV-120 0.181 0.2273 62.67
YJV-150 0.145 0.2050 71.70
YJV-240 0.091 0.2155 67.13
4. Measurement of Transmission
Characteristics for Low Voltage Power
Lines
4.1. Principle of Measurement
The low voltage distribution network for the user directly, its load impedance vary, each node does not match the reflection, refraction and the resonant signal generation, resulting in low voltage power line high frequency signal attenuation is very complex, seriously affects the quality of carrier communication. The high frequency signal generator is a sine wave voltage signal 1MHz~30MHz, interval 200kHz, measured at the transmitter and receiver respectively with digital oscilloscope and spectrum analyzer function to realize transmission characteristics, measurement principle as shown in Figure 3.
The devices used in the test are list as bellow:
1) signal generator: YB1052B, can produce 0.1MHz~150MHz sine voltage signal.
2) oscilloscope: MDO4104B. 3) spectrum analyzer: GSP827. 4) coupling: capacitance coupling.
The attenuation characteristics are measured according to the voltage comparison method:
( )=20 lg(Ur) A ttenuation dB
Us
× (7)
4.2. Field Measurements
The selected site for testing is a university laboratory and a residential area. The loads on the power line are various and complex, and the random switching will cause the attenuation of the power line. The longer the transmission path, the greater the attenuation, the frequency increases, the attenuation will also increase. Figure 4 is a laboratory at the peak and trough the contrast attenuation curve, it is found that the peak period, although the load type less, but the load heavy, so the attenuation of the signal is large. Figure 5 shows the attenuation curve of the peak and trough of the residential area. There are many kinds of load in the residential area, and it varies greatly. So, signal attenuation fluctuations will also be relatively large.
Figure 4. Attenuation curve of laboratory.
Figure 5. Attenuation curve of residence community.
From the attenuation measurements, it is found that the attenuation value increases with the distance and frequency, and a significant increase in some frequency attenuation. The more complex the distribution network is, the greater the overall attenuation of the signal is, and the attenuation of the branch line is more complicated.
As can be seen from Figure 4 and Figure 5, with the frequency of the signal to rise to more than 20MHz, the attenuation above 60dB signal, is not conducive to signal transmission, have put forward higher requirements for sending and receiving equipment.
4.3. Laboratory Simulation Measurements
In order to verify the transmission characteristics of the power line deeper, in the laboratory simulation of two commonly used power wire overhead lines and cable lines were measured and simulated load with different resistance in the laboratory.
4.3.1. Experiment 1
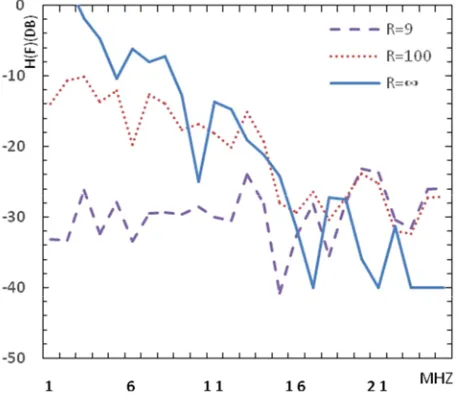
In Experiment 1, the parallel line of 100m is used, and the interval between two lines is 500mm. The simulated overhead lines are used respectively during the experiment:
1) open circuit, R=∞, which means that the load is light; 2) R=100 Ω, indicating normal load;
3) R=10 Ω, which means heavy load.
As can be seen from Figure 6, with the different load, the signal attenuation is different. In generally, the heavier the load, the greater the attenuation of the signal. With the increase of signal frequency, the attenuation is gradually increased. As the signal frequency rises above 20MHz, the attenuation of the signal is above 60dB. This frequency signal is not conducive to transmission, and the transmission and receiving equipment have put forward higher requirements.
Figure 7. Attenuation curve of cable lines.
4.3.2. Experiment 2
Experiment 2 uses 100m three wire line to simulate cable lines. In the course of experiment:
1) open circuit, R=∞, which means that the load is light; 2) R=100 Ω, indicating normal load;
3) R=10 Ω, which means heavy load.
The experimental results are shown in Figure 7.
The simulation test of the cable line also shows different load conditions, and the attenuation degree of the signal is different. As the load increases, the attenuation of the signal is greater. With the increase of signal frequency, the attenuation of signal increases gradually.
4.3.3. Test Result Analysis
In Generally, the loss of heat and radiation caused by the transmission of signals on the line is called intrinsic attenuation. This type attenuation always exists, and is positively related to the frequency of signal and the length of signal transmission path. Similarly, this attenuation is also present on the power line channel.
Laboratory measurements and field measurements show that the attenuation in the laboratory is significantly smaller than the actual measurement results. This is due to the simplicity of the lab line and the lack of access to branch lines. In actual low voltage distribution network, there are different user loads and branch circuit access. The low voltage distribution network is open to all low voltage users and the load connected have different characteristics. This makes the impedance of low voltage power lines changeable and unpredictable. In low distribution networks, communication channels present a tree structure in physics, and transmit signals and receive signals are located at the ends of different branches. When the signal propagates, the impedance discontinuity will occur at the discontinuous point of the line impedance, resulting in reflection, standing wave, resonance and so on, forming multipath effects and causing selective fading at some frequency points.
5. Conclusion
When a high frequency signal is transmitted by a low voltage power line, the wavelength of the signal is short (1M~30MHz), and the power line is considered as a long line (10m~300m). So, the power line is long line, and the model should be distributed model for analyzing and calculating. The transmission characteristics of signals can be analyzed by using transmission line theory.
Through field measurements and laboratory tests, it is found that the signal attenuation characteristics of the low voltage power line channel are very complex. It is affected by the length of the line, the load, the branch line and so on. When the signal frequency is greater than 20MHz, the attenuation of the signal is relatively large, and the reception of the signal is not utilized.
References
[1] Enrico VALLGI, Eugenion DI MARINO. Networks Optimization with Advanced Meter Infrastructure and Smart Meters. 20th International Conference on Electricity Distribution, 2009: 8-11.
[2] Luan. Shang Web, Teng. Jen Hao, Chan. Shun Yu. Development of a Smart Power Meter for AMI based on Zig Bee communication. International Conference on Power Electronics and drive systems, 2009: 661-665.
[3] Sioe T. Mark. A Synergistic Approach to Implement Demand Response, Asset Management and Service Reliability Using Smart Metering, AMI and MDM systems. The 2009 IEEE PES General Meeting Advance Program of Technical Sessions and Committee Meetings, 2009: 1-4.
[4] Kabalci Y. A survey on smart metering and smart grid communication. Renewable and Sustainable Energy Reviews, 2016, 57: 302-318.
[5] YU Bin, JIA Yaqiong. Meter Collective Reading System of Rural Power Grid Based on PLCC. Low Voltage Apparatus, 2013 (18): 43-46. (in Chinese).
[6] TAO Wei-qing, CHEN Xiong. Realization of Low Voltage Carrier Automatic Meter Reading System Based on Intelligent Relay Technology. Electrical Measurement & Instrumentation, 2009, 46 (5). (in Chinese).
[7] M/441 EN. Standardization mandate to CEN, CENELEC and ETSI in the field of measuring instruments for the development of an open architecture for utility meters involving communication protocols enabling interoperability. European Commission - Enterprise and Industry Directorate-General, 2009: 1311-1320.
[8] Sendin A, Peña I, Angueira P. Strategies for power line communications smart metering network deployment. Energies, 2014, 7 (4): 2377-2420.
[10] Han B, Stoica V, Kaiser C, et al. Noise characterization and emulation for low-voltage power line channels across narrowband and broadband. Digital Signal Processing, 2017, 69: 259-274.
[11] S. Galli, A. Scaglione, and Z. Wang. Power line communications and the smart grid. in First IEEE International Conference on Smart Grid Communications, 2010: 78-84.
[12] Zheng J, Gao D W, Lin L. Smart meters in smart grid: An overview Green Technologies Conference, 2013 IEEE. IEEE, 2013: 57-64.
[13] Zhang Youbing, Cheng Shijie, J. Nguimbis. modeling of the low voltage power line used as high frequency carrier communication channel based on experimental results. Automation of Electric Power Systems, 2002, 26 (23): 62-66.
[14] Zhang Youbing, Cheng Shijie, Xiong Lan. Analysis and simulation of the ofdm based communication over low voltage power line. Automation of Electric Power Systems, 2003, 27 (11): 16-20, 33.
[15] Alavi S E, Amiri I S, Supa'at A S M, et al. Indoor data transmission over ubiquitous infrastructure of powerline cables and LED lighting. Journal of Computational and Theoretical Nanoscience, 2015, 12 (4): 599-604.