RESEARCH ARTICLE
ABUNDANCE OR DOMINANCE: WHICH IS MORE JUSTIFIED TO CALCULATE IMPORTANCE
VALUE INDEX (IVI) OF PLANT SPECIES?
*Bhadra A.K. and S.K. Pattanayak
Department of Environmental Sciences, Sambalpur University, Jyotivihar-768019, Odisha, India
ARTICLE INFO
ABSTRACT
Abundance and dominance are two aspects of the plant species diversity dynamics, often considered interchangeably together with frequency and density to estimate Importance Value Index (IVI). The importance of the use of abundance or dominance for IVI has been explored through an investigation of abundance-dominance directed species dynamics on Gandhamardan hill of western Odisha in the altitudinal range 340-960m. In total 232 plant species were documented. Large number of species have higher abundance guided IVI (A-IVI) compared to dominance guided IVI (D-IVI). Whole vegetation, Tree-1(>15cm GBH), Tree-2(<15cm GBH), Shrub, LTC (Lianas, Twinner, Climber), Herb/Grass and Seedling community, with 93.53%, 81.40%, 89.66%, 100%, 100%, 100% and 99.01% species showing contiguous distribution, respectively, justify this finding. The values of Shannon-Wiener and Simpson’s diversity indices and Evenness index are higher in case of A-IVI compared to D-IVI. The R2 values for A-IVI based Whittaker plot of top twenty species in Tree-2, Shrub, LTC, Herb/Grass and Seedling communities are higher than that of D-IVI based plot except in Tree-1 and Whole vegetation. In these communities the evenness of top twenty species is more expressed by A-IVI than D-IVI. The mean R2 value for A-IVI and D-IVI based plots are 0.64 and 0.56, respectively, indicating that the species evenness is explainable at 64% level by A-IVI, in contrast to 56% level by D-IVI. There are number of species common to the Abundance and Dominance based groups of top twenty five species in each community and this commonness follows the order ‘LTC>Shrub>Seedling>Tree-2>Tree-1>Herb/Grass>Whole vegetation. For A-IVI and D-IVI based groups of top twenty species, the order is ‘Shrub>LTC=Tree-2>Tree-1=Seedling>Herb/Grass>Whole vegetation’. In the two orders, ‘whole vegetation’ is placed at the end with 8% and 45% common species, suggesting that abundance and dominance have high discriminating ability when the whole vegetation is considered as a unit. In this community, nine species are observed to be common amongst top twenty species for A-IVI and D-IVI groups, out of which five are tree species; top twenty species in A-IVI and D-IVI based groups consists of six and sixteen tree species, respectively. Out of top twenty five plant species in whole plant community based on abundance, 19 are herbs/grasses (76%), while on dominance, 24 are trees (96%). Thus, abundance is a factor in vegetation survey, which reveals, promotes and prioritizes communities other than trees. Dominance is justified for tree community as the individuals of tree species are available in higher girths. Therefore, importance value index of species belonging to tree and other communities should be evaluated based on dominance and abundance separately.
Copyright©2016,Bhadra and Pattanayak. This is an open access article distributed under the Creative Commons Attribution License, which permits unrestricted use, distribution, and reproduction in any medium, provided the original work is properly cited.
INTRODUCTION
The Indian bauxite industry’s first encounter with protest movements occurred in the late 1980s when Bharat Aluminium Company (BALCO) searched for additional ore on Gandhamardan Hill in Western Odisha (Mishra, 1987). This hill is known for its biodiversity as well as important Hindu and tribal pilgrimage location. It remained silent observer to a significant established opposition movement when local and
*Corresponding author: Bhadra A.K.,
Department of Environmental Sciences, Sambalpur University, Jyotivihar-768019, Odisha, India.
national activists could not quite believe that “Gandhamardan will truly come of age with ancient holy temples of Nrusinghanath and Harishankar and modern industrial temples co-existing and enriching each other.” Especially the local mobilisation forced the company to leave and the Hill remains without mining projects to date (Oskarsson, 2013). The relative proximity of the bauxite mining locations in the states of Odisha and Andhra Pradesh, and the dominance of tribal inhabitants have contributed to the formation of the life-giving hills discourse. At the same time the Indian government has closed ranks with forest and environment bureaucrats and experts dropping their earlier resistance to mining with the
ISSN: 0976-3376
Vol. 07, Issue, 09, pp.3577-3601, September,Asian Journal of Science and Technology 2016ASIAN JOURNAL OF
SCIENCE AND TECHNOLOGY
Article History:
Received 19th June, 2016
Received in revised form
22nd July, 2016
Accepted 21st August, 2016
Published online 30th September, 2016
Key words:
development of forest payment and plantation programs to compensate for lost forest lands from mining (Oskarsson, 2015). In addition, the proposed bauxite mining areas have often had great environmental values justifying conservation and effective ground level survey on vegetation, geology,
hydrology and wildlife. Conservation efforts involve study and
analysis of plant species dynamics which is one of the
significant aspects of biodiversity conservation as well as management with monitoring of a landscape on long term basis. The understanding on ever changing species dynamics relative to abundance and dominance across land scapes is the fundamental requirement for species conservation and propagation. This investigation along an altitudinal gradient, across valleys and perennial stream paths enlightens and reflects the vegetation composition on Gandhamardan hills situated over border adjoining two western districts of Odisha such as Balangir and Baragarh. In India, the Gandhamardan hills is an eco-fragile and eco-sensitive zone hosting numbers of perennial streams and huge bauxite reserve. This hill range falls under tropical dry deciduous forest type (Champion and Seth, 1968). Gandhamardan hills carry not only the signature of mythological significance but also plant diversity, animal diversity, geology, minerals, hydrology, microclimate, topography, socioeconomics and livelihood support. BALCO constructed a road during 1980s for the purpose of mining bauxite from the hills. The road is situated on the North-Western part of the hills extending from foot hill at Nrusinghanath temple to plateau top of the lateritised cap. This is the only accessible road to move into the hill ecosystem by vehicles. Hence plant species diversity and dynamics study is important to keep vigil on the impact of anthropogenic as well as tourism impact on the hill ecosystem.
The most common expression of an ecosystem is the number of species and the proportion in which each species is geospatially distributed in the community. This distribution can be viewed from two angles of abundance and dominance together. In short, a community will have a high alpha diversity, when there is a high number of species and their abundances are much similar. The more similarity in abundances of species implies more evenness and uniformity in horizontal spreading over of individuals of the species. The high alpha diversity points towards a sustainable ecosystem with potential to absorb the anthropogenic disturbance and recover from the unpredictable natural events. Therefore, the plant species dynamics study along the altitudinal limit of the hills is the need of the hour because of prevailing anthropogenic demand for extraction of natural resource like food, fuel, housing materials, herbal medicine and other commercial commodity. The credit for the first attempt in botanical exploration of Gandhamardan hills bestows on Mooney (1950). He carried out a single exploration trip to Gandhamardan hills during the month of September, 1949 and documented seventeen new plant records for the state. After this, many workers like Raju (1960), Panigrahi et al. (1964), Misra (1990, 1994, 1996), Saxena and Brahmam (1995), Misra and Das (1998a,b,c), Mishra et al. (2001), Mishra and Das (2003), Reddy and Pattanaik (2009), Bhadra et al. (2009), Bhadra et al. (2009), Sahu et al. (2010), Bhadra and Dhal (2010), Bhadra et al. (2010), Sahu et al.(2010), Bhadra et al. (2014), Bhadra et al. (2016) have carried out extensive vegetation survey on the Gandhamardan hills from time to time. However, the present study is distinguished from the
previous investigations in exploring plant species level dynamics relative to abundance and dominance on the Gandhamardan hill.
MATERIALS AND METHODS
Study area
Gandhamardan Hill ranges lies between 20 42` to 21 00`N
latitudes and 82 41` to 83 05`E longitudes in the North-West
of Bolangir and South-West of Baragarh district, Odisha, India (Fig.1). The hill ranges define an undulating mountain system in the elevation range of 300m to 1220m a.s.l. It extends over several km in north-east and south-west direction and receives annual rainfall ranging from 750 mm to 1600 mm having average rainfall of 1297 mm.
Field sampling
The field survey was conducted during months of January to December, 2014. The minimum size and number of quadrates were determined by species area curve method (Mishra, 1968). A total number of 42 sample quadrates of 20m×20m for tree community having >15cm GBH (Tree-1), 15m×15m for tree community having <15cm GBH (Tree-2), 10m×10m for shrubs, 10m×10m for liana, twinner and climber (LTC), 5m×5m for herbs as well as seedlings were laid down along BALCO road from the foot hill near Nrusinghanath temple to the plateau top. The sampled quadrates were laid in such a manner that the plant species recorded from the quadrate must reflect different vegetation types, landform, elevation, phytosociety, abundance, dominance and density. Information on GPS locations and elevation with error value, slope, aspect, canopy density, presence of wildlives, forest fire and weed invasion were noted down for reference and analysis.
Data analysis
Source: www.googleearth.com, 2014) (D)
Fig.1 Map showing the location of Orissa (A), location of Gandhamardan hill Range in Bolangir and Bargarh district (B,
C) and satellite picture of the hill
Frequency (%) = (Number of quadrates of species occurrence / Total number of quadrates studied) × 100
Density = Total number of individuals of a species present in all quadrates / Total number of quadrates studied
Abundance = Total number of individuals of a species present in all quadrates/ Total number of quadrates of species occurrence
Dominance = Sum of basal area occupied by stems of all individuals of a species in all the studied quadrates where
basal area of a stem is represented by πr2 and r = Radius of the
stem
Relative frequency = (Frequency of a species / Sum of frequency of all species) × 100
Relative density = (Density of a species / Sum of density of all species) × 100
Relative abundance = (Abundance of a species / Sum of abundance of all species) × 100
Relative dominance = (Dominance of a species / Sum of dominance of all species) × 100
Importance Value Index (IVI) = Relative Frequency + Relative Density + Relative Abundance
Also, the index was calculated using dominance in place of abundance i.e.
Importance Value Index (IVI) = Relative Frequency + Relative Density + Relative Dominance
Shannon-Wiener index (H`) = -∑Pi Log Pi, where Pi = ni / N
Simpson`s index = 1- [ ∑ (ni /N) 2 ]
Where, ni = Importance value of a species N = Sum of importance values of all the species Evenness Index = E = H'/ LogN'
Where, N' = Number of plant species
Fig. 2. A model set of quadrate with representative vegetation index area
RESULTS
The matured tree community (Tree-1) has 86 species, 71genera and 35 families. The immature tree community (Tree-2) has 58 species, 51genera and 30 families. The shrub community is having 34 species, 33 genera and 23 families. The LTC (Liana, Twinner and Climber) community is having 26 species, 21 genera and 12 families. The herb/grass community is having 82 species, 69 genera and 25 families. The seedling community is having 101 species, 90 genera and 44 families. Abundance and dominance are two quantitative characteristics from which any one is taken into account while calculating importance value index (IVI) of a plant species. However, here we have calculated IVI of each plant species taking both values to study dynamics with respect to the two parameters. This investigation was done in Tree Species > 15cm GBH (Tree-1), Tree Species < 15cm GBH (Tree-2), Shrub, LTC, Herb/Grass, Seedling and whole plant community separately to study plant species dynamics. In the whole plant
community, abundance guided IVI ranges from
17.43(Thysanolaena maxima) to 0.12(Alangium salvifolium,
Alstonia scholaris, Antidesma acidum, Ardisia solanacea, Breynia retusa, Embelia tsjeriam-cottam, Ficus arnottiana, Ficus benghalensis, Ficus microcarpa, Ficus religiosa, Ficus
virens, Glochidion zeylanicum, Leptadenia reticulata,
Pterospermum acerifolium, Streblus asper and Trema orientalis) and dominance guided IVI ranges from
13.53(Diospyros melanoxylon) to 0.07(Alangium salvifolium,
Breynia retusa, Embelia tsjeriam-cottam and Leptadenia reticulata). Tree-1 community is having highest abundance
guided IVI of 18.51(Cleistanthus collinus) and lowest of 0.86 (Alstonia scholaris, Antidesma acidum, Ardisia solanacea,
Ficus arnottiana, Ficus benghalensis, Ficus microcarpa, Ficus religiosa, Ficus virens, Glochidion zeylanicum, Mangifera indica, Phoenix sylvestris, Pterospermum acerifolium, Streblus asper and Trema orientalis). This community is having highest
Dominance guided IVI of 21.34 (Cleistanthus collinus) and lowest of 0.23 (Antidesma acidum, Ardisia solanacea, Ficus
virens, Glochidion zeylanicum, Phoenix sylvestris,
Pterospermum acerifolium). Tree-2 community is having
highest abundance guided IVI of 30.00 (Anogeissus latifolia) and lowest of 1.54 (Antidesma acuminatum, Bauhinia
malabarica, Bombax ceiba, Canthium dicoccum,
Cochlospermum religiosum, Euphorbia nivulia, Garuga pinnata, Kydia calycina, Protium serratum, Strychnos nux-vomica and Wrightia arborea). This community is having
highest Dominance guided IVI of 43.73(Anogeissus latifolia) and lowest of 0.50(Protium serratum). The shrub community is having highest Abundance guided IVI of 72.09 (Thysanolaena maxima) and lowest of 0.75(Breynia retusa and
Ziziphus oenoplia) while it is having highest Dominance
guided IVI of 130.69(Dendrocalamus strictus) and lowest of
0.55 (Breynia retusa and Ziziphus oenoplia). Lianas, Twinner and Climber (LTC) community is having highest abundance guided IVI of 36.32(Hemidesmus indicus) and lowest of 3.87(Lygodium flexuosum). LTC community is having highest dominance guided IVI of 101.63(Bauhinia vahlii) and lowest of 1.72(Ampelocissus latifolia). The Herb/Grass community is having highest abundance guided IVI of 19.76(Hemigraphis
latebrosa) and lowest of 0.61(Colocasia esculenta) while the
highest and lowest dominance guided IVI are
31.35(Hemigraphis latebrosa) and 0.47(Evolvulus alsinoides). Lastly, the seedling community is having highest and lowest values for Abundance directed IVI are 27.12(Acacia torta) and 0.36(Atylosia scarabaeides, Chlorophytum arundinaceum,
Embelia tsjeriam-cottam, Eriolaena hookeriana, Gardenia gummifera, Leptadenia reticulata and Syzigium cumini) while
those for dominance directed IVI are 41.55 (Diospyros
melanoxylon) and 0.25(Atylosia scarabaeoides) respectively.
There are some cases of species where the A-IVI and D-IVI are equal in values. In the whole plant community, Erythrina
variegata, Murraya paniculata and Pongamia pinnata are
having 0.18, 0.19 and 0.19 as both A-IVI and D-IVI values respectively. None of the species in Tree-1, Tree-2, Shrub, LTC and Herb/Grass community shows equal A-IVI and D-IVI values. Only three species of the seedling community i.e.
Embelia tsjeriam-cottam, Meyna spinosa and Phoenix sylvestris show equal A-IVI and D-IVI values of 0.36, 1.76
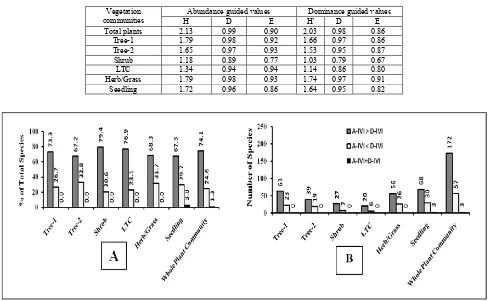
and 0.51 respectively. On the other hand, 63, 39, 27, 20, 56, 68 and 172 species show higher A-IVI than D-IVI and 23,19, 7, 6, 26, 30 and 57 species show lower A-IVI than D-IVI in the Tree-1, Tree-2, Shrub, LTC, Herb/Grass and seedling community respectively(Fig.4). Maximum 79.4% species of shrub community and minimum 67.2% species of Tree-2 community show higher A-IVI than D-IVI while maximum 32.8% species of Tree-2 and minimum 20.6% species of shrub community show lower A-IVI than D-IVI values. Only 3% species of seedling and 1.3% species of whole plant community show equal A-IVI and D-IVI.
Distribution pattern of all species across all communities was found out based on the ratio of abundance to frequency value of each individual species. To discover that not a single plant species in all the communities shows regular distribution pattern. 15, 16, 6 and 1 number of species show random distribution pattern in the whole plant, Tree-1, Tree-2 and seedling community respectively. 217, 70, 52, 34, 26, 82 and 100 numbers of species show contiguous distribution pattern in the whole plant, Tree-1, Tree-2, Shrub, LTC, Herb/Grass and Seedling community respectively. Also, no species in shrub, LTC and Herb/Grass community shows random distribution pattern (Table-9). The Shannon-Wiener index of diversity (H'), Simpson’s index of diversity (D) and Evenness index (E) were derived based on the importance value index calculated taking both abundance and dominance values. It was observed that in all the cases, the indices guided by A-IVI are higher than those guided by D-IVI (Table-10). Shannon-Wiener index of diversity guided by A-IVI is highest in Total plant community i.e. 2.13 followed by Tree-1, Herb/Grass, Seedling, Tree-2, LTC and shrub in decreasing order where Tree-1 and Herb/Grass community are having equal H' values. This trend of Shannon-Wiener index deviates in case guided by D-IVI having Herb/Grass index higher than Tree-1. The trend is highest in Total plant community i.e. 2.03 followed by Herb/Grass, Tree-1, Seedling, Tree-2, LTC and Shrub in
decreasing order. The trend of Simpson’s index guided by A-IVI and D-A-IVI are ‘Total plant community > Tree-1=Herb/Grass > Tree-2 > Seedling > LTC > Shrub’ and ‘Total plant community > Tree-1=Herb/Grass > Tree-2 = Seedling > LTC > Shrub’ respectively. The trend of evenness index guided by A-IVI and D-IVI are ‘LTC > Tree-2 = Herb/Grass > Tree-2 > Total plant community > Seedling > Shrub’ and ‘Herb/Grass > Tree-2 > Total plant community = Tree-1 > Seedling > LTC > Shrub’ respectively.
Dominance-Diversity curve was made taking species on X-axis and IVI value on Y-X-axis for each of vegetation communities (Fig.5). The top twenty plant species with A-IVI and D-IVI in each community have been depicted in the curve to find the species dynamics with respect to abundance and
dominance. The coefficient of determination (R2) of each
curve was found out. It was seen that R2 value for D-D curve
guided by A-IVI in Tree-2, Shrub, LTC, Herb/Grass and
Seedling communities are higher than R2 value for D-D curve
guided by D-IVI except in Tree-1 and Whole plant community where reverse trend was observed. In the Tree-1(Tree species > 15cm GBH) community, Cleistanthus collinus tops with A-IVI value of 18.51 followed by A. latifolia, D. melanoxylon, P.
marsupium, B. retusa, B. lanzan, C. swietiana, L. parviflora, S. chelonoides, L. coromandelica, N. arbor-tristis, Z. xylopyrus, T. alata, P. emblica, H. cordifolia, D. montana, M. parviflora, E. hookeriana, C. glauca and C. elliptica in decreasing order
(Fig.5-A1). At the same time, C. collinus also tops in Tree-1 community with D-IVI value of 21.34 followed by A. latifolia,
P. marsupium, D. melanoxylon, B. retusa, L. parviflora, T. alata, H. cordifolia, B. lanzan, C. swietiana, M. parviflora, S. chelonoides, L. coromandelica, D. aurea, T. bellirica, Z. xylopyrus, M. indica, P. emblica, E. hookeriana and S. oleosa
in decreasing order (Fig.5-A2). Sixteen species such as M.
parviflora, C. collinus, A. latifolia, D. melanoxylon, P. marsupium, B. retusa, B. lanzan, C. swietiana, L. parviflora, S. chelonoides, L. coromandelica, Z. xylopyrus, T. alata, P. emblica and H. cordifolia are observed in common to the top
ranking 20 species based on IVI guided by abundance and dominance.
Four species unique to top ranking twenty species projected by A-IVI are N. arbor-tristis, D. montana, C. glauca and C.
elliptica while four species unique to top ranking twenty
species projected by D-IVI are D. aurea, T. bellirica, M.
indica and S. oleosa. The R2 value 0.782 guided by A-IVI is
lower than the value 0.842 guided by D-IVI in the Tree-1 community. In the Tree-2(Tree species < 15cm GBH) community, A. latifolia, D. melanoxylon, C. swietiana, P.
marsupium, C. elliptica, C. collinus and E. hookeriana occupy
the top seven positions in decreasing order of both A-IVI and D-IVI values (Fig.5-B1& B2). From eighth position onwards, there is change in positions of different species depending up on index values. H. cordifolia and G. orbiculata are the two species with A-IVI which are absent in the top twenty tree species with D-IVI and S. oleosa and C. graveolens are the two species with D-IVI which are absent in the top twenty tree species with A-IVI in the Tree-2 community. All the eighteen tree species such as A. latifolia, D. melanoxylon, C. swietiana,
with A-IVI and D-IVI in the Tree-2 community. The R2 values of D-D curve guided by A-IVI and D-IVI in this community are 0.523 and 0.504 respectively. The shrub community is having 34 species. In the top twenty species guided by A-IVI and D-IVI, nineteen species such as T. maxima, D. strictus, H.
isora, P. barlerioides, D. pulchellum, A. torta, C. buchananii, G. hirsuta, S. polyandrum, I. cassioides, B. cristata, C. paniculata, B. montanum, M. extensa, W. fruiticosa, O. scandens, C. oppositifolia, L. asiatica and F. bracteata are
commonly found. D. velutinum and C. serratum are only found in top twenty species guided by A-IVI and D-IVI respectively. T. maxima tops with A-IVI of 72.09 and D.
strictus tops with D-IVI of 130.69 while T. maxima occupies
fourth position with D-IVI of 16.09 and D. strictus occupies second position with A-IVI of 54.98(Fig.5-C1 & C2). The correlation coefficients of D curves guided by A-IVI and D-IVI for shrub community are 0.530 and 0.306 respectively. Out of total twenty six species of LTC community, eighteen are commonly observed in the top twenty species guided by A-IVI and D-A-IVI. Those species are H. indicus, B. vahlii, G.
sylvestre, C. pariera, V. madraspatana, V. hainiana, D. glabra, V. denticulata, A. scarabaeoides, G. tenuiflora, A. tomentosa, D. puber, C. grandis, B. parviflora, D. tomentosa, D. wallichii, W. volubilis and C. repens (Fig.5-D1 & D2). Two
species I. eriocarpa and M. dioica present in top twenty species guided by A-IVI are absent in top twenty species guided by D-IVI while T. cordifolia and M. racemosa present in top twenty species guided by D-IVI are absent in top twenty species guided by IVI. H. indicus holds top position with A-IVI value of 36.32 followed by B. vahlii with 30.68 while B.
vahlii hold top position with D-IVI value of 101.63 followed
by H. indicus with 30.96 in the LTC community. C. repens occupies the same twentieth position in both Dominance-Diversity curves guided by A-IVI and D-IVI.
The correlation coefficients of D-D curves guided by A-IVI and D-IVI for LTC community are 0.667 and 0.313 respectively. The Herb/Grass community is having 82 species out of which twelve species are commonly shared by top twenty species guided by both A-IVI and D-IVI. Those twelve species are H. latebrosa, B. herbacea, F. argentea, A.
paniculata, M. japonica, C. parviflorum, A. mutica, C. parasitica, A. racemosus, C. orchioides, V. cinerea and H. salicifolia. Eight species present in top twenty Herb/Grass
species guided by A-IVI such as A. philippense, A. lancifolius,
A. incisum, C. farinosa, F. scandens, A. pumila, D. bupleuroides and T. quadrivalvis are absent in top twenty
Herb/Grass species guided by D-IVI. Likewise eight species present in top twenty Herb/Grass species guided by D-IVI such as C. arundinaceum, A. indica, C. longiflora, C.
trichocarpa, L. fasciculata, S. dulcis, C. verticillatus and G. abyssinica are absent in top twenty Herb/Grass species guided
by A-IVI. H. latebrosa and B. herbacea holds first and second place with A-IVI 19.76 and 14.04 but these two species interchange their ranks in the Dominance-Diversity curve guided by D-IVI with values 18.52 and 31.35 respectively (Fig. 5-E1 & E2). The correlation coefficient of Dominance-Diversity curves guided by abundance and dominance values of top twenty species having highest IVI are 0.714 and 0.501 respectively in the Herb/Grass community. The seedling community is enriched with 101 species. In the top twenty plant species of this community guided by both A- IVI and D-IVI, sixteen species such as A. torta, D. melanoxylon, S.
robusta, C. parviflorum, C. orchioides, C. swietiana, M. extensa, P. marsupium, C. paniculata, D. strictus, S. polyandrum, H. isora, A. latifolia, B. vahlii, P. barlerioides
and C. fistula are observed in common (Fig.5-F1 & F2). Four species found only in top twenty species group guided by A-IVI are T. maxima, H. latebrosa, M. indica and H. indicus while those four species found only in top twenty species group guided by D-IVI are V. denticulata, S. chelonoides, C.
collinus and W. volubilis. In the seedling community, A. torta
and D. melanoxylon occupies first and second positions with A-IVI value of 27.12 and 26.81 but these two species interchange their rank place in the Dominance-Diversity curve guided by D-IVI with values 36.60 and 41.55 respectively. The correlation coefficient of Dominance-Diversity curves guided by abundance and dominance values of top twenty seedling species having highest IVI are 0.684 and 0.569 respectively in the seedling community. The whole plant community consists of 232 plant species in total including Tree, Shrub, LTC, Herb and Grass species. In the top twenty plant species of whole plant community guided by both A- IVI and D-IVI, only nine species such as D. melanoxylon, D.
strictus, A. torta, H. latebrosa, A. latifolia, H. isora, C. swietiana, C. collinus and P. marsupium are observed in
common (Fig.5-G1 & G2). Out of these nine, five species are trees, three species are shrubs and one is Herb. In the total top twenty species guided by A-IVI, six are trees, six are shrubs and eight are Herb/Grass while there is no LTC species. Likewise, in the total top twenty species guided by D-IVI, majority sixteen species are trees, three species are shrubs and one species is only Herb/Grass while there is also no LTC species. Eleven species being present in the top twenty plant species group guided by A-IVI but absent in the top twenty plant species group guided by D-IVI are T. maxima, C.
parviflorum, F. argentea, A. philippense, A. lancifolius, B. herbacea, D. pulchellum, P. barlerioides, C. orchioides, S. robusta and M. Japonica.
Reversely, eleven species which are present in the top twenty plant species group guided by D-IVI but absent in the top twenty plant species group guided by A-IVI are B. retusa, H.
cordifolia, T. alata, L. parviflora, T. bellirica, M. indica, D. aurea, S. oleosa, B. lanzan, M. parviflora and S. chelonoides.
These eleven species happens to be all tree species. T. maxima tops in the rank of IVI guided by abundance with value of 17.43 followed by D. melanoxylon with index value of 10.16. but T. maxima is all total absent in the rank of IVI of top twenty plant species guided by dominance while at the same time D. melanoxylon tops in the same list with 13.53 index value. P. marsupium which is ranked twentieth in the A-IVI with index value 3.48 is holding the second position with index value 10.80 in the rank list of species guided by D-IVI. The correlation coefficient of Dominance-Diversity curves guided by abundance and dominance values of top twenty plant species having highest IVI are 0.584 and 0.903 respectively in the whole vegetation. Community wise plant species dynamics was studied earmarking the top twenty five plant species based on their abundance and dominance values (Fig.6). N. arbor-tristis with abundance 9 occupies the first rank in the Tree-1 community followed by C. collinus and G.
abundance 3 each and S. chelonoides, W. tinctoria, C. glauca,
B. serrata, E. nivulia, H. cordifolia, D. latifolia, P. emblica, L. coromandelica, A. acuminatum and C. dicoccum with
abundance 2 each come in series after D. melanoxylon. P.
marsupium holds first rank with dominance of 3.74m2
followed by B. retusa (3.14m2), C. collinus (3.11m2), A.
latifolia (2.76m2), H. cordifolia (2.51m2), T. bellirica
(2.48m2), T. alata (2.31m2), M. indica (2.26m2), D.
melanoxylon (2.24m2), D. aurea (1.96m2), L. parviflora
(1.87m2), S. oleosa (1.82m2), M. parviflora (1.41m2), B.
lanzan (1.31m2), C. swietiana (1.21m2), E. hookeriana
(0.86m2), S. chelonoides (0.80m2), Z. xylopyrus (0.79m2), B.
malabarica (0.78m2), B. ceiba (0.74m2), L. coromandelica
(0.64m2), P. emblica (0.54m2), G. latifolia (0.45m2), S.
cumini(0.44m2) and S. robusta (0.44m2). Only twelve species
common to 25 top ranking species guided by both abundance and dominance in Tree-1 community are C. collinus, A.
latifolia, D. melanoxylon, B. malabarica, C. swietiana, B. lanzan, B. retusa, P. marsupium, S. chelonoides, H. cordifolia, P. emblica and L. coromandelica. Therefore, 13 species
unique in top 25 tree species group controlled by abundance are N. arbor-tristis, G. orbiculata, C. tomentosa, A. marmelos,
D. montana, D. paniculata, W. tinctoria, C. glauca, B. serrata, E. nivulia, D. latifolia, A. acuminatum and C. dicoccum. On
the other hand, 13 species unique in top 25 tree species group controlled by Dominance are T. bellirica, T. alata, M. indica,
D. aurea, L. parviflora, S. oleosa, M. parviflora, E. hookeriana, Z. xylopyrus, B. ceiba, G. latifolia, S. cumini and S. robusta. N. arbor-tristis which holds first rank in the top 25
tree species group based on abundance is completely absent in the top 25 tree species group based on dominance value in the Tree-1 community.
In the Tree-2 community, G. orbiculata and A. latifolia holds first and second positions with abundance 5 and 4 respectively in the top 25 tree species group having highest abundance (Fig.6-B1). P. marsupium, C. glauca, D. melanoxylon, H.
cordifolia, C. swietiana and E. hookeriana with abundance 3
each and H. pubescens, B. lanzan, C. graveolens, D.
oojeinensis, D. montana, F. indica, H. nepalense, S. urens, T. chebula, C. collinus, A. marmelos, A. odoratissima, P. emblica, M. parviflora, S. cumini, B. retusa and C. tomentosa
with abundance 2 each come next in the series. A. latifolia
with dominance 0.08111m2 occupies first place followed in
series by D. melanoxylon, C. swietiana, P. marsupium, C.
collinus, E. hookeriana, P. emblica, C. elliptica, B. lanzan, C. glauca, L. parviflora, Z. xylopyrus, B. retusa, C. graveolens, T. alata, M. parviflora, L. coromandelica, H. pubescens, D. montana, H. cordifolia, A. marmelos, F. indica, S. oleosa, S. chelonoides and M. spinosa in the top 25 tree species group
based on dominance values (Fig.6-B2). Seventeen species common to these both top 25 tree species based on abundance and dominance are A. latifolia, P. marsupium, C. glauca, D.
melanoxylon, H. cordifolia, C. swietiana, E. hookeriana, H. pubescens, B. lanzan, C. graveolens, D. montana, F. indica, C. collinus, A. marmelos, P. emblica, M. parviflora and B. retusa.
Eight species present only in top 25 species based on abundance but absent in top 25 species based on dominance are G. orbiculata, D. oojeinensis, H. nepalense, S. urens, T.
chebula, A. odoratissima, S. cumini and C. tomentosa while
reversely eight species present in top 25 species based on dominance but absent in top 25 species based on abundance are C. elliptica, L. parviflora, Z. xylopyrus, T. alata, L.
coromandelica, S. oleosa, S. chelonoides and M. spinosa. G. orbiculata holding first position in the top 25 tree species
group based on abundance is completely absent in the top 25 tree species group based on dominance value in the Tree-2 community. In the shrub community, T. maxima having abundance 280 hold first rank followed by D. pulchellum, D.
strictus, B. montanum, D. velutinum, B. cristata, P. barlerioides, H. isora and C. oppositifolia with abundance
value of 65, 24, 14, 11, 10, 9, 7 and 6 respectively (Fig.6-C1). After this, C. buchananii, W. fruiticosa, M. malabathricum and
S. polyandrum with abundance 5 each; I. cassioides and T. lampas with abundance 4 each; L. asiatica, A. venenata, C. serratum, D. viscosa, T. pilosa, G. hirsuta, A. torta, F. bracteata and P. crassicaulis with abundance 3 each and O. scandens with abundance 2 come down in the series within the
group. Here in the shrub community, the second highest gap of 278 is found in the abundance of first rank species and twenty fifth rank species. In the top ranking 25 shrub species based on dominance value, D. strictus holds first position with
dominance of 0.73292m2. Then W. fruiticosa, H. isora, A.
torta, P. barlerioides, M. extensa, C. buchananii, P. crassicaulis, O. scandens, C. serratum, J. arborescens, S. virosa, T. maxima, S. polyandrum, E. paniculata, C. oppositifolia, F. bracteata, L. asiatica, D. viscosa, G. hirsuta, M. malabathricum, S. suaveolens, B. montanum, I. cassioides
and A. venenata come down in the series (Fig.6-C2). Twenty species are occurring in common to the two groups of 25 top ranking shrub species based on abundance and dominance values. These are T. maxima, D. strictus, B. montanum, P.
barlerioides, H. isora, C. oppositifolia, C. buchananii, W. fruiticosa, M. malabathricum, S. polyandrum, I. cassioides, L. asiatica, A. venenata, C. serratum, D. viscosa, G. hirsuta, A. torta, F. bracteata, P. crassicaulis and O. scandens. Five
species present only in 25 top ranking shrubs on the basis of abundance are D. pulchellum, D. velutinum, B. cristata, T.
lampas and T. pilosa. On the other hand, five species present
only in the 25 top ranking shrubs on the basis of dominance are M. extensa, J. arborescens, S. virosa, E. paniculata and S.
suaveolens. T. maxima occupying first position in the 25 top
ranking shrub species group holds 13th position in the 25 top
ranking species based on dominance. Out of D. pulchellum and
D. strictus occupying second and third position respectively in
the top ranking 25 shrubs, the first one is completely absent and second one holds first position in the top ranking 25 shrub species based on dominance values. In the LTC community, out of 26 species, 25 species have been depicted with highest abundance and dominance values (Fig.6-D1 & D2). It is seen that all 25 species are same in both the groups with different ranks. These species are G. sylvestre, I. eriocarpa, H. indicus,
M. dioica, B. vahlii, D. glabra, B. parviflora, D. tomentosa, D. wallichii, V. denticulata, V. madraspatana, V. hainiana, A. tomentosa, C. repens, D. puber, C. grandis, A. scarabaeoides, G. tenuiflora, A. latifolia, C. auriculata, M. racemosa, S. zeylanica, W. volubilis, C. pariera and T. cordifolia. G.
sylvestre holds first rank with abundance of 14 followed by I.
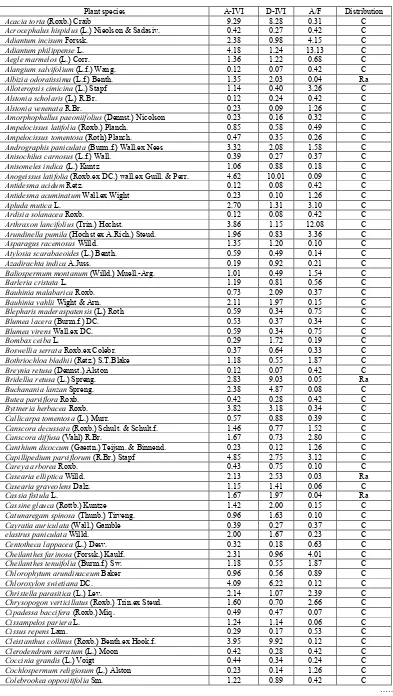
Table 1. Phytosociological attributes and distribution pattern of whole plant community
Plant species A-IVI D-IVI A/F Distribution
Acacia torta (Roxb.) Craib 9.29 8.28 0.31 C
Acrocephalus hispidus (L.) Nieolson & Sadasiv. 0.42 0.27 0.42 C
Adiantum incisum Forssk. 2.38 0.98 4.15 C
Adiantum philippense L. 4.18 1.24 13.13 C
Aegle marmelos (L.) Corr. 1.36 1.22 0.68 C
Alangium salvifolium (L.f.) Wang. 0.12 0.07 0.42 C
Albizia odoratissima (L.f.) Benth. 1.35 2.03 0.04 Ra
Alloteropsis cimicina (L.) Stapf 1.14 0.40 3.26 C
Alstonia scholaris (L.) R.Br. 0.12 0.24 0.42 C
Alstonia venenata R.Br. 0.23 0.09 1.26 C
Amorphophallus paeoniifolius (Dennst.) Nicolson 0.23 0.16 0.32 C
Ampelocissus latifolia (Roxb.) Planch. 0.85 0.58 0.49 C
Ampelocissus tomentosa (Roth) Planch. 0.47 0.35 0.26 C
Andrographis paniculata (Burm.f.) Wall.ex Nees 3.32 2.08 1.58 C
Anisochilus carnosus (L.f.) Wall. 0.39 0.27 0.37 C
Anisomeles indica (L.) Kuntz 1.06 0.88 0.18 C
Anogeissus latifolia (Roxb.ex DC.) wall.ex Guill. & Perr. 4.62 10.01 0.09 C
Antidesma acidum Retz. 0.12 0.08 0.42 C
Antidesma acuminatum Wall.ex Wight 0.23 0.10 1.26 C
Apluda mutica L. 2.70 1.31 3.10 C
Ardisia solanacea Roxb. 0.12 0.08 0.42 C
Arthraxon lancifolius (Trin.) Hochst. 3.86 1.15 12.08 C
Arundinella pumila (Hochst ex A.Rich.) Steud. 1.96 0.83 3.36 C
Asparagus racemosus Willd. 1.35 1.20 0.10 C
Atylosia scarabaeoides (L.) Benth. 0.59 0.49 0.14 C
Azadirachta indica A.Juss. 0.19 0.92 0.21 C
Baliospermum montanum (Willd.) Muell.-Arg. 1.01 0.49 1.54 C
Barleria cristata L. 1.19 0.81 0.56 C
Bauhinia malabarica Roxb. 0.73 2.09 0.37 C
Bauhinia vahlii Wight & Arn. 2.11 1.97 0.15 C
Blepharis maderaspatensis (L.) Roth 0.59 0.34 0.75 C
Blumea lacera (Burm.f.) DC. 0.53 0.37 0.34 C
Blumea virens Wall.ex DC. 0.59 0.34 0.75 C
Bombax ceiba L. 0.29 1.72 0.19 C
Boswellia serrata Roxb.ex Colebr. 0.37 0.64 0.33 C
Bothriochloa bladhii (Retz.) S.T.Blake 1.18 0.55 1.87 C
Breynia retusa (Dennst.) Alston 0.12 0.07 0.42 C
Bridellia retusa (L.) Spreng. 2.83 9.03 0.05 Ra
Buchanania lanzan Spreng. 2.38 4.87 0.08 C
Butea parviflora Roxb. 0.42 0.28 0.42 C
Byttneria herbacea Roxb. 3.82 3.18 0.34 C
Callicarpa tomentosa (L.) Murr. 0.57 0.88 0.39 C
Canscora decussata (Roxb.) Schult. & Schult.f. 1.46 0.77 1.52 C
Canscora diffusa (Vahl) R.Br. 1.67 0.73 2.80 C
Canthium dicoccum (Gaertn.) Teijsm. & Binnend. 0.23 0.12 1.26 C
Capillipedium parviflorum (R.Br.) Stapf 4.85 2.75 3.12 C
Careya arborea Roxb. 0.43 0.75 0.10 C
Casearia elliptica Willd. 2.13 2.53 0.03 Ra
Casearia graveolens Dalz. 1.15 1.41 0.06 C
Cassia fistula L. 1.67 1.97 0.04 Ra
Cassine glauca (Rottb.) Kuntze 1.42 2.00 0.15 C
Catunaregam spinosa (Thunb.) Tirveng. 0.96 1.63 0.10 C
Cayratia auriculata (Wall.) Gamble 0.39 0.27 0.37 C
elastrus paniculata Willd. 2.00 1.67 0.23 C
Centotheca lappacea (L.) Desv. 0.32 0.18 0.63 C
Cheilanthes farinosa (Forssk.) Kaulf. 2.31 0.96 4.01 C
Cheilanthes tenuifolia (Burm.f.) Sw. 1.18 0.55 1.87 C
Chlorophytum arundinaceum Baker 0.96 0.56 0.89 C
Chloroxylon swietiana DC. 4.09 6.22 0.12 C
Christella parasitica (L.) Lev. 2.14 1.07 2.39 C
Chrysopogon verticillatus (Roxb.) Trin.ex Steud. 1.60 0.70 2.66 C
Cipadessa baccifera (Roxb.) Miq. 0.49 0.47 0.07 C
Cissampelos pariera L. 1.24 1.14 0.06 C
Cissus repens Lam. 0.29 0.17 0.53 C
Cleistanthus collinus (Roxb.) Benth.ex Hook.f. 3.95 9.92 0.12 C
Clerodendrum serratum (L.) Moon 0.42 0.28 0.42 C
Coccinia grandis (L.) Voigt 0.44 0.34 0.24 C
Cochlospermum religiosum (L.) Alston 0.23 0.14 1.26 C
Colebrookea oppositifolia Sm. 1.22 0.89 0.42 C
Colocasia esculenta (L.) Schott 0.18 0.08 0.84 C
Combretum roxburghii Spreng. 0.63 0.47 0.29 C
Commelina erecta L. 0.78 0.31 2.10 C
Costus speciosus (Koenig) Sm. 0.42 0.33 0.21 C
Crotalaria prostrata Rottl.ex Willd. 0.61 0.34 0.79 C
Cryptolepis buchananii Roem. & Schult. 1.92 1.68 0.15 C
Curculigo orchioides Gaertn. 3.56 2.45 1.09 C
Curculigo trichocarpa (Wight) Bennet & Raizada 1.17 0.42 3.36 C
Curcuma zedoaria (Christm.) Rosc. 0.40 0.12 2.52 C
Curcumorpha longiflora (Wall.) A.S.Rao & Verma 0.51 0.31 0.61 C
Cyperus brevifolius (Rottb.) Hassk. 1.35 0.73 1.39 C
Cyperus difformis L. 1.69 0.32 12.18 C
Cyperus halpan L. 1.35 0.27 9.66 C
Cyperus nutans Vahl 0.34 0.11 2.10 C
Cyperus rotundus L. 0.29 0.10 1.68 C
Dalbergia latifolia Roxb. 1.06 1.71 0.18 C
Dalbergia paniculata Roxb. 1.15 1.07 0.28 C
Dendrocalamus strictus (Roxb.) Nees 9.57 9.92 0.34 C
Desmodium gangeticum (L.) DC. 0.39 0.20 0.84 C
Desmodium oojeinensis (Roxb.) Ohashi 1.33 1.53 0.08 C
Desmodium pulchellum (L.) Benth. 3.71 0.64 27.30 C
Desmodium velutinum (Willd.) DC. 0.78 0.41 1.12 C
Dicliptera bupleuroides Nees 1.94 0.82 3.31 C
Dillenia aurea Sm. 1.39 5.30 0.04 Ra
Dimeria ornithopoda Trin. 0.51 0.14 3.36 C
Dioscorea bulbifera L. 0.23 0.16 0.32 C
Dioscorea glabra Roxb. 0.53 0.37 0.34 C
Dioscorea puber Bl. 0.54 0.43 0.20 C
Dioscorea tomentosa Koenig ex Spreng. 0.42 0.27 0.42 C
Dioscorea wallichii Hook.f. 0.32 0.18 0.63 C
Diospyros melanoxylon Roxb. 10.16 13.53 0.37 C
Diospyros montana Roxb. 1.74 1.83 0.08 C
Dodonaea viscosa (L.) Jacq. 0.23 0.16 0.32 C
Elephantopus scaber L. 0.29 0.10 1.68 C
Embelia tsjeriam-cottam (Roem. & Schult.) DC. 0.12 0.07 0.42 C
Eriolaena hookeriana Wight & Arn. 1.82 3.49 0.05 Ra
Erycibe paniculata Roxb. 0.23 0.16 0.32 C
Erythrina variegata L. 0.18 0.18 0.84 C
Eulalia quadrinervis (Hack.) Kuntze 1.40 0.63 2.29 C
Euphorbia nivulia Buch.-Ham. 0.42 0.51 0.21 C
Evolvulus alsinoides (L.) L. 0.23 0.09 1.26 C
Evolvulus nummularius (L.) L. 0.23 0.09 1.26 C
Ficus arnottiana (Miq.) Miq. 0.12 0.08 0.42 C
Ficus benghalensis L. 0.12 0.13 0.42 C
Ficus microcarpa L.f. 0.12 0.48 0.42 C
Ficus religiosa L. 0.12 0.08 0.42 C
Ficus virens Ait. 0.12 0.08 0.42 C
Fimbristylis argentea (Rottb.) Vahl 4.57 1.34 14.39 C
Flacourtia indica (Burm.f.) Merr. 0.75 0.68 0.16 C
Flemingia bracteata (Roxb.) Wight 0.47 0.35 0.26 C
Floscopa scandens Lour. 2.17 0.69 6.62 C
Galactia tenuiflora (Klein ex Willd.) Wight & Arn. 0.52 0.42 0.18 C
Gardenia gummifera L.f. 0.57 1.06 0.13 C
Gardenia latifolia Ait. 1.23 2.02 0.08 C
Garuga pinnata Roxb. 0.56 0.76 0.12 C
Globba racemosa Sm. 0.51 0.14 3.36 C
Glochidion zeylanicum (Gaertn.) Juss. 0.12 0.08 0.42 C
Gloriosa superba L. 0.60 0.46 0.25 C
Gmelina arborea Roxb. 0.43 1.09 0.10 C
Grewia hirsuta Vahl. 1.94 1.79 0.07 C
Grewia orbiculata Rottl. 0.62 0.20 4.20 C
Grewia tiliifolia Vahl 0.19 0.32 0.21 C
Guizotia abyssinica (L.f.) Cass. 1.60 1.41 0.12 C
Gymnema sylvestre (Retz.) R.Br.ex Schult. 0.85 0.19 5.88 C
Haldinia cordifolia (Roxb.) Ridsd. 2.02 6.96 0.07 C
Hedyotis affinis Roem. & Schult. 0.54 0.32 0.65 C
Hedyotis verticillata (L.) Lam. 0.71 0.29 1.89 C
Helicteres isora L. 4.58 4.26 0.11 C
Hemidesmus indicus (L.) R.Br. 2.19 1.87 0.19 C
Hemigraphis latebrosa (Heyne ex Roth) Nees 7.08 4.68 2.39 C
Heteropogon contortus (L.) P.Beauv. 1.52 0.67 2.52 C
Holarrhena pubescens (Buch.-Ham.) Wall.ex G.Don. 1.63 1.68 0.07 C
Homalium nepalense Benth. 0.42 0.24 0.95 C
Hygrophila salicifolia (Vahl) Nees 1.26 0.91 0.45 C
Indigofera cassioides Rottl.ex DC. 1.37 1.16 0.17 C
Ipomea eriocarpa R.Br. 0.51 0.14 3.36 C
Ixora pavetta Andr. 0.19 0.24 0.21 C
Jasminum arborescens Roxb. 0.23 0.16 0.32 C
Justicia diffusa Willd. 0.46 0.29 0.51 C
Knoxia sumatrensis (Retz.) DC. 0.93 0.62 0.55 C
Kydia calycina Roxb. 0.98 1.30 0.29 C
Lagerstroemia parviflora Roxb. 2.80 6.48 0.04 Ra
Lannea coromandelica (Houtt.) Merr. 2.14 3.35 0.04 Ra
Laportea interrupta (L.) Chew 0.57 0.39 0.39 C
Leea asiatica (L.) Ridsdale 0.69 0.50 0.34 C
Lepidagathis fasciculata (Retz.) Nees 0.91 0.61 0.54 C
Leptadenia reticulata (Retz.) Wight & Arn. 0.12 0.07 0.42 C
Leucas mollissima Wall.ex Benth. 0.42 0.21 0.95 C
Lygodium flexuosum (L.) Sw. 0.29 0.17 0.53 C
Madhuca indica Gmel. 1.33 5.67 0.21 C
Mallotus philippensis (Lam.) Muell.-Arg. 0.19 0.18 0.21 C
Mangifera indica L. 0.51 0.20 3.36 C
Melastoma malabathricum L. 0.34 0.11 2.10 C
Meyna spinosa Roxb.ex Link. 1.13 1.16 0.08 C
Millettia extensa (Benth.) Baker 3.01 2.49 0.32 C
Millettia racemosa (Roxb.) Benth. 0.26 0.18 0.42 C
Mitracarpus villosus (Sw.) DC. 1.78 0.58 5.36 C
Mitragyna parviflora (Roxb.) Korth. 2.09 4.86 0.04 Ra
Momordica dioica Roxb.ex Willd. 0.29 0.10 1.68 C
Morinda pubescens Sm. 0.61 0.56 0.09 C
Murdannia japonica (Thunb.) Faden 3.50 1.05 10.92 C
Murraya paniculata (L.) Jack 0.19 0.19 0.21 C
Nyctanthes arbor-tristis L. 0.91 0.87 1.35 C
Olax scandens Roxb. 0.60 0.46 0.25 C
Oplismenus compositus (L.) P.Beauv. 0.52 0.24 1.26 C
Orthosiphon rubicundus (D. Don) Benth. 1.06 0.68 0.67 C
Panicum notatum Retz. 0.45 0.22 1.05 C
Pavetta crassicaulis Bremek. 0.29 0.18 0.53 C
Pavonia odorata Willd. 0.49 0.23 1.16 C
Pennisetum pedicellatum Trin. 1.46 0.49 4.31 C
Petalidium barlerioides (Roth.) Nees 3.58 3.14 0.19 C
Phoenix sylvestris (L.) Roxb. 0.23 0.10 1.26 C
Phyllanthus emblica L. 2.26 3.25 0.06 C
Pimpinella heyneana (Wall.ex DC.) Kurz 0.34 0.11 2.10 C
Pogostemon benghalensis (Burm.f.) Kuntze 0.29 0.17 0.53 C
Polygonum barbatum L. 0.34 0.11 2.10 C
Pongamia pinnata (L.) Pierre 0.19 0.19 0.21 C
Protium serratum (Wall.ex Colebr.) Engl. 0.36 0.40 0.13 C
Pterocarpus marsupium Roxb. 3.48 10.80 0.07 C
Pterospermum acerifolium (L.) Willd. 0.12 0.08 0.42 C
Rungia pectinata (L.) Nees 0.68 0.16 4.62 C
Schleichera oleosa (Lour.) Oken 1.50 5.10 0.05 Ra
Schrebera swietenioides Roxb. 1.20 1.74 0.04 Ra
Scoparia dulcis L. 0.71 0.38 0.98 C
Securinega virosa (Roxb.ex Willd.) Baill. 0.34 0.25 0.28 C
Selaginella repanda (Desv.ex Poir.) Spring 1.35 0.82 0.94 C
Semecarpus anacardium L.f. 1.59 1.89 0.15 C
Shorea robusta Gaertn.f. 3.54 2.56 4.17 C
Sida cordata (Burm.f.) Borssum 0.42 0.27 0.42 C
Sida rhombifolia L. 0.69 0.44 0.55 C
Smilax zeylanica L. 0.29 0.17 0.53 C
Sorghum nitidum (Vahl) Pers. 1.07 0.22 7.56 C
Spermadictyon suaveolens Roxb. 0.18 0.08 0.84 C
Sterculia urens Roxb. 0.77 1.26 0.11 C
Stereospermum chelonoides (L.f.) DC. 2.58 4.06 0.05 Ra
Streblus asper Lour. 0.12 0.10 0.42 C
Strychnos nux-vomica L. 0.53 0.57 0.34 C
Symphorema polyandrum Wight 2.12 1.79 0.21 C
Syzygium cumini (L.) Skeels 0.49 1.30 0.15 C
Terminalia alata Heyne ex Roth 2.24 6.83 0.04 Ra
Terminalia bellirica (Gaertn.) Roxb. 1.01 5.96 0.05 Ra
Terminalia chebula Retz. 1.02 1.71 0.06 C
Themeda quadrivalvis (L.) Kuntze 1.95 0.63 5.88 C
Themeda triandra Forssk. 0.76 0.40 1.07 C
Thespesia lampas (Cav.) Dalz. & Gibs. 0.32 0.18 0.63 C
in the series. B. vahlii which occupies fifth rank in abundance ranking holds first rank in dominance ranking with occupied
area of 0.06581m2. Following B. vahlii in the dominance
ranking, M. racemosa, B. parviflora, V. madraspatana, W.
volubilis, T. cordifolia, V. denticulata, H. indicus, G. sylvestre, S. zeylanica, A. tomentosa, D. puber, C. auriculata, D. tomentosa, C. pariera, A. latifolia, V. hainiana, C. repens, D. glabra, I. eriocarpa, C. grandis, G. tenuiflora, A. scarabaeoides, M. dioica and D. wallichii come down in the
series. D. wallichii occupying 25th rank in the dominance
ranking holds 9th position in abundance ranking and T.
cordifolia occupying 25th rank in abundance ranking holds 6th
position in dominance ranking. Collectively, there are 82 herb and grass species occurring along the investigated elevational limits of Gandhamardan hills. According to ranking of herb and grass species based on abundance, F. argentea occupies first position with abundance of 69 followed by A. philippense,
H. latebrosa, A. lancifolius, M. japonica, F. scandens, A. incisum, A. mutica, C. difformis, C. farinosa, T. quadrivalvis, A. paniculata, M. villosus, A. pumila, D. bupleuroides, C. halpan, C. parviflorum, C. parasitica, P. pedicellatum, C. diffusa, C. verticillatus, H. contortus, S. nitidum, E. quadrinervis and C. trichocarpa with abundance of 63, 61, 58,
52, 32, 30, 30, 29, 29, 28, 26, 26, 24, 24, 23, 23, 23, 21, 20, 19, 18, 18, 16 and 16 respectively (Fig.6-E1). Like this on the basis of ranking by dominance, H. latebrosa occupies first
position with 0.00539m2 followed by V. cinerea, B. herbacea,
C. arundinaceum, C. longiflora, C. trichocarpa, S. dulcis, A. paniculata, L. fasciculata, C. verticillatus, M. japonica, A. indica, C. parviflorum, A. mutica, E. quadrinervis, C. orchioides, T. quadrivalvis, D. bupleuroides, H. contortus, B. bladhii, H. salicifolia, U. indica, A. paeoniifolius, C. zedoaria
and G. superba down in the series (Fig.6-E2). 14 species
occurring only in top 25 ranked species based on abundance but not in top 25 ranked species based on dominance are F.
argentea, A. philippense, A. lancifolius, F. scandens, A. incisum, C. difformis, C. farinosa, M. villosus, A. pumila, C. halpan, C. parviflorum, C. parasitica, P. pedicellatum, C. diffusa and S. nitidum. At the same time, 14 species occurring
only in top 25 ranked species based on dominance but not in top 25 ranked species based on abundance are V. cinerea, B.
herbacea, C. arundinaceum, C. longiflora, S. dulcis, L. fasciculata, A. indica, C. orchioides, B. bladhii, H. salicifolia, U. indica, A. paeoniifolius, C. zedoaria and G. superba. F. argentea occupying first position in the top ranking 25 species
based on abundance is completely absent in the top ranking 25 species based on dominance while H. latebrosa occupying first position in the top ranking 25 species based on dominance is occupying third position in the top ranking 25 species based on abundance. On the other hand, C. trichocarpa occupying twenty-fifth position in the top ranking 25 species based on abundance has placed itself in the sixth position in the top ranking 25 species based on dominance while G. superba occupying twenty-fifth position in the top ranking 25 species based on dominance is completely absent in the top ranking 25 species based on abundance. The seedling community is having 101 species. Based on abundance and dominance, top ranking 25 species have been depicted in the graph to study their dynamics (Fig.6- F1 & F2). Eighteen seedling species are observed in common to the both top ranking 25 species based on abundance and dominance. These are S. robusta, C.
parviflorum, C. orchioides, T. maxima, D. melanoxylon, A. torta, H. latebrosa, M. indica, M. extensa, S. anacardium, D. strictus, A. marmelos, V. madraspatana, Madhuca indica, P. barlerioides, C. oppositifolia, D. paniculata and C. collinus.
Seven seedling species found only in top 25 based on abundance are C. paniculata, K. sumatrensis, H. cordifolia,
Mangifera indica, H. indicus, F. indica and A. latifolia. On the
other side, only seven seedling species found in top 25 based on dominance are P. marsupium, H. isora, G. latifolia, S.
polyandrum, D. montana, S. chelonoides and W. volubilis. S. robusta holding first position with abundance of 152 in the top
25 species based on abundance also occupies fourth position
with dominance of 0.00323m2. D. melanoxylon with
dominance of 0.00663m2 occupying first position in the top
ranking 25 seedling species based on dominance holds 5th
position in top ranking 25 seedling species based on
abundance. C. collinus occupying 25th position in seedling
species ranking based on abundance is placed in 15th position
with dominance of 0.00039m2 in the seedling species ranking
based on dominance while W. volubilis occupying 25th position
in the top ranking 25 seedling species based on dominance is absent within the top 25 seedling species based on abundance.
D. strictus and A. torta occupying 2nd and 3rd position in the
top ranking 25 species based on dominance holds 12th and 6th
position in the top ranking 25 species based on abundance. C.
parviflorum and C. orchioides occupying 2nd and 3rd position
in the top ranking 25 species based on abundance holds 16th
and 6th position in the top ranking 25 species based on
dominance.
Thysanolaena maxima (Roxb.) Kuntze 17.43 2.82 130.20 C
Tinospora cordifolia (Willd.) Hook.f. & Thoms. 0.59 0.41 0.42 C
Trema orientalis (L.) Bl. 0.12 0.11 0.42 C
Triumfetta pilosa Roth. 0.42 0.27 0.42 C
Triumfetta rhomboidea Jacq. 0.51 0.37 0.32 C
Urginea indica (Roxb.) Kunth 0.59 0.34 0.75 C
Ventilago denticulata Willd. 1.37 1.12 0.22 C
Ventilago madraspatana Gaertn. 0.89 0.66 0.35 C
Vernonia cinerea (L.) Less. 1.92 1.29 0.81 C
Vigna hainiana Babu 0.56 0.44 0.22 C
Wattakaka volubilis (L.f.) Stapf 1.18 1.00 0.16 C
Woodfordia fruiticosa (L.) Kurz 0.80 0.69 0.44 C
Wrightia arborea (Dennst.) Mabb. 0.49 0.59 0.15 C
Wrightia tinctoria (Roxb.) R.Br. 0.89 0.75 0.52 C
Ziziphus mauritiana Lam. 0.19 0.16 0.21 C
Ziziphus oenoplia (L.) Mill. 0.51 0.41 0.17 C
Ziziphus rugosa Lam. 0.41 0.42 0.08 C
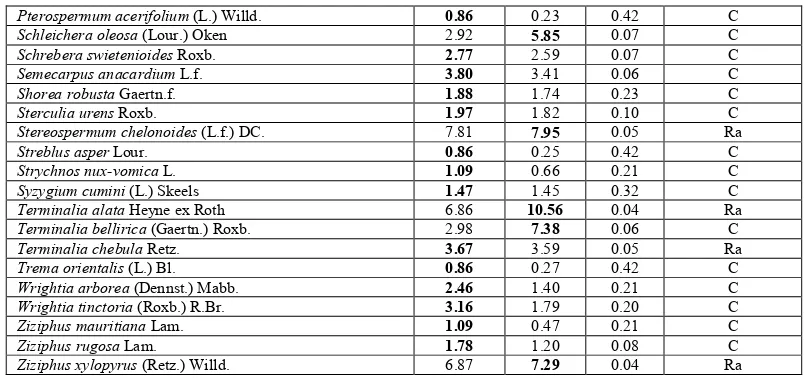
Table 2. Phytosociological attributes and distribution pattern of Tree-1 (>15cm GBH) community
Plant species A-IVI D-IVI A/F Distribution
Aegle marmelos (L.) Corr. 3.60 1.88 0.34 C
Albizia odoratissima (L.f.) Benth. 2.98 2.99 0.06 C
Alstonia scholaris (L.) R.Br. 0.86 0.40 0.42 C
Anogeissus latifolia (Roxb.ex DC.) Wall.ex Guill. & Perr. 13.79 17.29 0.05 Ra
Antidesma acidum Retz. 0.86 0.23 0.42 C
Antidesma acuminatum Wall.ex Wight 1.56 0.31 0.84 C
Ardisia solanacea Roxb. 0.86 0.23 0.42 C
Azadirachta indica A.Juss. 1.09 1.25 0.21 C
Bauhinia malabarica Roxb. 3.94 3.55 0.27 C
Bombax ceiba L. 1.32 2.23 0.14 C
Boswellia serrata Roxb.ex Colebr. 2.44 1.37 0.33 C
Bridellia retusa (L.) Spreng. 9.65 14.53 0.05 Ra
Buchanania lanzan Spreng. 9.32 10.17 0.06 C
Callicarpa tomentosa (L.) Murr. 3.40 1.37 0.84 C
Canthium dicoccum (Gaertn.) Teijsm. & Binnend. 1.56 0.33 0.84 C
Careya arborea Roxb. 1.60 1.15 0.19 C
Casearia elliptica Willd. 4.43 4.04 0.04 Ra
Casearia graveolens Dalz. 3.67 3.15 0.05 Ra
Cassia fistula L. 2.54 1.97 0.11 C
Cassine glauca (Rottb.) Kuntze 5.08 4.37 0.09 C
Catunaregam spinosa (Thunb.) Tirveng. 3.37 3.06 0.09 C
Chloroxylon swietiana DC. 9.06 9.65 0.07 C
Cipadessa baccifera (Roxb.) Miq. 2.01 1.41 0.07 C
Cleistanthus collinus (Roxb.) Benth.ex Hook.f. 18.51 21.34 0.09 C
Cochlospermum religiosum (L.) Alston 1.56 0.35 0.84 C
Dalbergia latifolia Roxb. 2.96 2.42 0.18 C
Dalbergia paniculata Roxb. 3.00 1.28 0.42 C
Desmodium oojeinensis (Roxb.) Ohashi 3.37 2.59 0.09 C
Dillenia aurea Sm. 4.19 7.52 0.04 Ra
Diospyros melanoxylon Roxb. 12.53 14.95 0.06 C
Diospyros montana Roxb. 6.11 4.39 0.12 C
Eriolaena hookeriana Wight & Arn. 5.30 6.11 0.04 Ra
Erythrina variegata L. 1.56 0.40 0.84 C
Euphorbia nivulia Buch.-Ham. 2.44 1.16 0.33 C
Ficus arnottiana (Miq.) Miq. 0.86 0.24 0.42 C
Ficus benghalensis L. 0.86 0.29 0.42 C
Ficus microcarpa L.f. 0.86 0.64 0.42 C
Ficus religiosa L. 0.86 0.24 0.42 C
Ficus virens Ait. 0.86 0.23 0.42 C
Flacourtia indica (Burm.f.) Merr. 1.78 1.04 0.13 C
Gardenia gummifera L.f. 2.17 1.87 0.12 C
Gardenia latifolia Ait. 3.06 3.30 0.05 Ra
Garuga pinnata Roxb. 1.97 1.51 0.10 C
Glochidion zeylanicum (Gaertn.) Juss. 0.86 0.23 0.42 C
Gmelina arborea Roxb. 1.97 1.96 0.10 C
Grewia orbiculata Rottl. 3.66 0.55 2.10 C
Grewia tilifolia Vahl 1.09 0.64 0.21 C
Haldinia cordifolia (Roxb.) Ridsd. 6.51 10.33 0.06 C
Holarrhena pubescens (Buch.-Ham.) Wall.ex G.Don 2.54 1.76 0.11 C
Homalium nepalense Benth. 1.86 0.63 0.42 C
Ixora pavetta Andr. 1.09 0.56 0.21 C
Kydia calycina Roxb. 2.23 1.70 0.18 C
Lagerstroemia parviflora Roxb. 7.98 10.69 0.03 Ra
Lannea coromandelica (Houtt.) Merr. 7.78 7.80 0.04 Ra
Madhuca indica Gmel. 2.77 6.70 0.07 C
Mallotus philippensis (Lam.) Muell.-Arg. 1.09 0.49 0.21 C
Mangifera indica L. 0.86 0.29 0.42 C
Meyna spinosa Roxb.ex Link 1.88 0.96 0.23 C
Mitragyna parviflora (Roxb.) Korth. 6.04 8.01 0.03 Ra
Morinda pubescens Sm. 1.56 0.32 0.84 C
Murraya paniculata (L.) jack 1.09 0.50 0.21 C
Nyctanthes arbor-tristis L. 7.78 2.76 1.21 C
Phoenix sylvestris (L.) Roxb. 0.86 0.23 0.42 C
Phyllanthus emblica L. 6.70 6.46 0.05 Ra
Pongamia pinnata (L.) Pierre 1.09 0.50 0.21 C
Protium serratum (Wall.ex Colebr.) Engl. 1.60 0.86 0.19 C
Pterocarpus marsupium Roxb. 10.22 16.32 0.04 Ra
Pterospermum acerifolium (L.) Willd. 0.86 0.23 0.42 C
Schleichera oleosa (Lour.) Oken 2.92 5.85 0.07 C
Schrebera swietenioides Roxb. 2.77 2.59 0.07 C
Semecarpus anacardium L.f. 3.80 3.41 0.06 C
Shorea robusta Gaertn.f. 1.88 1.74 0.23 C
Sterculia urens Roxb. 1.97 1.82 0.10 C
Stereospermum chelonoides (L.f.) DC. 7.81 7.95 0.05 Ra
Streblus asper Lour. 0.86 0.25 0.42 C
Strychnos nux-vomica L. 1.09 0.66 0.21 C
Syzygium cumini (L.) Skeels 1.47 1.45 0.32 C
Terminalia alata Heyne ex Roth 6.86 10.56 0.04 Ra
Terminalia bellirica (Gaertn.) Roxb. 2.98 7.38 0.06 C
Terminalia chebula Retz. 3.67 3.59 0.05 Ra
Trema orientalis (L.) Bl. 0.86 0.27 0.42 C
Wrightia arborea (Dennst.) Mabb. 2.46 1.40 0.21 C
Wrightia tinctoria (Roxb.) R.Br. 3.16 1.79 0.20 C
Ziziphus mauritiana Lam. 1.09 0.47 0.21 C
Ziziphus rugosa Lam. 1.78 1.20 0.08 C
Ziziphus xylopyrus (Retz.) Willd. 6.87 7.29 0.04 Ra
Table 3. Phytosociological attributes and distribution pattern of Tree-2 (<15cm GBH) community
Plant species A-IVI D-IVI A/F Distribution
Aegle marmelos (L.) Corr. 4.30 3.92 0.18 C
Alangium salvifolium (L.f.) Wang. 1.54 0.53 0.42 C
Albizia odoratissima (L.f.) Benth. 4.30 3.13 0.18 C
Anogeissus latifolia (Roxb.ex DC.) Wall.ex Guill. & Perr. 30.00 43.73 0.06 C
Antidesma acuminatum Wall.ex Wight 1.54 0.79 0.42 C
Bauhinia malabarica Roxb. 1.54 0.78 0.42 C
Bombax ceiba L. 1.54 0.51 0.42 C
Bridellia retusa (L.) Spreng. 5.75 6.37 0.09 C
Buchanania lanzan Spreng. 8.67 9.94 0.08 C
Callicarpa tomentosa (L.) Murr. 2.72 2.16 0.32 C
Canthium dicoccum (Gaertn.) Teijsm. & Binnend. 1.54 0.53 0.42 C
Casearia elliptica Willd. 10.28 12.41 0.03 Ra
Casearia graveolens Dalz. 5.39 5.54 0.17 C
Cassia fistula L. 3.87 3.20 0.10 C
Cassine glauca (Rottb.) Kuntze 8.11 8.13 0.21 C
Catunaregam spinosa (Thunb.) Tirveng. 2.72 2.02 0.32 C
Chloroxylon swietiana DC. 12.04 14.85 0.09 C
Cleistanthus collinus (Roxb.) Benth.ex Hook.f. 9.73 12.32 0.07 C
Cochlospermum religiosum (L.) Alston 1.54 0.58 0.42 C
Dalbergia latifolia Roxb. 3.49 3.09 0.08 C
Dalbergia paniculata Roxb. 3.04 2.24 0.19 C
Desmodium oojeinensis (Roxb.) Ohashi 2.76 1.29 0.84 C
Dillenia aurea Sm. 3.87 3.55 0.10 C
Diospyros melanoxylon Roxb. 15.06 20.13 0.08 C
Diospyros montana Roxb. 5.39 4.81 0.17 C
Eriolaena hookeriana Wight & Arn. 8.86 10.43 0.14 C
Euphorbia nivulia Buch.-Ham. 1.54 0.70 0.42 C
Flacourtia indica (Burm.f.) Merr. 4.73 4.04 0.21 C
Gardenia gummifera L.f. 2.72 1.62 0.32 C
Gardenia latifolia Ait. 2.52 1.59 0.14 C
Garuga pinnata Roxb. 1.54 0.79 0.42 C
Grewia orbiculata Rottl. 6.42 1.88 2.10 C
Haldinia cordifolia (Roxb.) Ridsd. 6.90 5.48 0.24 C
Holarrhena pubescens (Buch.-Ham.) Wall.ex G.Don 7.96 7.21 0.12 C
Homalium nepalense Benth. 2.76 1.26 0.84 C
Kydia calycina Roxb. 1.54 0.55 0.42 C
Lagerstroemia parviflora Roxb. 7.90 9.24 0.04 Ra
Lannea coromandelica (Houtt.) Merr. 5.56 5.89 0.07 C
Madhuca indica Gmel. 2.52 1.97 0.14 C
Meyna spinosa Roxb.ex Link. 5.56 5.33 0.07 C
Mitragyna parviflora (Roxb.) Korth. 7.16 7.32 0.08 C
Phyllanthus emblica L. 8.54 10.35 0.07 C
Protium serratum (Wall.ex Colebr.) Engl. 1.54 0.50 0.42 C
Pterocarpus marsupium Roxb. 11.15 12.95 0.15 C
Schleichera oleosa (Lour.) Oken 5.45 5.76 0.05 Ra
Schrebera swietenioides Roxb. 3.87 3.63 0.10 C
Semecarpus anacardium L.f. 2.72 1.39 0.32 C
Shorea robusta Gaertn.f. 2.03 1.10 0.21 C
Sterculia urens Roxb. 3.42 1.77 0.42 C