DOI: 10.5958/0976-4666.2017.00011.0
©2017 New Delhi Publishers. All rights reserved
Marketing Efficiency and Marketing Channels for Paddy Crop
in the Eastern Region of Uttar Pradesh
Pushpa and S.K. Srivastava
21Assistant Professor Junagadh Agriculture University, College of Amreli, Gujarat, India 2Associate Professor, Agriculture Economics, G.B.P.U.A.&T. Pantnagar, Uttarakhand, India Corresponding author: pushpayadavndri@gmail.com
AbstRACt
The study was undertaken in Deoria district of Uttar Pradesh to examine marketed surplus, marketing surplus, disposal pattern and constraints which are faced by the paddy growers in the study area. A sample of 80 farmers of Deoria district (Uttar Pradesh) was selected from 6 villages of two blocks for the year 2009-10. According to this study, the average marketable surplus per farm was 43.26 quintals per farm and the highest marketable surplus was with the large farm household that is to the tune of 77.03 quintals per farm. The average marketed surplus across the farm size group was 44.38 quintals which was more than marketable surplus. Marketed surplus was lowest with marginal farmers i.e. only 25.92 quintals followed by small (28.85 quintals), medium (48.13 quintals) and large (74.65 quintals) farm households. The average on farm requirement across the farm size group was 15.12 quintals which was highest at large farm households. Due to improper infrastructural facilities farmers were forced to sale their crop produce in the local markets at lower prices. There was existence of distress sale on the marginal farms. Lack of suitable market was quite common problem. Poor storage facility also compelled the farmers to sell their produce just after harvesting. Monopoly of buyers /contractors was also quite common observation in the study area. Inadequate price information system was also found as an important marketing problem experienced by the producer-sellers in the study area.
Keywords: Marketing pattern, marketed surplus, marketable surplus, marketing constraint
Globally the paddy productivity has gone up by almost 2.5 times in over 50 years. India stands first in paddy area, over 40 million hectares and second in production. It has almost tripled its production from merely 34.6 million tonnes (milled rice) in1990-61 to record production of 102.9 million tonnes in 2009-10 with average productivity being 2.43 tonnes per hectare. Rice is grown as staple food crop. Similarly, it is also grown for other products like parched rice, beaten rice and parched paddy. In other words rice is a major source of income and food for the farmers. The profitability of crops serves as an incentive for the farmers to adopt new farm technologies at a faster rate. Moreover, crop yield alone does not determine the profitability of a crop rather marketing also exercises an important place. Various research studies in the country have revealed numerous problems faced by farmers in
marketing of their produce and show low level of marketing efficiency and found that majority of the farmers did not have marketable surplus. Thus, there is a need to assess the marketing pattern followed by the farmers for identification of marketing constraints. Taking into account the significance of the aforementioned facts the study was based on following objectives.
1. To find out the marketing pattern followed by the farmers.
2. To find out the marketing constraints faced by the farmers.
MEthodology
Sampling technique
prepared and two blocks namely Gauri bazaar and Rudrapur were selected randomly. In the second stage one village from each selected block i.e. Pananha village from Gauri bazaar and Dharauli from Rudrapur block were selected randomly. Then two adjoining villages of Pananha and Dharauli namley Surajpur, Khairabanwa and Gahila, Tarasara were selected respectively.
Thus, in this way cluster of three villages ware formed in each selected block. In third stage farmers were classified into different categories of marginal (less than 1 ha of land), small (1-2 ha) medium (2-4 ha) and large (more than 4 ha). Then 20 farmers from each category were selected on the basis of probability proportion to their size from both the clusters of villages, respectively.
AnAlytiCAl fRAMEwoRk
Marketing pattern followed by farmers
To find out the marketing pattern followed by farmers;descriptive analysis was done to examine the marketable surplus, marketed surplus, price received, actual value realized, agency, expenditure incurred in selling the produce, frequency of sale, time of sale and place of sale etc.
Marketable surplus
MSi = Pi – Ci
Where,
MSi = Marketable surplus of ith commodity
Pi = Total production (qt) of ith commodity in a year
Ci = Total requirement of ith commodity at farm
in qt. for family consumption, seed, payments to labour, artisans, land lord and quantity offered for social and religious works, etc.
Marketed surplus
It is the quantity of produce which the producer-seller actually sells in the market, irrespective of his requirements.
To find out the constraints faced by the farmers in marketing of their produce; Garret’s ranking technique was used to rank the constraints faced by the farmers. The sample farmers were asked to rank the problems faced by them marketing of their crop produce. Then the ranks given to a constraint by the farmers were changed into percent position by using the following formula:
Percent position = 100(Rij-0.50)/Nj
Where, Rij =Rank given for ith item by jth individual.
Nj = Number of items ranked by jth individual.
Then the per cent of rank, for a single constraint was added for total farmers to give the overall percent position which was calculated by dividing sum of per cent of rank for total sample for a constraint by number of respondents. The average per cent position was then converted to scores by referring to the transmutation table, given by Garret’s. The ranks were finally assigned by arranging the scores in descending order.
REsUlts And disCUssion
Marketed and Marketable Surplus
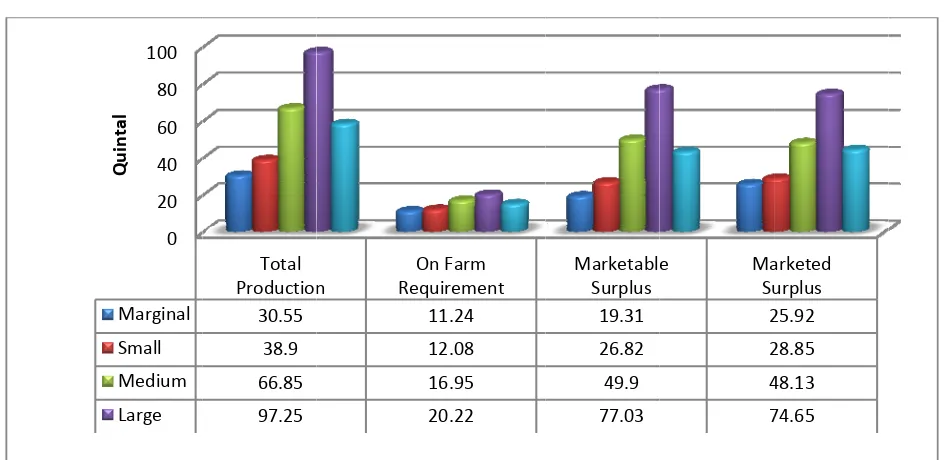
The average marketable surplus per farm for all the farmers across the farm size groups was 43.26 quintals per farm and the highest marketable surplus was with the large farm household that is to the tune of 77.03 quintals per farm. But marketed surplus was higher than marketable surplus for marginal and small farmers.
This implies that marginal and small farmers were compromising with their on farm consumption requirements. The average marketed surplus across the farm size group was 44.38 quintals which was more than marketable surplus. Marketed surplus was lowest with marginal farmers i.e. only 25.92 quintals followed by small (28.85 quintals), medium (48.13 quintals) and large (74.65 quintals) farm households. The average on farm requirement across the farm size group was 15.12 quintals which was highest at large farm households.
58.38 qt and the highest production was achieved by large farmers.
Frequency of Sale
Table 1 reveals that frequency of sale for paddy crop is varying from first Sale to fifth sale, and across the farm size groups, majority of the farmers sold their paddy produce in three lots. These results indicate that most of the farmers i.e. 32.5, 26.25 and 21.22 percent farmers of the study area were selling their farm produce in third, fourth and second slots. This is a good indicator that farmers are taking benefits of price fluctuation at the time of good harvest and storing their farm produce for getting better prices. But on the other hand there were 10 percent farmers who were selling their farm produce in first slot itself, as poor storage capacity.
Table 2 reveals that on overall basis major proportion of paddy was sold in second time of sale, and it was around 26.43 per cent of total marketed surplus. It was observed that the majority of the marginal
and small farmers had sold the major proportion of marketed surplus at first time of sale, while medium and large farmers were opined that they were selling major proportion of marketed surplus of paddy produce at the time of 3th and 2nd sale,
respectively.
Average prices received by different categories of farmers
The average price received by the farmers of all the categories was less than statutory minimum price for wheat and paddy crops. As in earlier tables it was depicted that most of the farmers were selling their farm produce in 2, 3 and 4 slots and few farmers were selling in 1 slot itself. As per the recovered data from farmers of the study area, the average price received by the farmers was less than the minimum prices announced by the Govt. of India at the time of sowing of crops.
Marginal farmers were receiving the lowest prices for their farm produce as, their marketable surplus
0 20 40 60 80 100
Marginal Small Medium Large
Q
ui
nt
al
Total Production
30.55 38.9 66.85 97.25
n RequOn
1 1 1 2 n Farm uirement 11.24 12.08 16.95 20.22
Marketable Surplus
19.31 26.82 49.9 77.03
e Ma
Su 2 2 4 7 arketed urplus 25.92 28.85 48.13 74.65
Fig. 1: Marketed and marketable surplus for paddy crop (qt/farm)
Table 1: Frequency of sale for paddy crop produce by different farm size group (Percent)
Farm size Crop Marginal Small Medium Large Overall Frequency of sale
Paddy 10(2) 15(3) 10(2) 15(3) 12.5(10) 1
10(2) 20(4) 15(3) 40(8) 21.22(17) 2
25(5) 35(7) 50(10) 20(4) 32.5(26) 3
40(8) 25(5) 15(3) 25(5) 26.25(21) 4
15(3) 5(1) 10(2) 0 7.5(6) 5
was also high, so these categories of farmers were always ready to sell their farm produce at proposed prices weather it is high or low, because they are having poor bargaining capacity.
Average Expenditure on Marketing of Farm Produce
The average expenditures incurred on per quintal of paddy was ` 14.62 in the study area. Marginal farmers were at lowest position while medium farmers ranked at the top in case of expenditure incurred in marketing of their paddy produce. Marginal farmers spent ` 10.54 per quintal of paddy while medium farmers spent ` 16.90 for marketing of their paddy produce. It is clear from the data that major part of expenditure was shared by transportation charges and commission charges. As per data the commission charges paid by the farmers on per quintal was ` 4.09, which is very depressing and ridiculous for the farmers as well as administration also. Due to this high rate of commission charges and prevailing activities of middlemen in the marketing channel farmers of the study area were not getting the accrual value
of their farm produce as it is clear from the Fig. 3, depicting the realized value of farm produce. The total expenditure on per quintal bear by the farmers were ranging from ` 10.54 to 14.25, indicates that for selling each quintal of paddy farmers were paying ` 14.62 as the marketing charges.
The expenditure incurred by small farmers was less than other categories of farmers but the actual value realized for the crop produce was higher for large and medium farmers. The overall average actual value realized by the farmers in the study area was
` 839.13 per quintal of paddy produce. As in figure 2 it was cleared that the average received prices for the paddy crop was less that minimum support prices and due to the high per quintal expenditure on marketing and disposing process the farmers were left with only ` 839.13/Qtl, against average received price ` 853.75.
Marketing Area and Agency for Paddy Crop Majority of the farmers across the farm size groups sold their paddy produce to other agencies. Very few farmers had sold their crop produce to Govt. agency. The table reveals that majority of the
7 8 8 9
Price (Rs
Price
(Rs./qt)
750 800 850 900
Margin
./qt) 820
nal Smal
830
ll Mediu
853.5
um Large
5 912
e Overa
853.7 all 75
Fig. 2: Average prices received by different categories of farmers in ` /qt
Table 2: Quantity sold at different times of sale for paddy crop (Qt/farm)
Particulars Farm size group
Crops Marginal Small Medium Large Overall Time of sale
Paddy 6.96(26.8) 7.16(24.81) 8.75(18.17) 21.09(28.18) 10.99(24.76) 1
6.75(26.0) 6.55(22.70) 8.90(18.49) 24.75(33.15) 11.73(26.43) 2
5.75(22.1) 5.92(2.51) 13.07(27.15) 16.83(22.62) 10.4(23.43) 3
3.96(15.2) 4.72(16.36) 10.79(22.41) 11.92(15.96) 7.84(17.66) 4
2.5(9.64) 4.50(15.59) 6.62(13.75) -0- 3.40(7.66) 5
farmers sold their produce to the other agencies, and very small proportion of farmers had opted Govt. agency to sale their paddy produce.
In case of large and medium farmers, 40% and 10% farmers had sold their produce to Govt. agency, respectively. More than 83 per cent of farmers were going to sell their farm produce to private agencies and little 16 percent farmers were adopting Govt. Market paces for disposing off their farm produce. It is very interesting that none of the marginal farmers were selling their produce to Govt. agency, though it is known fact that in India around 70 percent farmers are small and marginal, their share is very high but they are not getting place for marking in Govt. agencies due their small chunk of production. And this may one of the reason that farmers were not getting actual prices of their farm produce in the study area as we have discussed in previous section that farmers were getting less than MSP Price. The percent of farmers who were visiting different places for selling their produce are presented in
the table 8 and it is revealed from the table that around 31.27 per cent of all the farmers went in local market/village market, which implies that majority of the farmers were thinking that local market is better for their crop produce, as per available resources and infrastructural facilities with them. 60 per cent of marginal and 30 percent of small farmers were disposing off their farm produce in Local village market, for avoiding transpiration and commission charges, which were levied on the farmers for transporting their farm produce from field to market yard. Medium and large farmers were taking advantages of primary and secondary market as 50 percent of medium and 70 percent of large farmers were selling their farm produce in primary and secondary market respectively.
Marketing Constraints of Paddy Crop
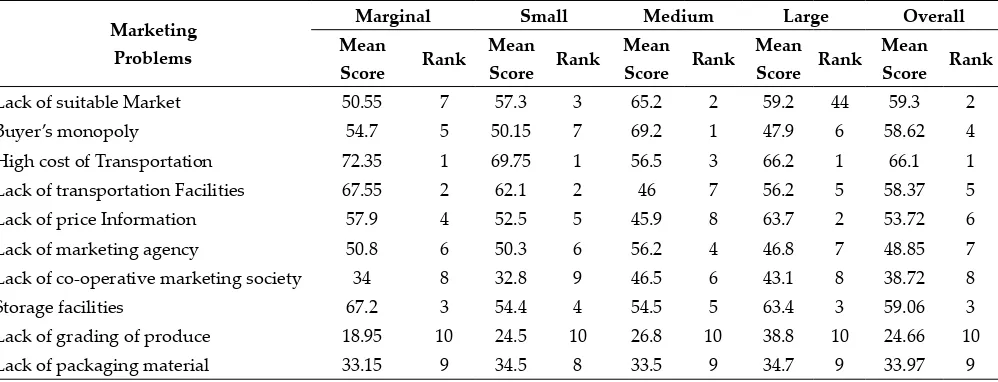
Among the marketing problems, high cost of transportation appeared as the most important problem of sample farmers in the study area on account of which most of the farmers could not sell their product
AActual value of
750 800 850 900
sale (Rs./farm)
Sale in
Rs./farm
Ma rg… ) 809.46
Sm all
813.21 8
Me
di… Lage
838.6 898
ar
e er…Ov
8.25 839.133
Fig 3: Actual value of sale realized by the farmer for crop produce (`/farm)
Table 3: Average expenditure incurred by the farmers in marketing of their crop produce (`/qt)
Particulars Marginal Small Medium Large Overall
Bags & packaging material 2.15 2.25 1.40 1 1.7
Transportation charges 2.50 3.59 5 6 4.27
Loading & unloading charges 2.50 2.50 2.50 2 2.37
Commission charges 3.39 4 4 5 4.09
Weighing charges -0- 2 2 -0- 1
Grading charges -0- 2 2 -0- 1
Other charges -0- 0.45 -0- 0.25 0.35
in the regulated and other such markets where prices were high. In other words, high cost of transportation compelled the farmers to sell their produce through contractor. Lack of suitable market was also quite common which created a sense of feeling among farmers for organizing co-operative marketing society for the proper marketing of their crop produce and secure better prices for all the groups of farmers i.e. marginal, small, medium and large farmers. Lack of proper storage facility was found next most important marketing constraints experienced by the producer sellers. As it is discussed earlier most of the marginal and small farmers were going to sell their farm produce in local village market and to private agencies and the reason for their followed marketing pattern were lack of proper infrastructure and marketing
administration, as farmers were paying high commission charges to middle men. And it is very surprising that now Govt. had banned the middlemen activities from the market yard , but still there are some places where these kind of activities are goingon.
Poor storage facility also compelled the farmers to sell their produce just after harvesting, when there was boom in the market and they were bound to accept low prices. Due to improper facility of transportation farmers sell their produce in village or local market and also forced to accept the prices whatever prevailed in the local market.Inadequate price information system appeared as the next most important marketing problem experienced by the producer sellers in the study area. Poor price information system also caused low price
No. % No. % No. % No. % No. %
Govt. Agency -0- 0- 3 15 2 10 8 40 13 16.25
Others/Private Agency 20 100 17 85 18 90 12 60 67 83.75
Table 5: Distribution of farmers on the basis of different place of sale for paddy crop
Particulars Farm size group
Place of sale Marginal Small Medium Large Overall
No. % No. % No. % No. % No. %
Local market/village market 12 60 6 30 5 25 2 10 35 31.27
Primary market 8 40 7 35 10 50 4 20 29 36.2
Secondary market -0- -0- 7 35 5 25 14 70 26 32.5
Table 5: Marketing constraints faced by different categories of farmers
Marketing Problems
Marginal Small Medium Large Overall
Mean
Score Rank
Mean Score Rank
Mean Score Rank
Mean Score Rank
Mean Score Rank
Lack of suitable Market 50.55 7 57.3 3 65.2 2 59.2 44 59.3 2
Buyer’s monopoly 54.7 5 50.15 7 69.2 1 47.9 6 58.62 4
High cost of Transportation 72.35 1 69.75 1 56.5 3 66.2 1 66.1 1
Lack of transportation Facilities 67.55 2 62.1 2 46 7 56.2 5 58.37 5
Lack of price Information 57.9 4 52.5 5 45.9 8 63.7 2 53.72 6
Lack of marketing agency 50.8 6 50.3 6 56.2 4 46.8 7 48.85 7
Lack of co-operative marketing society 34 8 32.8 9 46.5 6 43.1 8 38.72 8
Storage facilities 67.2 3 54.4 4 54.5 5 63.4 3 59.06 3
Lack of grading of produce 18.95 10 24.5 10 26.8 10 38.8 10 24.66 10
to be accepted by the farmers and exploitation by contractors during the main production season of the crop.The table also reveals that, other marketing problems were of lesser importance in view of farmer’s observations as, lack of marketing agency, lack of co-operative marketing society, lack of grading of produce and lack of packaging material.
ConClUsion
Due to improper infrastructural facilities farmers were forced to sale their crop produce in the local markets at lower prices. There was existence of distress sale on the marginal farms in all crop produces indicating they were forced to sell their crop produce without considering their on farm requirements due to some urgent financial requirement. Distress sale was found at the farm households of marginal and small farms to meet out their financial obligations. So proper financial support by the credit institutions at low interest may enable them to get the benefit of temporal price rise of the crops produce and protect them from distress sale. High cost of transportation opined as the most important problem by the farmers across the farm size groups. Lack of suitable market was also quite common problem which created a sense of feeling among farmers for organizing co-operative marketing society for the proper marketing of produce and to secure better prices for their crop produce. Poor storage facility also compelled the farmers to sell their produce just after harvesting. Monopoly of buyers/contractors was also quite common observation in the study area. Inadequate price information system was also found as an important marketing problem experienced by the producer-sellers in the study area.
The study suggests that farmers can increase their returns by organizing themselves into co-operatives and by improving marketing functions. Possibilities need be explored for linking smallholders to markets through such institutions as cooperatives; growers associations and contract farming that reduce marketing and transaction costs and also alleviate some technological constraints.
REfEREnCEs
Agricultural Statistics at a Glance, Directorate of Economics and Statistics, Department of Agriculture and Cooperation, Government of India, (New Delhi,GoI 2010.)
Acharya, S.S. 1998. Agricultural Marketing in India: Some Facts and Emerging Issues. Indian Journal of Agricultural
Economics, 53(3): 311-329.
Baba, S.H., Wani, M.H., Wani S.A. and Yousuf Shahid. 2010. Marketed surplus and price spread of vegetables in Kashmir valley. Agril. Econ. Res. Rev., 23(10): 115-128. Birthal, Pratap, S. and Jha, Awadesh, K. 2009. Linking Farmers
to Market for High-Value Agricultural Commodities.
Agricultural Economics Research Review, 22(7): 221-229.
Dhaka and Poonia 2010. Identification of constraints encountered by the farmers in production and marketing of vegetables in Bundi district of Rajasthan. Ind. Jour. Agril.
Mktg., 24(1): 20-25.
Garret, H.E. and Woodworth, R.S. 1969. Statistics in Psychology and Education. Vakils, Feffer and Simons Pvt. Ltd., Bombay, pp. 329.
Kumar, A., Singh, M., Suman, M. and Sharma, P. 2009. Constraints faced by farmers and their effect on milk production in rural areas of Jhansi district of Uttar Pradesh. Indian J. Dairy Sci., 62(2): 135-139.
Kaur, H. and Singh, I.P. 2010. Marketing of kinnow in Sri Ganganagar district of Rajasthan state. Ind. Jour. Agril.
Mktg., 24(1): 141-149.
Matungul, P.M., Lyne, M.C. and Ortmann, G.F. 2001. Transaction costs and crop marketing in the communal areas of Impendle and Swayimana, KwaZulu Natal.
Development Southern Africa, 18(3): 347–363.
Naidu, P. 1979. Price Spread and Price Received by Small, Marginal and Big Farmers of Paddy: A Case Study of Tekari Village in Bilaspur District, Madhya Pradesh. India
Journal of Agricultural Economics, 34(4): 206-208.
Patil, A.P., Gawande, S.H., Nande, M.P. and Gobade, M.R. 2009. Constraints faced by the dairy farmers in Nagpur district while adopting animal management practices.
Indian J. VeterinarySci., 2(3): 111-112.
Prasanna, P.A. Lakshmi and Kumar, Sant, 2009. Rice Production in India: Implication of Land Inequity and Market Imperfections. Agricultural Economics Research
Review, 22(9): 115-121.
Randhawa, J.S. 1970. Marketing Costs and Margins of Wheat in Gurdaspur District. Ind. Jour. Agril. Maktg., 16(4): 16-20. Reddy, Ranga, A. 2004.Agricultural Marketing: Stop Cheating
the Farmers. Agricultural Economics Research Review, 21(9): 46-52.
Saraswat S.P., Prem Singh Dahia, and Pratap Singh 2006. Production and marketing of peach fruit: A case study of Rajgarh area of district Sirmour in Himachal Pradesh.
Ind. Jour. Agril. Mktg., 20(2): 81-91.
Statistics in Psychology and Education, Garrett, Henry E. and Woodworth, R.S. Feffer and Simons Publishing House Pvt. Ltd., Bombay, 1971.