B u s i n e s s . E x p e r t J o u r n a l s . c o m
15
Segmentation of Employee Perceptions in Relation to Corporate Social
Responsibility Practices
Alin OPREANA
*Lucian Blaga University of Sibiu
Sustainability is changing the competitive landscape and reshaping the opportunities and threats that companies face. However, for companies to become green they need employees to develop, believe and engage with these initiatives. To achieve success with sustainable practices, companies can use internal marketing which is based on the satisfaction of employees as a premise to achieve the retention and attraction of top talent that will lead to corporate success. It is estimated that the internal customer satisfaction and loyalty contribute to satisfying the external customers, leading ultimately to a company’s profit maximization. In this paper I explore the impact of companies’ sustainability efforts among their employees. More specifically, we examine the results of an online survey conducted on employees of 10 multinational companies regarding the implementation of green internal marketing and corporate social responsibility to enhance their satisfaction at work.
Keywords: internal marketing, employee segmentation, sustainability, green
marketing, corporate social responsibility
1. Introduction
More than ever, sustainability is attracting public attention and debate. The subject is highly important on the legislative agendas of most governments; it is also receiving media coverage by increasing interest for consumers and employees alike. Therefore, for progress and industrial development to comply with the condition of sustainability, organizations need to address issues and challenges at a macro level, such as economic efficiency (innovation, productivity, profitability), social equitability (poverty, community, health, human rights) and environmental responsibility (climate change, land use, biodiversity).
A sustainable corporate behavior has the potential to affect all aspects of a company’s operations and levels of value creation. The involvement of companies in practices aimed at sustainability and corporate social responsibility can have positive impact on internal and external stakeholders as these practices denote the benefits for the financial performance, cost reductions, company image and staff involvement. Particularly employees need to be involved and engaged in such green practices in order to achieve any sustainable strategy of an organization. Internal relations between the organization and employees represent the focusing of internal marketing.
The internal marketing concept argues that a company’s employees represent the first market of any company (Berry, 1981; George and Gronroos 1989; George 1990). Major internal marketing concepts view
*Correspondence:
Alin Opreana, Lucian Blaga University of Sibiu, E-mail address: [email protected] Article History:
Received 20 October 2013 | Accepted 10 November 2013 | Available Online 20 November 2013 Cite Reference:
16
employees as internal customers and jobs as internal products (or ‘job-products’). Moreover, internal marketing has been described as a philosophy for managing the organization’s human resources based on a marketing perspective (George and Gronroos, 1989). Also, in the context of green internal marketing, such practices, and especially corporate social responsibility also humanize the company in ways that other facets of the job-product cannot; it renders the company as a contributing member of the society rather than an entity obsessed with maximizing profits often at all costs.
2. Promoting Internal Marketing Towards Sustainability
Internal marketing is based on the satisfaction of employees as a premise to achieve the retention and attraction of top talent that will lead to corporate success. In the context of sustainability, the most important aspect is the employee engagement.
The need for internal satisfaction of employees, as well as for the recruitment and retention of capable people, encourages organizations to treat employees as customers (Berry, 1981). Thus, it is estimated that the internal customer satisfaction and loyalty contribute to satisfying the external customers, leading ultimately to a company’s profit maximization.
Internal marketing can be considered a management tool for engaging employees in organizational objectives. In the context of this paper, the objectives are related to sustainability and corporate social responsibility, which are closely related to the sustainability agenda of companies and how they can promote internal information, feedback and involvement of employees that can help to achieve green goals.
Companies must have a clear understanding of the positive results of sustainability, psychological impulses of employees on these results and the contingencies that moderate changes in a new company. The new directions to be implemented must be aligned with organizational values and norms for a better promotion and integration of sustainability.
Regarding internal promotion of green marketing, there are studies that discuss the implementation of internal branding techniques, namely ‘employer branding’. Employer branding helps create a specific ideal job that is difficult to imitate by competitors. This could be the source of competitive advantage in resource-based theory. An employer branding campaign aims to present a job offer with tangible and intangible forms of the entire organization, including issues such as company image and identity promoted through internal communication campaigns to support and strengthen the pursuit of sustainability. A green employer branding campaign in the internal environment can be an opportunity to implement change management towards sustainability.
3. Importance of Segmentation in Internal Marketing for Green Initiatives’ Success
External marketing research plays an important role in identifying opportunities and modifications needed to respond in an appropriate manner to consumer behavior changes, by monitoring both prospective and loyal customers. Internal marketing research emphasizes identifying and understanding the capabilities, skills, aspirations, desires and aspirations of employees.
Internal marketing researches are the equivalent to those through which companies monitor customer feedback on products and services. The main purpose of internal marketing research should to provide a segmentation of employees based on their derived and obtained benefits from implementing these green practices in the company where they work. This would imply segmentation based on accrued benefits by identifying demographic and psychographic similarities of employees that will then be targeted with specific sustainability programs.
17
At a company level, the development of internal longitudinal research is possible and can help develop the process of change towards green practices. However, these internal investigations must be handled with care, as employees in general may feel fear for repercussions. Therefore, after recording research results, employees should be informed to establish transparency, fairness and lines of action to be taken following the findings of the research.
After conducting the segmentation process, the internal positioning is aimed at developing a set of actions in the form of the internal marketing mix to create the prerequisites for a change in conditions conducive to sustainability for both the organization and employees. As external positioning, internal positioning is specific to each identified segment. The tactics are directed to various green sustainable programs assigned to different clusters of employees.
The role of positioning is to establish the directions of sustainability in the minds of employees to maximize the potential benefit to the company. For a successful positioning participants, or employees, must be taken into consideration and involved in the co-creation process of the internal value through sustainability. The idea of co-creating value by engaging consumers is well established through marketing practices, assuming various interactions (online or offline, via comments or marketing research) lead to better products and services to maximize consumer experiences. This co-creation can also give yields in internal environment because employees know their needs and are most interested to feel satisfaction at work. Their involvement can help to uncover and fulfill some needs that would otherwise be difficult to identify (Bhattacharya, Sen and Korschun, 2007).
4. Research Methodology
4.1.Research Context
One of the most important contributions of the marketing research is to define the marketing research problem that requires providing solutions. In this regard, the marketing research problem identified with respect to this research is given by a detailed understanding of internal practices in multinational companies as a result of the prioritization of sustainability in the global business environment.
Based on the established marketing research problem, we determined the research purpose that needs addressing information that allows the solving of the marketing research problem. The purpose is to determine green marketing practices of multinational corporations in their internal environment. The next step in marketing research process is to set goals. The targets set are derived from research purpose. For the analysis of sustainable corporate behavior in terms of internal marketing were determined following objectives and hypotheses:
Objective 1: Segmentation of respondents according to certain latent traits. Hypothesis 1: There are at least two segments obtained from survey respondents. Objective 2: Creation of factors based on common characteristics.
Hypothesis 2: At least three factors based on common characteristics will be determined.
4.2.Measurement and Research Instrument
As a research instrument I used a web-based survey that targeted employees. The study used primary data, namely data originated specifically to address the research problem. The measurement items of the survey are newly proposed to study certain employee characteristics in relation to green initiatives. Also, all the measurements used 5-point Likert scales ranging from 1 (Strongly Disagree) to 5 (Strongly Agree).
The psychometric properties of the measures are provided in Table 1.
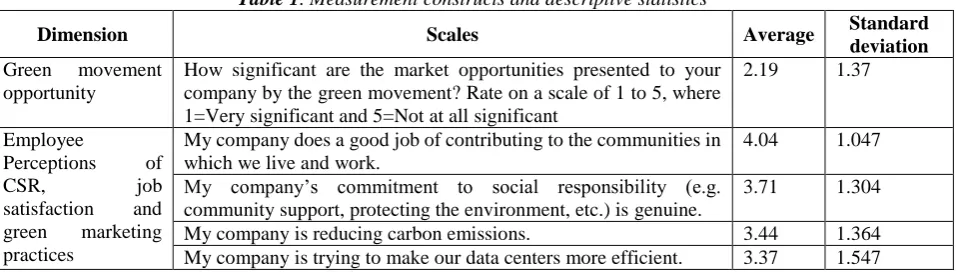
Table 1. Measurement constructs and descriptive statistics
Dimension Scales Average Standard
deviation Green movement
opportunity
How significant are the market opportunities presented to your company by the green movement? Rate on a scale of 1 to 5, where 1=Very significant and 5=Not at all significant
2.19 1.37
Employee
Perceptions of
CSR, job
satisfaction and green marketing practices
My company does a good job of contributing to the communities in which we live and work.
4.04 1.047
My company’s commitment to social responsibility (e.g. community support, protecting the environment, etc.) is genuine.
3.71 1.304
My company is reducing carbon emissions. 3.44 1.364
18
My company’s corporate social responsibility efforts have increased my overall satisfaction with working here.
4.00 1.029
I do feel my company speaks openly and honestly, in terms of internal communication even when the news is bad.
3.38 1.223
I feel I am treated with dignity and respect by my manager. 4.44 0.752 At work, I am encouraged to take green initiatives. 3.75 1.412 I have positive opinions about the degree of flexibility in doing my
job.
3.44 1.514
I feel that my company attracts great talent, people with passion in order to drive success and growth.
4.06 1.074
My company tries to retain top talent by offering competitive compensation.
3.90 1.257
My company tries to retain top talent by providing ongoing development opportunities.
3.85 1.073
My company supports employee volunteering activities. 4.40 0.693 Performance on green initiatives is an element of employee
evaluation.
3.44 0.916
I feel proud to work for my company. 4.35 0.764
Employee volunteering
Employee volunteering is a way to...
Implement corporate business goals 3.62 1.286
Implement community relations 3.83 1.061
Create healthier communities 3.46 1.093
Help employee morale 4.10 0.869
Improve company’s image 4.65 0.556
Improve company’s teamwork 3.98 0.939
Gain personal achievement 4.25 0.622
4.3.Sample and Data Collection
The primary scope of this study is to understand employee behavior in relation to CSR and green marketing practices. The implemented online survey 52 usable questionnaires, as data was attracted using personal connections from the professional social networking site, LinkedIn. Most of the respondents were males (57.7%), and in terms of the country in which they currently live and work, most of them were from United States of America (69.2%). Nonetheless, the research included respondents from Brazil, France, Romania, China, Argentina, United Kingdom, and Ireland. The study contains important information from employees of 10 multinational companies, such as: Amazon.com, Best Buy, The Coca – Cola Company, Facebook (19.2% of all responses), Google (15.4%), General Electric, Microsoft, Procter & Gamble, Starbucks, and Unilever.
5. Empirical Analysis and Results
5.1.Factors explaining the perception of staff on sustainable corporate behavior
In this paper, factor analysis (Factor Analysis) was used to reduce the number of questions’ choices. Factor Analysis is a general linear model (GLM) technique, which means that the data used for interval or proportional scales. Factor analysis has two distinct phases. The first step is to extract a low number of factors from the data. These factors can be interpreted as the attitudes reflected in the answers to those specific questions. There are several methods of extraction, but the method used in this analysis was Principal Components Analysis to determine the minimum number of factors that explain the maximum variation of the observed data. In the second step, the factors are rotated to facilitate interpretation. Varimax rotation is the method most often used in data analysis of questionnaires and was also used in this paper. Varimax rotation is an orthogonal method that tries to minimize the number of variables that have a high ‘weight’ on each factor, thus it leads to a better interpretation and more relevant factors.
Factor analysis was applied to two dimensions (‘Employee perceptions of CSR, job satisfaction and green marketing practices’ and ‘Employee volunteering’) of the research questionnaire (Table2) to summarize the data recorded.
19
internal marketing policy of global companies, in terms of job satisfaction and the companies’ sustainable initiatives.
Initially, a test was conducted to show data adequacy necessary to achieve a relevant factor analysis. Thus, the "Kaiser-Meyer-Olkin Measure of Sampling Adequacy" (KMO) test was used as an index that compares the magnitude of the observed correlation coefficients with the partial correlation coefficients. Small values of KMO indicator show that those pair correlations between variables cannot be explained, and a factor analysis is not appropriate. In general, it is desirable to obtain a value greater than 0.5. For the 15 Likert scales a value of 0.830 was obtained, therefore factor analysis is relevant.
Table 2. Communalities for ‘Employee perceptions of CSR.
job satisfaction and green marketing practices’
Scales of ‘Employee perceptions of CSR. job satisfaction and green marketing practices’ Initial Extractio n 1. My company does a good job of contributing to the communities in which we live and work. 1.000 0.841 2. My company’s commitment to social responsibility (e.g. community support. protecting the
environment. etc.) is genuine.
1.000 0.715
3. My company is reducing carbon emissions. 1.000 0.845
4. My company is trying to make our data centers more efficient. 1.000 0.838 5. My company’s corporate social responsibility efforts have increased my overall satisfaction
with working here.
1.000 0.708
6. I do feel my company speaks openly and honestly. in terms of internal communication even when the news is bad.
1.000 0.718
7. I feel I am treated with dignity and respect by my manager. 1.000 0.805
8. At work. I am encouraged to take green initiatives. 1.000 0.788
9. I have positive opinions about the degree of flexibility in doing my job. 1.000 0.786 10. I feel that my company attracts great talent. people with passion in order to drive success and
growth.
1.000 0.790
11. My company tries to retain top talent by offering competitive compensation. 1.000 0.819 12. My company tries to retain top talent by providing ongoing development opportunities. 1.000 0.811
13. My company supports employee volunteering activities. 1.000 0.717
14. Performance on green initiatives is an element of employee evaluation. 1.000 0.451
15. I feel proud to work for my company. 1.000 0.581
Communality is the proportion of common variation within a variable (Table 2). Thus, this table shows the common variance - communalities - before and after the extraction of factors. Principal components analysis (Principal Component) is based on the initial assumption that all variation is common, therefore, before extraction all factor "communalities" are equal to 1 (column labeled Default). The values in the ‘Extraction column’ represent the extent to which the variance of a variable is common to the variance in the newly created factor. It is noted that all variables included in the composition of new factors are in high proportions, but the variable that refers to the performance of green initiatives as an employee evaluation element (Statement 14, Table2) denotes a common variance of only 45.1% shared with the newly formed factor. 84.5 % of the variance associated with the variable that studies carbon reduction (Statement 3, Table2) is implemented in the new factor that includes this variable.
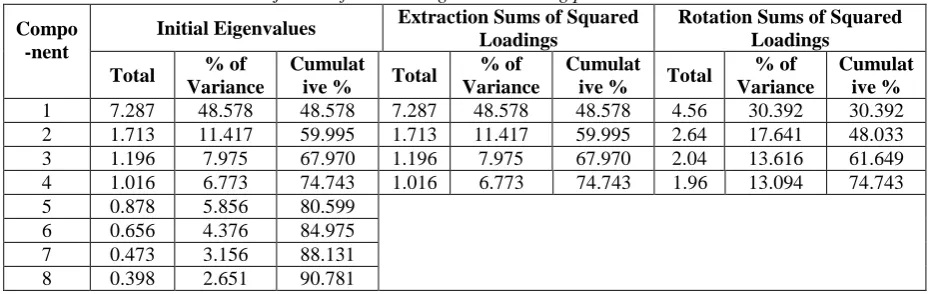
Table 3. Total variance explained for ‘Employee perceptions of CSR.
job satisfaction and green marketing practices’
Compo -nent
Initial Eigenvalues Extraction Sums of Squared Loadings
Rotation Sums of Squared Loadings
Total % of Variance
Cumulat
ive % Total
% of Variance
Cumulat
ive % Total
% of Variance
Cumulat ive % 1 7.287 48.578 48.578 7.287 48.578 48.578 4.56 30.392 30.392 2 1.713 11.417 59.995 1.713 11.417 59.995 2.64 17.641 48.033
3 1.196 7.975 67.970 1.196 7.975 67.970 2.04 13.616 61.649
4 1.016 6.773 74.743 1.016 6.773 74.743 1.96 13.094 74.743
5 0.878 5.856 80.599
6 0.656 4.376 84.975
7 0.473 3.156 88.131
20
9 0.351 2.337 93.118
10 0.333 2.218 95.336
11 0.227 1.514 96.850
12 0.171 1.142 97.992
13 0.118 0.790 98.782
14 0.098 0.655 99.437
15 0.084 0.563 100
Eigenvalues refer to the explained or justified variance. Eigenvalues associated with each factor represent the variation explained by a certain linear component. SPSS displays Eigenvalues and percentage of variance accounted. Table 3 indicates the number of factors selected (in this case , four factors) and the level of variance in each one, before and after rotation.
Before rotation, the first factor explains 48.578 % of the overall variance. But after rotation, (the final part of the table labeled "Rotation Sums of Squared Loadings") the first factor explains 30.392 % of the total variance. Similarly, all four extracted factors explain 74.743 % of the total variance, which represents a satisfactory level for data interpretation. Rotation has the effect of optimizing the factor structure and the immediate consequence of this equivalence is the relative importance of the created factors.
Table 4. Rotated Component Matrix for ‘Employee perceptions of CSR.
job satisfaction and green marketing practices’ Scales of ‘Employee perceptions of CSR. job satisfaction and green marketing practices’
Component
F1 F2 F3 F4
1. My company does a good job of contributing to the communities in which we live and work.
0.105 -0.089
0.052 0.905
2. My company’s commitment to social responsibility (e.g. community support. protecting the environment. etc.) is genuine.
0.148 0.583 0.359 0.473
3. My company is reducing carbon emissions. 0.877 0.002 0.243 0.127
4. My company is trying to make our data centers more efficient. 0.807 0.265 0.313 0.136 5. My company’s corporate social responsibility efforts have increased my
overall satisfaction with working here.
0.216 0.310 0.479 0.580
6. I do feel my company speaks openly and honestly. in terms of internal communication even when the news is bad.
0.185 0.326 0.754 0.090
7. I feel I am treated with dignity and respect by my manager. 0.291 0.844 0.095 -0.013 8. At work. I am encouraged to take green initiatives. 0.752 0.372 0.142 0.254 9. I have positive opinions about the degree of flexibility in doing my job. 0.762 0.407 0.147 0.137 10. I feel that my company attracts great talent. people with passion in order to
drive success and growth.
0.636 0.613 -0.003
0.097
11. My company tries to retain top talent by offering competitive compensation. 0.602 0.651 -0.097
0.156
12. My company tries to retain top talent by providing ongoing development opportunities.
0.858 0.209 0.053 0.171
13. My company supports employee volunteering activities. 0.133 -0.142
0.823 0.033
14. Performance on green initiatives is an element of employee evaluation. 0.347 0.235 -0.281
0.443
15. I feel proud to work for my company. 0.393 0.303 0.369 0.446
Table 4 presents the variables that are most relevant for each of the four formed factors. The first factor is entitled "Sustainable corporate behavior focused on the satisfaction of employees" (F1) because it characterizes employees who are encouraged to take green initiatives and sustainability influenced by activities related to data center efficiency and lower carbon emissions, resulting in job satisfaction in the multinational corporations studied. Also, this factor indicates high scores recorded for aspects of internal marketing to attract and retain the most talented employees that lead to a sense of pride for the company they work for.
21
talent, and retention of employees by competitive rewarding. This factor highlights the respondents who consider their company's sustainable commitment to working honest and genuine.
The third factor is entitled "The direct approach to sustainable corporate behavior" (F3) due to the high score recorded for an internal communication that is open and honest regarding companies’ sustainable practices. In the development of this factor, another variable that had a high proportion in directly addressing sustainable corporate initiatives to support volunteer activities of employees.
The last factor that resulted in this analysis is called "Corporate behavior of employees in community development" (F4). The composition of this factor was due to the involvement of the community in which it operates a variable which garnered a score of 0.905. This involvement led to higher levels of workplace satisfaction, while sustainable practices and corporate social responsibility print pride on employees to work for their company. Moreover, green initiatives represent an evaluation element of employees.
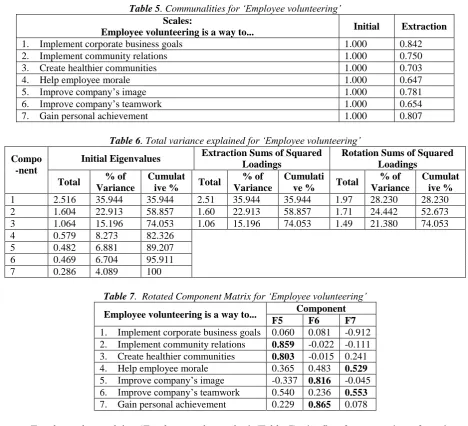
The same procedure was used for the following seven Likert scales studying the perception of employees on volunteering outside the company and work time (Table5). Factor analysis was applied to reduce the number of variants to denote the bases of attitudes and perceptions of employees on volunteering. KMO test result was 0.761; a factor analysis is therefore relevant in this case, as the minimum of 0.5 was surpassed.
Table 5. Communalities for ‘Employee volunteering’
Scales:
Employee volunteering is a way to... Initial Extraction
1. Implement corporate business goals 1.000 0.842
2. Implement community relations 1.000 0.750
3. Create healthier communities 1.000 0.703
4. Help employee morale 1.000 0.647
5. Improve company’s image 1.000 0.781
6. Improve company’s teamwork 1.000 0.654
7. Gain personal achievement 1.000 0.807
Table 6. Total variance explained for ‘Employee volunteering’
Compo -nent
Initial Eigenvalues Extraction Sums of Squared Loadings
Rotation Sums of Squared Loadings
Total % of Variance
Cumulat
ive % Total
% of Variance
Cumulati
ve % Total
% of Variance
Cumulat ive %
1 2.516 35.944 35.944 2.51 35.944 35.944 1.97 28.230 28.230
2 1.604 22.913 58.857 1.60 22.913 58.857 1.71 24.442 52.673
3 1.064 15.196 74.053 1.06 15.196 74.053 1.49 21.380 74.053
4 0.579 8.273 82.326
5 0.482 6.881 89.207
6 0.469 6.704 95.911
7 0.286 4.089 100
Table 7. Rotated Component Matrix for ‘Employee volunteering’
Employee volunteering is a way to... Component
F5 F6 F7
1. Implement corporate business goals 0.060 0.081 -0.912 2. Implement community relations 0.859 -0.022 -0.111 3. Create healthier communities 0.803 -0.015 0.241 4. Help employee morale 0.365 0.483 0.529 5. Improve company’s image -0.337 0.816 -0.045 6. Improve company’s teamwork 0.540 0.236 0.553 7. Gain personal achievement 0.229 0.865 0.078
For the scales studying ‘Employee volunteering’ (Table 7), the first factor consists of employees’ perception about volunteering is called "Supporting the community" (F5). Variables that led to the formation of this factor indicate high scores for voluntary association with helping the communities where employees live and work.
22
also as a means of achieving personal goals and achievements. Therefore, employees are proud of the company they work for, especially because it creates the premises to use volunteering as a way to achieve personal goals. The third factor extracted is designated "Team-building activities" (F7), because in this case the employees perceive volunteering as a way to help sustain the teamwork and morale of employees undergoing sustainable initiatives.
5.2.Segmentation of Employees Based on Their Perception of the Companies Linked to Sustainable Practices
After detecting certain differences between survey respondents highlighted by the factor analyses, cluster analysis is deployed in order to group respondents with similar behavior, as evidenced in this case by employee perceptions and images. Through segmentation a better understanding of the similarities and differences between respondents is possible. The clustering is based on the concept of creating groups based on the proximity or distance. Therefore, a cluster’s respondents are relatively homogeneous. In data analysis, we used the Two-Step Cluster based on log-likelihood distance model, the clustering criterion of Akaike (Akaike Information Criterion).
Thus, the implementation of this procedure resulted three clusters, from using eight variables for segmentation, i.e. the seven newly created factors and a scale that studied the ‘green movement opportunity’ (Table 1) measured by a standardized 5-step semantic differential that denotes employee perception on the importance of market opportunities for their company’s sustainable practices. The quality of clusters is relatively relevant, given the small sample used.
23
Figure 1. The mean and the distribution of the observed values for each segment
5.2.1. Segment 1
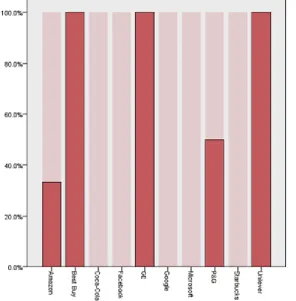
Segment 1 contains 26.9% of all observations of the total sample, including all employees from General Electric, Unilever, Best Buy, but also employees from Procter & Gamble and Amazon.com (Figure2).
Figure 2. Distribution of observations according to the company of employees in Segment 1
The first segment consists of employees who do not perceive volunteering as a team-building opportunity probably because volunteering is not very well promoted in this direction internally, in the companies in which these respondents work. Also, the constituents of this cluster do not consider volunteering practiced by the company as a means of supporting the communities in which they work and live in the present. In conjunction with personal perception of volunteering reflected by F5 - "Supporting the Community", perceptions about the company's activities to support the community (F4 - "Corporate behavior of employees in community development") also has a low score of -0.65. The employees in this segment do not feel supported by their company to bring personal contribution to community development.
They, however, interpret the action of volunteering that leads to sustainability as an opportunity to improve the company's image, which has repercussions on personal fulfillment through image association of the employee with the company's image. The newly formed factor called "Sustainable corporate behavior focused on the satisfaction of employees" received a low score of -0.86 in this cluster analysis, denoting that the employees either do not believe in the sustainable activities of the company they work for, or these initiatives do not have resonance with the respondents of this research, which is why they did not have positive repercussions on their satisfaction at work.
F1: Sustainable corporate behavior focused on the satisfaction of employees F2: Corporate behavior to support the value of employees
F3: The direct approach to sustainable corporate behavior
F4: Corporate behavior of employees in community development F5: Supporting the community
24
Internal marketing practices of these multinational companies seem to have a positive effect on the respondents who participated in this research because employees in this segment do not feel respected or valued by means of retention (and attracting) in their organizations (score -0.78 for F2) .
Moreover, this segment denotes internal miscommunication in terms of openness and honesty about sustainable practices. For the formation of the factor entitled "The direct approach to sustainable corporate behavior" (F3) the variable supporting the company's voluntary activities of employees had a large proportion. Therefore, a low score of -0.42 for F3 explains the low scores related to volunteering.
However, the perception of employees on the importance of market opportunities for sustainable practices, studied by differential semantic ‘through green movement opportunity’(Q8), is positive, as reflected by a score of 0.28. Therefore, the employees of the first segment, who work for companies that make or market products with potential repercussions on the environment, tend to invest and emphasize green practices. Thus, sustainability can be a source of product innovation, while creating a positive green image associated with the company.
From a demographic perspective, segment 1 includes mainly men (56 %) and the predominant age range is between 35 and 39 years. It is noted that the majority of employees are from USA (in 56%), but there are also respondents from China, Brazil and France.
Table 8. Distribution of segment 1 according to the company, gender, country of origin and age
Company Sex Country of origin Age group Percentage of observations
Amazon.com Male USA Between 35 and 39 years old 14%
Best Buy Female USA Between 35 and 39 years old 14%
General Electric Male USA Between 20 and 24 years old 14%
Between 35 and 39 years old 14% Procter &Gamble Male China Between 35 and 39 years old 14%
Unilever Female Brazil Between 20 and 24 years old 14%
Between 30 and 34 years old 7%
France Between 30 and 34 years old 7%
5.2.2. Segment 2
25
Figure 3. Distribution of observations according to the company of employees in Segment 2
These companies that appear in this cluster, create the premises for open internal communication of sustainable practices, and support employees in volunteering. Constituents of segment 1 perceive volunteering more as a team-building opportunity and a way to improve the morale of employees (F7 = 0.45) than as a means for self-association with the company's image and their personal goals (F6 = 0. 37).
Also, employees in this segment perceive volunteering facilitated by the company for which they work as a means of helping and supporting the community in which they work and live (F5 = 1.28). They also feel that their organizations adopt corporate behavior of developing employees in their community that inspires a sense of pride for the company they work for (F4 = 0.94).
Therefore, segment 2 denotes a positive score (F2 = 0.46 ) for the variable that characterizes the perception of employees on their support in the workplace through respect and means of attracting and retaining talented employees, under an honest and authentic commitment for sustainable practices of the company they work for now.
In terms of market opportunity offered by the pursuit of green initiatives, employees in this segment perceive in a positive way such practices, mirrored by a score of 0.59 (Q8- ‘green movement opportunity’). These respondents work for companies that sell products to end customers and in order to bring them to the market, they follow a value chain that can be improved in a positive way by addressing sustainable development in several ways. Thus, employees perceive in a favorable way the idea of developing green products. Also, sustainability opportunities can translate into product innovations that can provide a competitive advantage in the market.
The only negative score (-0.34) recorded for this segment for the variable that studies the satisfaction of employees in relation to sustainable corporate behavior. Thus, given the observed positive scores for the other variables, we can say that the dissatisfaction state of this segment’s employees is not due to sustainable practices and there are other issues that led to this condition.
Table9 below summarizes the demographic characteristics of respondents that formed segment 2. They currently work for companies such as Starbucks, Coca-Cola, Amazon, Procter & Gamble and Microsoft in the USA (63%), Argentina, the UK and Romania. 82% of the employees of the second cluster are aged up to 35 years.
Table9. Distribution of segment 2 according to the company, gender, country of origin and age
Company Sex Country of origin Age group Percentage of observations
Amazon Male USA Between 20 and 24 years old 18%
Coca-Cola Female United Kingdom Between 20 and 24 years old 9%
Romania Between 20 and 24 years old 9%
Microsoft Male USA Between 25 and 29 years old 9%
Procter &Gamble Female Argentina Between 30 and 34 years old 18%
Starbucks Male USA Between 40 and 44 years old 18%
Female USA Between 30 and 34 years old 18%
5.2.3. Segment 3
26
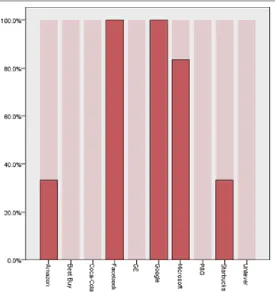
Figure 4. Distribution of observations according to the company of employees in Segment 3
Because of the online activity of these companies, the organizations in this segment streamline their data centers and reduce their carbon emissions to achieve a lower environmental footprint. Employees have a positive perception of these sustainable practices, especially because these organizations encourage green initiatives, offering them workplace flexibility. Also, the companies from this segment are known for the professional development opportunities offered to their employees (especially Facebook and Google). All these aspects lead to the satisfaction of employees in companies that promote sustainability (F1 = 0.58).
Furthermore, segment 3 accumulates employees who appreciate their work because they feel that their value are backed and supported by means of retaining and attracting the best employees, but also through honest involvement in initiatives aimed at sustainability (F2 = 0.22).
Regarding the perception of volunteering, components of segment 3 consider volunteering as a team-building activity that can strengthen the relationship with co-workers. These employees, mainly in IT, working more in teams, which is why volunteering is seen as an extension of the workplace, by practicing sustainability. The other two factors that explain the perspective of employees volunteering recorded low scores. Therefore, they do not perceive volunteering as a means of self-realization (F6 = -0.28) or helping the community (F5 = -0.40) . However, it is possible that the respondents of this research may not have been involved in many volunteering projects supported by their companies. It is also possible that these IT companies (Facebook, Google, Microsoft, Amazon.com) do not internally promote volunteering to thoroughly. This last idea may be supported by the low, though negligible score (F4 = -0.05) of the variable entitled "Corporate behavior in the community development of employees" that studies the perception of employees on the contribution of their organizations in their communities.
Also a score of a negligible importance in describing cluster 3 was recorded for variable that examines the direct approach through open internal communication on sustainable practices (F3=0.06). The formation of factor F3 was due mostly to the variable that studied the supported volunteering activities of employees. Therefore, internal communication on sustainable practices can be improved for this segment. Moreover, low scores recorded for the other variable on volunteering can be explained by the lack of an internal communication of supporting employees on green initiatives.
27
Table 10. Distribution of segment 1 according to the company, gender, country of origin and age
Company Sex Country of origin Age group Percentage of observations
Amazon Male USA Between 25 and 29 years old 7%
Facebook Male Ireland Between 35 and 39 years old 7%
United Kingdom Between 35 and 39 years old 7%
USA Between 25 and 29 years old 7%
Between 30 and 34 years old 7%
Female USA Between 35 and 39 years old 7%
Google Male USA Between 25 and 29 years old 7%
Between 30 and 34 years old 7% Female United Kingdom Between 25 and 29 years old 7%
USA Between 30 and 34 years old 7%
Microsoft Male USA Between 25 and 29 years old 4%
Between 35 and 39 years old 7%
Female USA Between 35 and 39 years old 7%
Starbucks Female USA Between 30 and 34 years old 7%
Table10 presents the demographics that characterize this segment. Thus, 79% of employees are from the USA and 21% in the UK and Ireland. All employees are young respondents in segment 3, 72% of whom are under the age of 35. Also, it can be noted that the number of respondents in this study came from Facebook.
6. Discussion and Conclusion
6.1.Theoretical Contributions
Regarding the theoretical contributions, the present research sought to explore the perceptions of employees from companies like Amazon, Facebook, Google, Microsoft, Starbucks, Best Buy, Coca-Cola, General Electric, Procter & Gamble and Unilever, on sustainable practices and employee commitment in such programs. To achieve these goals, we have developed a primary research, implemented by means of an online questionnaire that was used to obtain information from employees of the companies mentioned above. The first objective of the research was to obtain segments of employees according to their perception of companies linked to sustainable practices. Thus, we obtained three clusters of employees.
Creating a work environment where employees have the power of decision and accountability can be an essential aspect in increasing the satisfaction of employees, in general and for implementing internal sustainability programs, in particular. In this context, sustainability can provide a level of motivation and commitment from the staff, which would ultimately lead to satisfaction and loyalty to the organization.
However, for successful implementation of green practices, multinational corporations must establish the foundation for these initiatives internally, by using internal marketing. The logic of internal marketing refers to the fact that when the needs of internal customers are satisfied, the organization will find itself in a better position to deliver the quality required to meet the needs of external customers.
Tracking programs that consider sustainability and corporate social responsibility have a positive impact on the internal environment, especially when developing marketing strategies for the internal and external environment in terms becoming more attractive to consumers. Companies that show commitment to such programs can attract, motivate, and retain employees easily, and this contributes to the overall company performance. Therefore, organizations should incorporate such programs and policies in strategic areas of the business, creating conditions for employees that provide them with the opportunities to actively participate in positive environmental and social change.
Overall, it is noted that to establish the main objective of internal marketing, namely the satisfaction of employees, organizations must implement sustainability strategies that have internal resonance for employees.
28
6.2.Implications for Managers
As organizations confront the barriers to pursue and achieve sustainability, many managers find it difficult to understand where their companies are, where they need to go and how to get there. However, companies all around the world share a consensus view that sustainability will have an increasingly large impact on the business landscape going forward.
Nonetheless, companies do face challenges and implementing risks in relation to sustainability. A key challenge is the effective deployment of CSR as an internal marketing strategic tool is the lack of connection between such initiatives and a company’s employees. An employee’s proximity to CSR is program-specific and spans a continuum: from complete unawareness, at one end, to direct involvement at the other. Thus, managers should conduct appropriate programs in relation to identified segments.
Given the challenges that sustainability in general has, and more importantly in implementation practices, in order to succeed, managers should (1) bring their employees closer to the company’s CSR and green marketing initiatives, (2) use a contingent input-output approach to formulate, evaluate and manage CSR-related outcomes, (3) understand and fulfill employee needs related to CSR, (4) focus on strengthening employee identification with the company, and (5) engage employees in co-creating green sustainable value. This study’s findings, and others related to sustainability, denote that it is essential is that companies start to consider more broadly and proactively this concept and its potential impact on their business and industry, and begin to plan and act accordingly.
6.3.Limitations and Future Directions
This research must also be interpreted in the context of its limitations. The research goals were met, but this study should be extended to gather more information from other companies in other industries to have a clear and comparative perspective regarding the internal marketing practices in promoting sustainability in various sectors. Given the data collection method used, through the personal connections from LinkedIn, the research has a rather restrictive generalizability. While the representativeness of the sample can always be improved, for this research special efforts were made to have high response rates and for the sample to be reflective of the target population.
Also, this study did not include several control variables or mediator variables such as work experience, work environment conditions to observe other dimensions that could lead to a better understanding of the relationships proposed in this paper.
In conclusion, this study provides various new ways to improve the assessment and to add the other important variables, and thus expand the future research in this direction of observing the drivers of employee engagement in a company pursuing green marketing tactics.
7. References
Ahmed P. K. and Rafiq M., 2002. Internal Marketing – Tools and concepts for customer-focused management.
Oxford: Butterworth-Heinemann Publications
Berry, L.L., 1981. The Employee as Consumer. Journal of Retail Banking, Vol. 3, pp. 33--40
Bhattacharya C.B., Sen S. and Korschun D., 2007. Corporate social responsibility as an internal marketing strategy. Sloan Management Review, Fall
Bhattacharya C.B., Sen S. and Korschun D., 2008. Using Corporate Social Responsibility to Win the War for Talent.Sloan Management Review
Bhattacharya, C. B., and Sen, S., 2003. Consumer -company identification: A framework for understanding consumers' relationship with companies. Journal of Marketing, 67(2), pp.76--88
Field, A. 2005. Discovering statistics using SPSS. London: Sage Publications.
George, W. R., and Gronroos, C., 1989. Developing Customer-Conscious Employees At Every Level-Internal Marketing. In: C.A. Congram and M.L. Friedman. Handbook of Services Marketing. New York: AMACOM
George, W.R., 1990, Internal Marketing and Organizational Behavior. Journal of Business Research, Vol. 20, pp.63--70.
Malhotra, N.K. and Birks, D.F. 2009. Marketing Research – An Applied Approach (3rd Edition). Essex: Pearson Education-Prentice Hall