© 2017 Electronic Journal of Science Education (Southwestern University/Texas Christian University) Retrieved from http://ejse.southwestern.edu
Measuring elementary teachers’ understanding of the NGSS framework: An instrument for planning and assessing professional development
Gustave E. Nollmeyer
Eastern Washington University, USA
Arthur W. Bangert
Montana State University, USA
Abstract
The arrival of the Next Generation Science Standards (NGSS) marks a new era in science education. However, like all education reform, the success of NGSS implementation lies with teachers. Effective and targeted professional development will play a key role in preparing teachers who work from the framework. This study sought to design and validate a survey instrument measuring elementary teachers’ perceived understanding of the NGSS framework. After developing and modifying the initial item pool through expert review and piloting, the instrument was administered to 167 elementary teachers from Montana, Utah, Idaho, and Wyoming. Results from an exploratory principal components analysis yielded a five-factor model which explained 74% of the variance. Through Confirmatory Factor Analysis, the five-factor model was found to be an acceptable fit to the hypothesized population model. The 31-item instrument holds promise as a tool for informing professional development efforts related to teachers’ understanding of NGSS concepts. It could be used as part of a needs assessment when planning for professional development. Whether part of a needs assessment or a smaller scale effort, the instrument could be used to identify areas for targeted growth in understanding of NGSS concepts.
Key words: Next Generation Science Standards, Science Education, Professional Development, Instrument Development
Please address all correspondence to:Gustave E. Nollmeyer; Assistant Professor of Education, [email protected], 316D Williamson Hall, Cheney, WA 99004
Introduction
The Next Generation Science Standards: For States, By States (NGSS) were published in 2013 marking the completion of multi-year effort in reforming policy for the future of science education. Now, the task of NGSS implementation has been left to educators, curriculum leaders, school districts, professional developers, and teacher preparation programs. As states adopt and consider adopting the NGSS in the coming years, critical questions must be answered. Will educators be ready to implement the new standards? How will we know when teachers are successful in creating science education experiences that authentically align with NGSS expectations?
Electronic Journal of Science Education ejse.southwestern.edu massive scale (Bybee, 2006). Yet, the National Research Council (NRC) (2007) considered the results from the first round of science standards—the National Science Education Standards of 1996—unimpressive. Bybee (1993) warned of such disappointment, “The rhetoric and the reality of reform do not conform. If we do not confront this issue, the contemporary reform will be recorded only as one of reports and recommendations, with no response” (p. 170). Policy reforms alone have little ultimate impact in the quality of science education. They are an essential element but must be coupled with targeted, effective training so that teacher practice is best practice.
Adding to this particular challenge is the reality that transition to the NGSS framework will require a paradigm shift for most teachers (NRC, 2012). It is expected that the amount of professional development (PD) needed to facilitate the change will be extensive (Wilson, 2013). Therefore, accurate planning in PD efforts will be critical. Research by van Driel, Beijaard & Verloop (2001) suggests that past reform efforts have often been unsuccessful because of the failure to take into account teachers’ existing knowledge, beliefs and attitudes. Therefore, effective PD within the context of the NGSS will require an assessment of current teacher understanding of the NGSS framework.
The purpose of this study was to identify key constructs of the NGSS framework and develop an instrument, the New Framework of Science Education Survey of Teacher Understanding (NFSE-STU), to measure inservice elementary teachers’ perceived understanding of that framework. Two questions guided the research: (1) What constructs define the NGSS framework? (2) What are the underlying dimensions of NFSE-STU items written to perceptually assess elementary teachers’ understanding of the NGSS framework? A validated instrument measuring inservice elementary teachers’ perceived understanding would benefit a number of stakeholders by helping to identify teachers’ needs in a successful transition to the NGSS.
Literature Review
A New Framework for Science Education
The NGSS represent much more than an updated and repackaged set of science standards. They are the product of a paradigm shift and have been established upon the scaffolding of a new framework having three distinct but integrated structural dimensions: Scientific and Engineering Practices, Crosscutting Concepts, and Disciplinary Core Ideas (NRC, 2012). These three dimensions served as the backbone for the NRC’s (2012) critical report, A Framework for K-12 Science Education: Practices, Crosscutting Concepts, and Core Ideas. The NGSS Lead States (2013) worked with fidelity from the framework document so that each of the guiding principles and structural components were evident throughout the NGSS both in content and design.
Electronic Journal of Science Education ejse.southwestern.edu The Disciplinary Core Ideas of the NGSS framework drastically cut the volume of content for students to learn—trading breadth for depth (NRC, 2012). These core ideas become mental structures upon which students can build increasingly complex ideas (Michaels et al., 2008; NRC, 2007) and push student understanding beyond factual knowledge and memorization of terms to more conceptual questions of how and why (Pruitt, 2014).
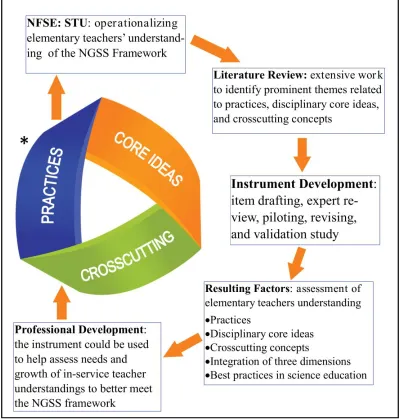
The three dimensions individually share similarities to previous standards; however, the integration of these dimensions in the NGSS framework represents an epistemological shift (Krajcik, Codere, Dahsah, Bayer, & Mun, 2014) leading the NRC (2014) to coin the phrase “three-dimensional learning.” This integrative perspective is critical to the NGSS framework (NGSS Lead States, 2013). In fact, the integration of the dimensions is the feature they chose as the face of the standards (see Figure 1). While it has long been understood that content learning is enhanced by engaging in inquiry (Krajcik et al., 2014), recent research has begun to demonstrate the importance of the other direction. Content, it appears, is equally important in students’ learning about the practices of science (NRC, 2007, 2012). Because the crosscutting concepts naturally apply across the disciplines, they bring a level of coherence to content (NGSS Lead States, 2013) further supporting student learning (Pratt, 2014). For these reasons, the NRC (2012) called for the three dimensions to be “woven together in standards, curricula, instruction, and assessments” (pp. 29-30). The NGSS Lead States (2013) responded to this expectation by crafting Performance Expectations (PEs) comprised of elements from each of the three dimensions. With the PEs requiring students to demonstrate mastery of content, practices, and concepts in an integrated fashion, success can only be expected if teachers are ready to teach for three-dimensional learning. Effective professional development (PD) will be critical in preparing teachers for the paradigm shift.
Conceptual Framework
The NGSS framework naturally served as the conceptual framework guiding the theoretical foundation of this study. This framework evolved over a ten year period as public school teachers, teacher educators, scientists and other stakeholders from the science education community discussed the important overarching concepts that are essential for next generation science education (NRC, 2012). Figure 1 depicts the relationship between the NGSS framework and the development of an instrument designed to assess elementary teachers’ perceived understanding of the framework’s vision of three-dimensional learning. It is critical that elementary teachers’ understand how these dimensions interact if they are to teach science lessons that meet the expectations of the NGSS framework, but this integration is probably the most challenging shift presented by the NGSS (Bybee, 2014).
Electronic Journal of Science Education ejse.southwestern.edu Figure 1. The conceptual framework for the NGSS from the (NGSS Lead States, 2016) and how our scale development process flowed from it.
*The NGSS logo is a trademark of Achieve. Neither Achieve nor the lead states and partners that developed the Next Generation Science Standards were inolved in the production of this product, and do not endorse it.
Professional Development
Electronic Journal of Science Education ejse.southwestern.edu documented a vast gap between current practice and the strategies promoted by the NGSS (Roth, 2014). Therefore, success in implementing the NGSS framework, as with all major educational reform, will require extensive and effective PD (Birman, Desimone, Porter, & Garet, 2000; Wilson, 2013).
Marked growth in teaching practice is associated with effective PD (Phillips, Desimone, & Smith, 2011) because it is the avenue for strengthening both content and pedagogical knowledge (Desimone, Porter, Garet, Yoon, & Birman, 2002; Whitworth & Chiu, 2015). Effective PD also builds teacher capacity for developing higher order and critical thinking in students (Hochberg & Desimone, 2010) which aligns with the NGSS framework’s goal to promote understanding over knowing (NRC, 2012).
Historically, PD available to teachers has generally been of poor quality and has not always resulted in effective training (Borko, 2004). Most trainings do not meet standards of high-quality (Desimone et al., 2002), but rather, tend to emphasize surface level knowledge and present it ineffectively anyway (Ball & Cohen, 1999). It is no wonder then that Wei et al. (2009) found that only about half of teachers reported PD trainings as useful.
Effective PD efforts tend to be those of high-quality (Desimone et al., 2002). Fortunately, solid research identifying keys for effective PD has been conducted during the last couple decades. While a full review of these concepts is beyond the scope of this article, we would point interested readers to the critical works by Garet et al. (2001; 2007), Guskey (2000), and Loucks-Horsley et al. (2010). Yet, several characteristics of effective PD relate to the use of valid and reliable survey instruments: the essential quality of coherence (Garet et al., 2001), the value in incremental change, and the strategic use of needs assessments (Guskey, 2000).
While Garet et al. (2001) used the term coherence, the same idea was represented in Loucks-Horsley et al.’s (2010) call for connecting PD to the broader educational system and Guskey’s (2000) emphasis of both individual and organizational change. For science education, Wilson (2013) pointed out the role local school policy plays in coherence. In their document about implementing the NGSS, the NRC (2015) stated the need for coherence throughout the educational system including in PD. Trainings that provide coherence for teachers are aligned with standards and assessments (Birman et al., 2000; Garet et al., 2001), place an emphasis on prior understandings (van Driel et al., 2001) so that they grow out of what teachers already know (Garet et al., 2001), and match teachers’ goals for both their own and their students’ development (Penuel et al., 2007). These elements of coherence enhance the role of the teacher which is relatively new in PD for science educators (Nichols & Koballa, 2013). These changes bring welcome change as researchers have determined science teacher knowledge is intertwined with teaching experiences and contexts (Luft & Hewson, 2014; Nichols & Koballa, 2013). Requiring such an active and personal role on the part of the teacher is now highly recommended for PD in science education (Wilson, 2013).
Electronic Journal of Science Education ejse.southwestern.edu to produce effective change (Hochberg & Desimone, 2010) and build consistency among teachers (Desimone et al., 2002). This is particularly useful in science education when “high-leverage” practices are the ones targeted for PD (Roth, 2014). One way for such incremental changes to build with coherence is through communities of practice (CoP) (Loughran, 2014). Instead of a short inservice workshop approach to training, a CoP expects a long-term commitment and involvement of members. This allows for evolution and growth based on needs and shared experiences (Shih-Hsien, 2009). For science educators, incremental change using the CoP model has been documented. For example, Akerson, Cullen, and Hanson (2009) found that the environment of long-term participation naturally promoted growth and change.
Carefully crafted needs assessments are vital in planning for targeted PD (Guskey & Sparks, 1991), but they must be meaningful and reliable for the results to truly be helpful (Guskey & Yoon, 2009). Critically, survey instruments used to establish needs should focus on symptoms or problem areas. This means that prompts should address actual strategies and practices instead of proposing topics or activities for PD (Guskey, 2000).
The Role of a Tool for Measuring Perceived Understandings
While survey instruments have many limitations, they can provide speedy, cost-effective information for developing PD learning goals (Desimone, 2011). The versatility of these instruments in providing data before, during, or after trainings make them a very attractive option (Guskey, 2000) and are used regularly—in concert with other tools—in science teacher PD (i. e. Akerson et al., 2009; Lee & Maerten-Rivera, 2012; Pecore, Kirchgessner, & Carruth, 2013; Phillips et al., 2011; Supovitz & Turner, 2000). Desimone (2011) suggests that many of the complaints about self-reported survey instrument are mediated by using valid and reliable tools. A validated instrument measuring elementary teachers’ perceived understanding of the NGSS framework could assist in both planning and assessing effective PD. The use of survey instruments and questionnaires, both validated and newly developed, is well documented in science education PD (van Driel, Berry, & Meirink, 2014). Unfortunately, the instruments currently available measure science inquiry through the lens of outdated policy (Hayes, Lee, DiStefano, O'Connor, & Seitz, 2016). Our review found that the Hayes et al. instrument is currently the only other tool validated for the NGSS. As their survey instrument was tested with 4th to 12th grade science
teachers, we propose that the NFSE-STU, designed for the K-5th grade general classroom teacher, fits a remaining need. Since the NFSE-STU was constructed based upon the NGSS framework, it could help to identify gaps in elementary teachers’ understanding of NGSS concepts.
Methods
Electronic Journal of Science Education ejse.southwestern.edu States, by States (NGSS Lead States, 2013). A pool of draft items, for the initial survey instrument, were written to measure the NGSS constructs identified in the science education literature. These draft items were reviewed by experts in the field who made suggestions for improving their relevancy, clarity and conciseness (DeVellis, 2012). Revised items were further refined through pilot testing. Then, the instrument was used in a validation study with data undergoing exploratory analysis and confirmatory factor analysis, as well as internal consistency testing. From these analyses, a final validated instrument was produced.
Designing the Instrument
Developing an instrument to measure elementary teachers’ perceptions of their understanding of the NGSS framework required the identification of themes associated with the successful implementation of that framework. These themes were identified through a review of relevant literature. Careful consideration was given to the two key NRC (2012; 2007) reports which served to lay the groundwork for the NGSS. These reports synthesize much of the science literature informing to the NGSS framework. Through this process six common themes were identified. (1) Science and Engineering Practices; (2) Crosscutting Concepts; (3) Disciplinary Core Ideas; (4) Integration of the Three Dimensions; (5) Best Practices in Science Education; and (6) Connections to Common Core. Table 1 shows deeper connections these six themes have to the science education literature.
The first three themes came directly from the framework for the NGSS. The Science and Engineering Practices replace the antiquated term, “inquiry.” However, they are more than that. The Practices more accurately express what scientists actually do (Michaels et al., 2008). It is not surprising then, that elements of the Practices are found in all four of the NRC’s (2007) strands of scientific proficiency: know and interpret explanations, generate and evaluate evidence, understand the nature of knowledge, and participate in practice. The Crosscutting Concepts act as a bridge between the disciplines and have value in explaining phenomena across the disciplines. Therefore, they act as mental frameworks for the organization of knowledge (NRC, 2012). Since they transcend disciplinary bounds, they contribute heavily to the process of theory development (American Association for the Advancement of Science, 1990). The Disciplinary Core Ideas represent the science content in the NGSS. Identifying the science knowledge that was truly “core” was essential since the need to trim the amount of standards has been well documented (i.e. Bybee, 2006; Coleman & Zimba, 2008; NRC, 2007; Sneider & Workosky, 2009). This process resulted in reducing the sheer amount of content by about 40% (NRC, 2012).
Electronic Journal of Science Education ejse.southwestern.edu involved in the practices and discourse of science (NRC, 2007), and using a variety of both student-directed and teacher-student-directed strategies (NRC, 2012). The final theme for the NGSS framework was Connections to Common Core. The Science and Engineering Practices found in the NGSS require the seamless integration of the skill disciplines. Students are expected to use mathematics and computational thinking as they create, organize, and interpret data. In order to engage in argument or simply communicate findings, students’ speaking and writing skills need to be fully developed (NRC, 2012).
Table 1. Aligning Six Identified Themes to Literature
Themes Literature Sources
Science and Engineering Practices (Collins, Brown, & Newman, 1989) (Crawford, Krajcik, & Marx, 1999) (Metz, 2004)
(Michaels et al., 2008) (Nersessian, 2005)
Crosscutting Concepts (American Association for the Advancement of
Science, 1990)
(College Board, 2009)
(National Research Council, 1996)
Disciplinary Core Ideas (Bybee, 2006)
(NRC, 1999)
(Smith, Wiser, Anderson, & Krajcik, 2006)
Integration of the Three Dimensions (Krajcik et al., 2014) (Metz, 2004)
(NGSS Lead States, 2013) (NGSS Lead States, 2016) (NRC, 2015)
Best Practices in Science Education (Akerson & Donnelly, 2010) (Archer et al., 2010)
(McNeill & Krajcik, 2008) (Varelas et al., 2008)
Connections to Common Core (NGSS Lead States, 2013)
(National Governors Association Center for Best Practices, 2010)
(NRC, 2007)
Electronic Journal of Science Education ejse.southwestern.edu and began with the phrase, “When planning and teaching, educators . . . .” This wording was intended to emphasize the decisions and behaviors of educators who teach from the NGSS framework with mastery. Instead of asking the participants to compare their own practice to this standard, they were asked to rate their understanding for implementing the idea.
NFSE-STU Development
The draft items were reviewed by a group of five expert panelists. Several factors were considered in identifying these experts. Two key characteristics needed to be true for all panelists. First, they needed to possess a high level of expertise in the new NGSS framework as presented in the NRC’s (2012) report. Second, experts needed to have a rich background in science education. After satisfying the initial requirements, diversity in the panel was considered. It was advantageous to have varying perspectives on elementary science instruction as well as varying perspectives on the framework. The following characteristics were considered: regional and national experience, elementary and secondary science instruction, involvement in professional development and higher education, and involvement in regional or national organizations. The five experts invited to participate brought rich diversity to the panel and provided a comprehensive perspective. These experts were asked to review and rate items by: (1) evaluating the relevance of the items to constructs, (2) determining the items’ clarity and conciseness, and (3) identifying missing aspects of constructs (DeVellis, 2012). The expert review process provided evidence for modifications, eliminations, and additions to the item pool, and from it the pilot draft of the instrument was established.
Following expert review, further item revisions were made by piloting the instrument with thirteen K-12 science teachers. These educators completed the survey instrument online in the same manner as the validation study participants. However, at the end of each section, they were asked to provide feedback regarding the relevancy, clarity, and conciseness of the draft items.
Participants
Upon completion of pilot testing, final instrument edits were made prior to online distribution to elementary teachers via SurveyGizmo (2014). The neighboring states of Montana, Wyoming, Utah, and Idaho (located in the Northwestern part of the United States) were invited to participate in the study. While all regional states were considered, these four were identified based on similarities in political push-back to the NGSS adoption. Three states had officially put NGSS adoption plans on hold, but all were continuing to conduct PD in preparation for future consideration of the standards.
Email lists for contacting elementary teachers in each of these states were not available; therefore, it was necessary to solicit the help of state-level policy makers to distribute the survey instrument link to elementary teachers in their respective states. Thus, our sample is a convenience sample and not intended to represent the demographic characteristics of the teachers in these states. As with any instrument development research, new instruments need to undergo thorough testing with other multiple groups to collect validity evidence for their interpretation and utility (AERA, 2014). This research provides the first evidence for the instrument.
Validating the Instrument
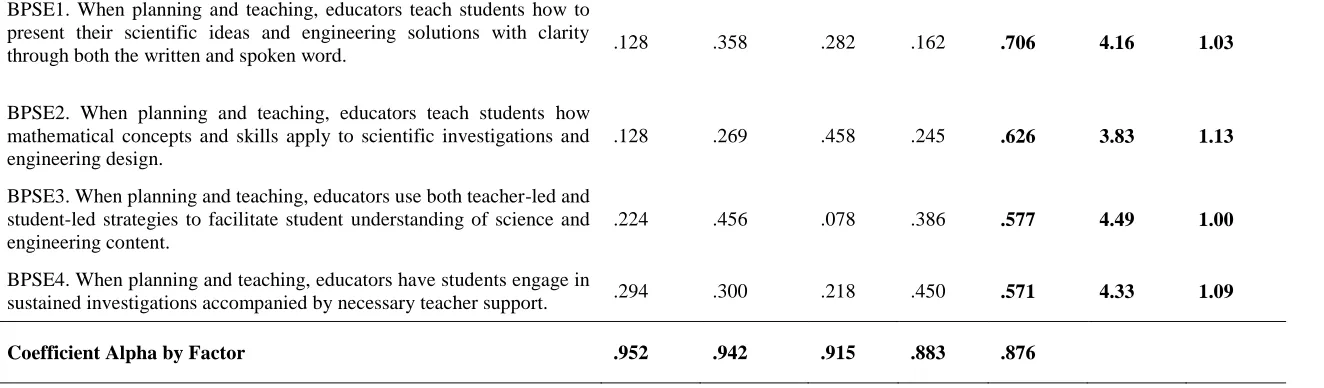
Electronic Journal of Science Education ejse.southwestern.edu elementary teachers’ perceptual understanding of the NGSS framework. PCA was used to determine if items formed factors written to assess the constructs identified by themes from the science education literature, and CFA was used to establish the goodness of model fit for the hypothesized factor model produced by the exploratory analysis (Netemeyer et al., 2003). Cronbach’s coefficient alpha (1951) was calculated as a measure of the internal consistency reliability of the instrument (DeVellis, 2012).
Results
Descriptive Statistics
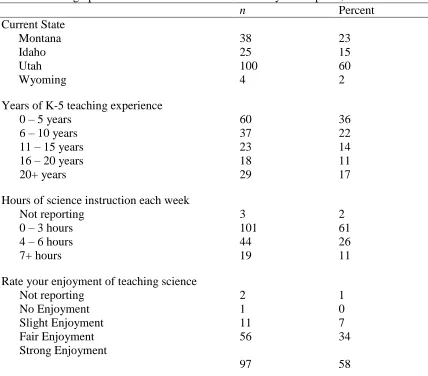
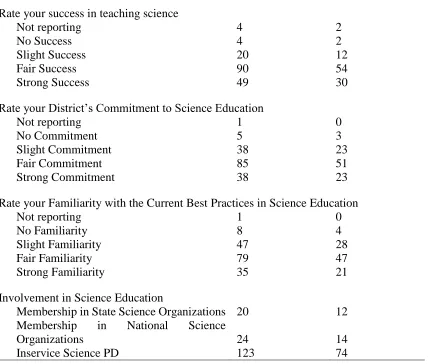
Table 2 displays demographic characteristics of the educators who participated in the validation study. More than half of the participants were currently teaching in Utah, about one-fourth in Montana, and slightly less than that in Idaho. Very few K-5 teachers from Wyoming participated in the study. While most teachers (61%) reported teaching less than four hours of science a week, 92% reported fair or strong enjoyment of the science content taught. These positive perceptions help to explain why nearly 75% of the teachers surveyed felt successful in their science teaching efforts. The majority of teachers (84%) felt they had a fair to strong understanding of current best practices for teaching elementary science concepts.
Table 2. Demographic Characteristics of Validation Study Participants, N = 167
n Percent
Current State
Montana 38 23
Idaho 25 15
Utah 100 60
Wyoming 4 2
Years of K-5 teaching experience
0 – 5 years 60 36
6 – 10 years 37 22
11 – 15 years 23 14
16 – 20 years 18 11
20+ years 29 17
Hours of science instruction each week
Not reporting 3 2
0 – 3 hours 101 61
4 – 6 hours 44 26
7+ hours 19 11
Rate your enjoyment of teaching science
Not reporting 2 1
No Enjoyment 1 0
Slight Enjoyment 11 7
Fair Enjoyment 56 34
Strong Enjoyment
Electronic Journal of Science Education ejse.southwestern.edu Table 2 (continued)
Rate your success in teaching science
Not reporting 4 2
No Success 4 2
Slight Success 20 12
Fair Success 90 54
Strong Success 49 30
Rate your District’s Commitment to Science Education
Not reporting 1 0
No Commitment 5 3
Slight Commitment 38 23
Fair Commitment 85 51
Strong Commitment 38 23
Rate your Familiarity with the Current Best Practices in Science Education
Not reporting 1 0
No Familiarity 8 4
Slight Familiarity 47 28
Fair Familiarity 79 47
Strong Familiarity 35 21
Involvement in Science Education
Membership in State Science Organizations 20 12
Membership in National Science
Organizations 24 14
Inservice Science PD 123 74
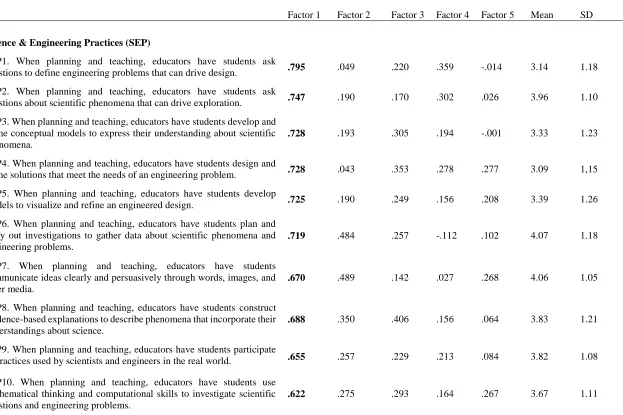
Descriptive analysis was conducted to determine the normality of the survey instrument data prior to the exploratory PCA. Means and standard deviations for each instrument item are presented in Table 3. West, Finch, and Curran (1995) recommend that values for skewedness should be less than 2 while kurtosis values should be less than 7 when attempting exploratory analysis. The skewedness and kurtosis for each item was calculated. Most were found to be well under the suggested thresholds (West et al., 1995). While four individual items were skewed beyond the threshold, no items departed from normal “peakness.” And the symmetry of the whole construct (skew = .061, SE = .188) and “peakness” (kurtosis = -.185, SE = .374) did not depart significantly from normality (W = .992, p = .521).
Exploratory Analysis
Electronic Journal of Science Education ejse.southwestern.edu determining convergence and stability of the factor solution. According to results from MacCallum et al’s (1999) research, stable recovery of factors is likely to occur with sample sizes as low as 60 when items’ communalities are above .500. The communalities for all items in this analysis were greater than .600.
As recommended for scale development, exploratory analysis procedures using PCA were conducted with the first random subsample (n = 83) of inservice teacher responses. The resulting correlation matrix was evaluated for multicollinearity, and items exhibiting extremely high correlations were removed. Items 4, 8, 16, and 36 were removed as they correlated with at least one other item higher than the suggest threshold of .80 (Field, 2013). With these items removed, the factorability of the correlation matrix, Kaiser-Meyer-Olkin Measure of Sampling Adequacy and Bartlett’s Test of Sphericity indicated that the data were appropriate for the analysis to proceed.
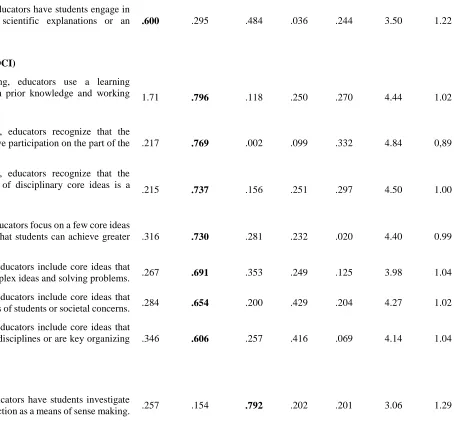
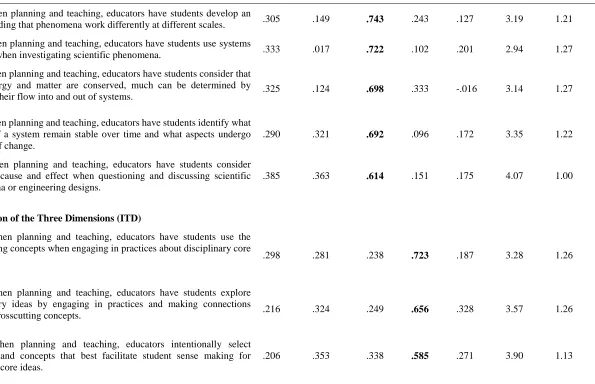
Electronic Journal of Science Education ejse.southwestern.edu Table 3. Rotated Factor Structure for the NFSE-STU
Factor 1 Factor 2 Factor 3 Factor 4 Factor 5 Mean SD
Science & Engineering Practices (SEP)
SEP1. When planning and teaching, educators have students ask
questions to define engineering problems that can drive design. .795 .049 .220 .359 -.014 3.14 1.18
SEP2. When planning and teaching, educators have students ask
questions about scientific phenomena that can drive exploration. .747 .190 .170 .302 .026 3.96 1.10
SEP3. When planning and teaching, educators have students develop and refine conceptual models to express their understanding about scientific phenomena.
.728 .193 .305 .194 -.001 3.33 1.23
SEP4. When planning and teaching, educators have students design and
refine solutions that meet the needs of an engineering problem. .728 .043 .353 .278 .277 3.09 1,15
SEP5. When planning and teaching, educators have students develop
models to visualize and refine an engineered design. .725 .190 .249 .156 .208 3.39 1.26
SEP6. When planning and teaching, educators have students plan and carry out investigations to gather data about scientific phenomena and engineering problems.
.719 .484 .257 -.112 .102 4.07 1.18
SEP7. When planning and teaching, educators have students communicate ideas clearly and persuasively through words, images, and other media.
.670 .489 .142 .027 .268 4.06 1.05
SEP8. When planning and teaching, educators have students construct evidence-based explanations to describe phenomena that incorporate their understandings about science.
.688 .350 .406 .156 .064 3.83 1.21
SEP9. When planning and teaching, educators have students participate
in practices used by scientists and engineers in the real world. .655 .257 .229 .213 .084 3.82 1.08
SEP10. When planning and teaching, educators have students use mathematical thinking and computational skills to investigate scientific questions and engineering problems.
Electronic Journal of Science Education ejse.southwestern.edu Table 3 (continued)
SEP11. When planning and teaching, educators have students engage in evidence-based argumentation about scientific explanations or an engineering designs.
.600 .295 .484 .036 .244 3.50 1.22
Teaching Disciplinary Core Ideas (TDCI)
TDCI1. When planning and teaching, educators use a learning progression approach by building from prior knowledge and working
towards future sophistication. 1.71 .796 .118 .250 .270 4.44 1.02
TDCI2. When planning and teaching, educators recognize that the construction of knowledge requires active participation on the part of the students.
.217 .769 .002 .099 .332 4.84 0,89
TDCI3. When planning and teaching, educators recognize that the development of student understanding of disciplinary core ideas is a
progression that takes place over years. .215 .737 .156 .251 .297 4.50 1.00
TDCI4. When planning and teaching, educators focus on a few core ideas instead of a large number of topics so that students can achieve greater depth in their understanding.
.316 .730 .281 .232 .020 4.40 0.99
TDCI5. When planning and teaching, educators include core ideas that
are important in investigating more complex ideas and solving problems. .267 .691 .353 .249 .125 3.98 1.04
TDCI6. When planning and teaching, educators include core ideas that
relate to the interests and life experiences of students or societal concerns. .284 .654 .200 .429 .204 4.27 1.02
TDCI7. When planning and teaching, educators include core ideas that have broad importance across multiple disciplines or are key organizing principles within a discipline.
.346 .606 .257 .416 .069 4.14 1.04
Crosscutting Concepts (CC)
CC1. When planning and teaching, educators have students investigate
Electronic Journal of Science Education ejse.southwestern.edu Table 3 (continued)
CC2. When planning and teaching, educators have students develop an
understanding that phenomena work differently at different scales. .305 .149 .743 .243 .127 3.19 1.21
CC3. When planning and teaching, educators have students use systems
thinking when investigating scientific phenomena. .333 .017 .722 .102 .201 2.94 1.27
CC4. When planning and teaching, educators have students consider that since energy and matter are conserved, much can be determined by
studying their flow into and out of systems. .325 .124 .698 .333 -.016 3.14 1.27
CC5. When planning and teaching, educators have students identify what aspects of a system remain stable over time and what aspects undergo patterns of change.
.290 .321 .692 .096 .172 3.35 1.22
CC6. When planning and teaching, educators have students consider issues of cause and effect when questioning and discussing scientific phenomena or engineering designs.
.385 .363 .614 .151 .175 4.07 1.00
Integration of the Three Dimensions (ITD)
ITD1. When planning and teaching, educators have students use the crosscutting concepts when engaging in practices about disciplinary core
ideas .298 .281 .238 .723 .187 3.28 1.26
ITD2. When planning and teaching, educators have students explore disciplinary ideas by engaging in practices and making connections
through crosscutting concepts. .216 .324 .249 .656 .328 3.57 1.26
ITD3. When planning and teaching, educators intentionally select practices and concepts that best facilitate student sense making for particular core ideas.
Electronic Journal of Science Education ejse.southwestern.edu Table 3 (continued)
Best Practices in Science Education (BPSE)
BPSE1. When planning and teaching, educators teach students how to present their scientific ideas and engineering solutions with clarity
through both the written and spoken word. .128 .358 .282 .162 .706 4.16 1.03
BPSE2. When planning and teaching, educators teach students how mathematical concepts and skills apply to scientific investigations and engineering design.
.128 .269 .458 .245 .626 3.83 1.13
BPSE3. When planning and teaching, educators use both teacher-led and student-led strategies to facilitate student understanding of science and engineering content.
.224 .456 .078 .386 .577 4.49 1.00
BPSE4. When planning and teaching, educators have students engage in
sustained investigations accompanied by necessary teacher support. .294 .300 .218 .450 .571 4.33 1.09
Electronic Journal of Science Education ejse.southwestern.edu Confirmatory Factor Analysis
Following the exploratory analysis, Confirmatory Factor Analysis (CFA) was conducted using Lisrel 9.3 (Joreskog & Sorbom, 2017) with the second random subsample (n = 84). The purpose of conducting a CFA is to test the model fit of a proposed factor model against a hypothesized population model (Bryne, 2009). Results from the CFA indicated that the independence model (which tests the hypothesis that all variables are uncorrelated) could be rejected in favor of the five-factor model that was developed from the exploratory analysis. Figure 2 displays this model.
Electronic Journal of Science Education ejse.southwestern.edu The five-factor model produced a Root Mean Square Error of Approximation (RMSEA) of .070. The 90% confidence interval (.057 - .083) surrounding the RMSEA result provides supporting evidence that the proposed model is a fair fit to the estimated population. The accuracy of this fit is strengthened by a Comparative Fit Index (CFA) of .98 and a Non Normed Fit Index (NNFI) of .98—both well above the suggested threshold. RMSEAs less than .05 are a close fit and those between .05 and .08 are considered a fair fit (MacCallum, Browne, & Sugawara, 1996). A good model fit also has CFI and NNFI values above .90 (Browne & Cudeck, 1993). The power of this model fit based on 419 degrees of freedom and the noncentrality parameter of 149 was determined to exceed .90 when consulting published tables (Kim, 2005).
Discussion
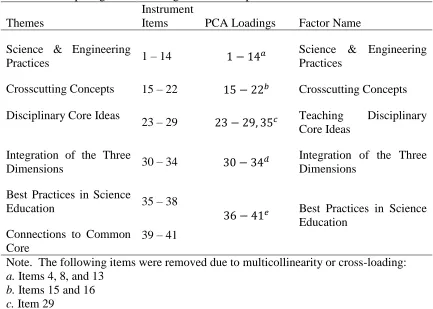
The five-factor model identified through exploratory PCA revealed that the underlying dimensions of the NFSE-STU items were very similar to the six themes used in creating the survey instrument. This five-factor model, consisting of 31 items, was further validated through CFA. Table 4 displays the themes and survey instrument items alongside items retained in the exploratory analysis. Four of the factors were nearly identical and the fifth was an explainable combination of two original themes.
The first factor included all items written for the original theme. It was given the title, Science & Engineering Practices (SEP), since these items describe classrooms where students engage in inquiry skills and processes shared by real scientists and engineers. Educators teaching with this factor in mind regularly have students plan and conduct investigations to answer questions with evidence.
The second factor also loaded each item written for the original theme; therefore, it was given the same title, Crosscutting Concepts (CC). The concepts presented in these items are the critical concepts found across the disciplines of science (NRC, 2012). Teachers who include these concepts in science classes would have students explore their world through conceptual lenses. For example, they would be looking for patterns, identifying cause and effect relationships in phenomena, and applying systems thinking to investigations.
Electronic Journal of Science Education ejse.southwestern.edu The fourth factor loaded with the same items drafted for the original theme and was so named, Integration of the Three Dimensions (ITD). The first three factors represent each dimension found in the NGSS framework. But, the vision for the future of science education is that these dimensions would be integrated. So critical was this idea that the NRC (2014) described best practice in science education as “three-dimensional learning.” The prompts for this factor describe classrooms where such integration is promoted.
Table 4. Comparing Understanding Scale Development with the Factor Model
Themes
Instrument
Items PCA Loadings Factor Name
Science & Engineering
Practices 1 – 14 1 − 14
𝑎 Science & Engineering
Practices
Crosscutting Concepts 15 – 22 15 − 22𝑏 Crosscutting Concepts
Disciplinary Core Ideas
23 – 29 23 − 29, 35𝑐 Teaching Disciplinary
Core Ideas
Integration of the Three
Dimensions 30 – 34 30 − 34
𝑑 Integration of the Three
Dimensions
Best Practices in Science
Education 35 – 38
36 − 41𝑒 Best Practices in Science
Education Connections to Common
Core
39 – 41
Note. The following items were removed due to multicollinearity or cross-loading: a. Items 4, 8, and 13
b. Items 15 and 16 c. Item 29
d. Items 30 and 34 e. Items 36 and 41
Electronic Journal of Science Education ejse.southwestern.edu Limitations
All potential benefits and implications of this research must be tempered by the limitations of the study. First, instrument validation is an ongoing process and not a one-time event (AERA, 2014). Psychometric studies generally provide outcomes that contribute to one or two sources of validity evidence. Although, these studies may be narrow in scope, their results contribute to a larger body of evidence used to establish validity arguments supporting or refuting the intended interpretation and proposed use of test scores for a particular instrument (Bangert, 2009). Thus, this research was the first attempt to assess elementary teachers’ self-reported understanding of the NGSS framework and further research is needed to support its use as an instrument for assessing PD needs. Although, our sample was limited to elementary teachers from the Western region of the United States, we hypothesize that the outcomes from this study will generalize to other groups of elementary teachers from other regions of the country. However, as with any new instrument, research must be conducted with larger and more diverse samples of elementary teachers from other regions of the United States to cross-validate the initial results from the NFSE-STU presented in this study (AERA, 2014).
Conclusion
In order to teach from the NGSS framework, science educators will need to embrace a paradigm shift (NRC, 2012) which, in turn, will require high-quality PD (Phillips et al., 2011). The scale of the needed PD will be massive and constitute a major investment of both time and resources (Wilson, 2013). Therefore, great intention is needed in approaching this effort, and a valid instrument measuring teacher understandings of the framework could help address needs in both planning and assessing effective PD.
We propose that the NFSE-STU could be useful in addressing three key characteristics of effective PD. First, using a needs assessment in planning for PD is essential but only meaningful with valid and reliable tools (Guskey & Sparks, 1991). For example, a professional developer or curriculum director considering options for PD could use the NFSE-STU with elementary teachers as part of the planning process. The resulting data would reveal perceptual gaps and areas of weaker understanding. For preservice elementary teachers, science education faculty could administer the instrument at the beginning of a methods course to shape topics to best fit student needs. Employing the NFSE-STU in this way demonstrates an alignment with the second characteristic of effective PD. High-quality PD is targeted (Hochberg & Desimone, 2010) so as to produce incremental growth in teaching practice (NRC, 2015). Professional developers and education faculty who use a validated instrument to identify areas of need, can then plan a step-by-step approach that would be manageable yet guided by the larger vision of the NGSS framework (Guskey, 2000).
Electronic Journal of Science Education ejse.southwestern.edu need for a coherent message surrounding PD in inquiry-based teaching because of its complex history. Coherence in training, then, means presenting inquiry through application of the Science and Engineering Practices (Michaels et al., 2008) and the vision of 3D learning (Krajcik et al., 2014). Two constructs in the NFSE-STU (Science and Engineering Practices and Integration of the Three Dimensions) measure teacher perceptions for this coherent view of inquiry.
Electronic Journal of Science Education ejse.southwestern.edu References
AERA. (2014). Standards for educational and psychological testing. Washington, DC: American Educational Research Association.
Akerson, V. L., Cullen, T. A., & Hanson, D. L. (2009). Fostering a community of practice through a professional development program to improve elementary teachers' views of nature of science and teaching practice. Journal of Research in Science Teaching, 46(10), 1090-1113. doi: 10.1002/tea.20303
Akerson, V. L., & Donnelly, L. A. (2010). Teaching nature of science to K-12 students: What understanding can they attain? International Journal of Science Education, 32(1), 97-124 Alreck, P. L., & Settle, R. B. (2004). The survey research handbook. New York:
McGraw-Hill/Irwin.
American Association for the Advancement of Science. (1990). Science for all americans: A project 2061 report on literacy goals in science, mathematics, and technology. Washinton, DC: Author.
Archer, L., DeWitt, J., Osborne, J., J., D., Willis, B., & Wong, B. (2010). "Doing" science versus "being" a scientist: Examining 10- and 11-year-old school-children's constructions of science through the lens of identiry. Science Education, 94(4), 617-639
Astor-Jack, T., McCallie, E., & Balcerzak, P. (2007). Academic and informal science education practitioner views about professional development in science education. Science Education, 91(4), 604-628
Ball, D. L., & Cohen, D. K. (1999). Developing practice, developing practitioners: Towards a practice-based theory of professional education. In L. Darling-Hammond & G. Sykes (Eds.), Teaching as the learning profession: Handbook of policy and practice (pp. 3-31). San Francisco, CA: Jossey-Bass.
Bangert, A. W. (2009). Building a validity argument for the community of inquiry survey
instrument. The Internet and Higher Education, 12, 104-111. doi:
10.1016/j.iheduc.2009.06.001
Beane, J. A. (1991). The middle school: The natural home of integrated curriculum. Educational Leadership, 49(2), 9-13
Birman, B. F., Desimone, L. M., Porter, A. C., & Garet, M. S. (2000). Designing Professional Development That Works. Educational Leadership, 57(8), 28
Borko, H. (2004). Professional development and teacher learning: Mapping the terrain. Educational Researcher, 33(8), 3-15
Browne, M. W., & Cudeck, R. (1993). Alternative ways of assessing model fit. In K. A. Bollen & J. S. Long (Eds.), Testing structural equation models (pp. 136-162). Beverly Hills, CA: Sage.
Bryne, B. (2009). Structural equation modeling with AMOS: Basic concepts, applications, and programing (2nd ed.). London: Routledge.
Bybee, R. (1993). Reforming science education: Social perspectives and personal reflections. New York: Teachers College Press.
Bybee, R. (2006). The national science education standards: Personal reflections. School Science and Mathematics, 106(2), 57-63
Electronic Journal of Science Education ejse.southwestern.edu Cattell, R. B. (1966). The scree test for the number of factors. Multivariate Behavioral Research,
1(2), 245-276. doi: 10.1207/s15327906mbr0102_10
Coleman, D., & Zimba, J. (2008). Math and Science Standards that are Fewer, Clearer, Higher to Raise Achievement at all Levels. A Report prepared for the Carnegie-IAS Commission
on Mathematics and Science EducationRetrieved from
http://opportunityequation.org/standards-and-assessments/math-science-standards-are-fewer.
College Board. (2009). Science college board standards for college success Retrieved from http://professionals.collegboard.com/profdownload/cbscs-science-standards-2009.pdf Collins, A., Brown, J. S., & Newman, S. E. (1989). Cognitive apprenticeship: Teaching the crafts
of reading, writing, and mathematics. In L. B. Resnick (Ed.), Knowling, learning, and instruction: Essays in honor of Robert Glaser (pp. 453-494). Hillsdale, NJ: Lawrence Erlbaum Associates.
Crawford, B. A., Krajcik, J. S., & Marx, R. (1999). Elements of a community of learners in a middle school science classroom. Science Education, 83, 701-723
Cronbach, L. J. (1951). Coefficient alpha and the internal structure of tests. Psychometrika, 16(3), 297-334. doi: 10.1007/BF02310555
Desimone, L. M. (2011). A Primer on Effective Professional Development. Phi Delta Kappan, 92(6), 68-71
Desimone, L. M., Porter, A. C., Garet, M. S., Yoon, K. S., & Birman, B. F. (2002). Effects of Professional Development on Teachers' Instruction: Results from a Three-Year Longitudinal Study. Educational Evaluation and Policy Analysis, 24(2), 81-112. doi: 10.2307/3594138
DeVellis, R. F. (2012). Scale development: Theory and applications (3rd ed.). Thousand Oaks, CA: SAGE Publications.
Duschl, R. A. (2012). The second dimension: Crosscutting concepts. Science Teacher, 79(2), 34-38
Fabrigar, L. R., Wegener, D. T., MacCallum, R. C., & Strahan, E. J. (1999). Evaluating the use of exploratory factor analysis in psychological research. Psychological methods, 4(3), 272-299
Field, A. (2013). Discovering statistics using IBM spss statistics. Thousand Oaks, CA: Sage. Garet, M. S., Porter, A. C., Desimone, L., Birman, B. F., & Yoon, K. S. (2001). What makes
professional development effective? Results from a national sample of teachers. American Educational Research Journal, 38(4), 915-945. doi: 10.3102/00028312038004915
Gulamhussein, A. (2013). Teaching the teachers: Effective professional development in the era of high stakes accountability. Alexandria, VA.
Guskey, T. R. (2000). Evaluating professional development. Thousand Oaks, CA: Corwin Press. Guskey, T. R., & Sparks, D. (1991). What to consider when evaluating staff development.
Educational Leadership, 49(3), 73
Guskey, T. R., & Yoon, K. S. (2009). What works in professional development? Phi Delta Kappan, 90(7), 495-500. doi: 10.1177/003172170909000709
Hartzler, D. S. (2000). A meta-analysis of studies conducted on integrated curriculum programs and their effects on student achievement.
Electronic Journal of Science Education ejse.southwestern.edu Hochberg, E. D., & Desimone, L. M. (2010). Professional Development in the Accountability
Context: Building Capacity to Achieve Standards. Educational Psychologist, 45(2), 89-106. doi: 10.1080/00461521003703052
Jacobs, H. H. (1989). Interdisciplinary curriculum: Design and implementation. Alexandria, VA: ASCD.
Joreskog, K. G., & Sorbom, D. (2017). LISREL (Version 9.3). Chicago: Scientific Software, Inc. Kim, K. H. (2005). The relation among fit indexes, power, and sample size in structural equation
modeling. Structural Equation Modeling: A Multidiscipliary Journal, 12(3), 368-390 Krajcik, J., Codere, S., Dahsah, C., Bayer, R., & Mun, K. (2014). Planning instruction to meet the
intent of the Next Generation Science Standards. Journal of Science Teacher Education, 25(2), 157-175. doi: 10.1007/s10972-014-9383-2
Lee, O., & Maerten-Rivera, J. (2012). Teacher change in elementary science instruction with English language learners: Results of a multiyear professional development intervention. Teachers College Record, 114(8), 1-44
Loucks-Horsley, S., Stiles, K., Mundry, S. E., Love, N. B., & Hewson, P. W. (2010). Designing professional development for teachers of science and mathematics (3rd ed.). Thousand Oaks, CA: Corwin Press.
Loughran, J. J. (2014). Developming understandings of practice: Science teacher learning. In N. G. Lederman & S. K. Abell (Eds.), Handbook of research on sciene education (Vol. 2). New York: Routledge.
Luft, J. A., & Hewson, P. W. (2014). Research on teacher professional development programs in science. In N. G. Lederman & S. K. Abell (Eds.), Handbook of research on science education (Vol. 2). New York: Routledge.
MacCallum, R. C., Browne, M. W., & Sugawara, H. M. (1996). Power analysis and determination of sample size for covariance structure modeling. Psychological Methods, 1(2), 130-149 MacCallum, R. C., Widaman, K. F., Zhang, S., & Hong, S. (1999). Sample size in factor analysis.
Psychological Methods, 4(1), 84-99. doi: 10.1037/1082-989X.4.1.84
MacMath, S., Roberts, J., Wallace, J., & Chi, X. (2010). Curriculum integration and at-risk students: A canadian case study examining student learning and motivation. British Journal of Special Education, 37(2), 87-94
McNeill, K. L., & Krajcik, J. (2008). Scientific explanation: Characterizing and evaluating the effects of teachers' instructional practices on student learning. Journal of Research in Science Teaching, 45(1), 53-78
Metz, K. E. (2004). Children's understanding of scientific inquiry: Their conceptualization of uncertainty in investigations of their own design. Cognition and Instruction, 22(2), 219-290
Michaels, S., Shouse, A. W., & Schweingruber, H. A. (2008). Ready, set, science: Putting research to work in K-8 science classrooms. Washington, D.C.: National Academies Press.
National Governors Association Center for Best Practices, C. o. C. S. S. O. (2010). Common Core State Standards. Washington, DC: Author.
National Research Council. (1996). National science education standards. Washington, DC: National Academy Press.
Electronic Journal of Science Education ejse.southwestern.edu Netemeyer, R. G., Bearden, W. O., & Sharma, S. (2003). Scaling procedures: Issues and
applications. Thousand Oaks, CA: SAGE Publications.
NGSS Lead States. (2013). Next generation science standards: For states, by states. Washington, DC: The National Academies Press.
NGSS Lead States. (2016). Three dimensional learning. Retrieved from
http://nextgenscience.org/three-dimensions
Nichols, S. E., & Koballa, T. (2013). Framing issues of elementary science teacher education: Critical conversations. In K. Appleton (Ed.), Elementary science teacher education: International perspectives on contemporary issues and practice: Routledge.
NRC. (1999). How people learn: Brain, mind, experience, and school. Washington, D.C.: National Academy Press.
NRC. (2007). Taking science to school: Learning and teaching science in grades K-8. Washington, DC: The National Academies Press.
NRC. (2012). A framework for k-12 science education: Practices, crosscutting concepts, and core ideas. Washington, D.C.: The National Academies Press.
NRC. (2014). Developing assessments for the next generation science standards. In J. W. Pellegrino;, M. R. Wilson;, J. A. Koenig; & A. S. Beatty (Eds.), Board on Testing and Assessment and Board on Science Education. Division of Behavioral and Social Sciences and Education. Washington D.C.: National Accademies Press.
NRC. (2015). Guide to implementing the Next Generation Science Standards. Committee on Guidance on Implementing the Next Generation Science Standards. Board on Science Education, Division of Behavioral and Social Sciences and Education, Washington, DC: The National Academies Press.
Pecore, J. L., Kirchgessner, M. L., & Carruth, L. L. (2013). Changes in science content knowledge and attitudes toward science teaching of educators attending a zoo-based neuroscience
professional development. Clearing House, 86(6), 238-245. doi:
10.1080/00098655.2013.826527
Penuel, W. R., Fishman, B. J., Yamaguchi, R., & Gallagher, L. P. (2007). What Makes Professional Development Effective? Strategies That Foster Curriculum Implementation. American Educational Research Journal, 44(4), 921-958
Phillips, K. J., Desimone, L. M., & Smith, T. M. (2011). Teacher participation in content-focused professional development & the role of state policy. Teachers College Record, 113(11), 2586-2630
Pratt, H. (2002). Introduction. In R. Bybee (Ed.), Learning science and the science of learning (pp. xiii-xv). Arlington, VA: NSTA Press.
Pratt, H. (2014). Implementing NGSS crosscutting concepts: Opportunities for elementary teacher contributions, Editorial, Science & Children, pp. 8-11. Retrieved from https://ezproxy.library.ewu.edu/login?url=http://search.ebscohost.com/login.aspx?direct= true&db=ehh&AN=98545986&site=ehost-live&scope=site
Pruitt, S. L. (2014). The next generation science standards: The features and challenges. Journal of Science Teacher Education, 25(2), 145-156. doi: 10.1007/s10972-014-9385-0
Romance, N. R., & Vitale, M. R. (2001). Implementing an in-depth expanded science model in elementary schools: Multi-year findings, research issues, and policy implications. International Journal of Science Education, 23(4), 373-404
Electronic Journal of Science Education ejse.southwestern.edu Schumaker, R. E., & Lomax, R. G. (2010). A beginer's guide to structual equation modeling (3rd
ed.). New York: Routledge.
Shih-Hsien, Y. (2009). Using blogs to enhance critical reflection and community of practice. Journal of Educational Technology & Society, 12(2), 11-21
Smith, C. L., Wiser, M., Anderson, C. W., & Krajcik, J. (2006). Implications of Research on Children's Learning for Standards and Assessment: A Proposed Learning Progression for Matter and the Atomic-Molecular Theory. Measurement (Mahwah, N.J.), 4(1-2), 1-98 Sneider, C., & Workosky, C. (2009). Critical Issues for common state standards science anchors
phase I final report. A Report Prepared for the National Science Teachers Association. Supovitz, J. A., & Turner, H. M. (2000). The effects of professional development on science
teaching practices and classroom culture. Journal of research in science teaching, 37(9), 963-980
SurveyGizmo. (2014). SurveyGizmo forms & surveys [Software]. Retrieved from
http://www.surveygizmo.com/?utm_expid=50278599-29.5csRIB26Smq-dZQY9lQ2GQ.0
van Driel, J. H., Beijaard, D., & Verloop, N. (2001). Professional development and reform in science education: The role of teachers' practical knowledge. Journal of Science Teaching, 38(2), 137-158
van Driel, J. H., Berry, A., & Meirink, J. (2014). Research on science teacher knowledge. In N. G. Lederman & S. K. Abell (Eds.), Handbook of Research on Science Education (Vol. 11, pp. 848 - 870). New York: Routledge.
Varelas, M., Pappas, C. C., Kane, J. M., Arsenault, A., Hankes, J., & Cowan, B. M. (2008). Urban primary-grade children think and talk science: Curriculum and instructional practices that nurture participation and argumentation. Science Education, 92(1), 65-95
Vitale, M. R., & Romance, N. R. (2012). USING IN-DEPTH SCIENCE INSTRUCTION TO ACCELERATE STUDENT ACHIEVEMENT IN SCIENCE AND READING COMPREHENSION IN GRADES 1 - 2. International Journal of Science & Mathematics Education, 10(2), 457-472. doi: 10.1007/s10763-011-9326-8
Wei, R. C., Darling-Hammond, L., Andree, A., Richardson, N., & Orphanos, S. (2009). Professional learning in the learning profession: A status report on teacher development in the United States and abroad. Dallas, TX.
West, S. G., Finch, J. F., & Curran, P. J. (1995). Structural equation models with nonnormal variables: Problems and remedies. In R. Hoyle (Ed.), Structural equation modeling: Concepts, issues, and applications (pp. 56-75). Newbury Park, CA: Sage.
Whitworth, B., & Chiu, J. (2015). Professional development and teacher change: The missing leadership link. Journal of Science Teacher Education, 26(2), 121-137. doi: 10.1007/s10972-014-9411-2
Wilson, S. M. (2013). Professional development for science teachers. Science, 340(6130), 310-313. doi: 10.1126/science.1230725