Int. J. Environ. Res. Public Health2018, 15, x; doi: FOR PEER REVIEW www.mdpi.com/journal/ijerph
Article
1
Global Asbestos Disaster
2
3
Sugio Furuya 1, Odgerel Chimed-Ochir 2, Ken Takahashi 3, Annette David 4 and Jukka Takala 5*
4
1 Japan Occupational Safety and Health Resource Center; [email protected]
5
2 Department of Environmental Epidemiology, Institute of Industrial Ecological Sciences, University of
6
Occupational and Environmental Health, Kitakyushu, Japan; [email protected]
7
3 Asbestos Diseases Research Institute, University of Sydney, PO Box 3628, Rhodes NSW 2138, Sydney, Australia;
8
9
4 Health Partners, LLC, 125 Tun Jose Toves Way, Tamuning, GU 96931; [email protected]
10
5 WSH Institute, MOMSC, Singapore, ICOH c/o INAIL Italy *
11
* Correspondence: [email protected] and [email protected] : +358 40 759 0749
12
13
14
Abstract:
15
Background. Asbestos has been used for thousands of years but in a large industrial scale for about
16
100–150 years. The first identified disease was asbestosis, a type of incurable pneumoconiosis caused
17
by asbestos dust and fibres. The latest estimate of global number of asbestosis deaths from the Global
18
Burden of Disease estimate 2016 is 3495. Asbestos caused cancer was identified in the late 1930’s but
19
despite of today’s overwhelming evidence of the strong carcinogenicity of all asbestos types
20
including chrysotile it is still widely used globally. Various estimates have been made over time
21
including those of WHO and ILO 107,000–112,000 deaths. Present estimates are radically higher. This
22
special edition of the Journal summarizes key aspects of the past and present of the asbestos problem
23
globally.
24
Methods. Documentation on milestones of asbestos related diseases, ARDs, their recognition,
25
reporting, compensation and prevention efforts were examined, in particular from the regulatory and
26
prevention point of view. Estimated global numbers of incidence and mortality of ARDs were looked
27
at.
28
Results. Asbestos causes an estimated 257,000 deaths (243,223–270,635) annually according to latest
29
knowledge. Work-related exposures are responsible for 235,000 deaths (222,322–247,363) of those. In
30
the European Union, USA and in other High income economies (WHO regional classification) the
31
direct costs for sickness, early retirement and death, including production losses, have been estimated
32
to be very high, in the Western European countries and EU equivalent of 0.70% of the GDP or
33
114.9*109 USD. Intangible costs could be much higher. When applying the Value of Statistical Life
34
(VSL) of 4 million EUR per cancer death used by the European Commission we arrived 5at 410*109
35
USD while the human suffering and loss of life is impossible to quantify. The numbers and costs
36
are increasing practically in every country and region in the world. Asbestos has been banned in 55
37
countries but used widely today, some 2,030,000 tons consumed annually according to latest
38
available consumption data. Every 20 tons of asbestos produced and consumed kills a person
39
somewhere in the world. Buying 1 kg asbestos powder format e.g. in Asia costs some 0.38 USD and
40
20 tons would cost in such retail market 7600 USD.
41
Conclusions.
Present efforts to eliminate this man-made problem, in fact an epidemiological
disaster,42
and preventing exposures leading to it are insufficient in most countries in the world. Applying
43
programmes and policies, such as those on the elimination of all kind of asbestos use—that is banning
44
of new asbestos use and tight control and management of existing structures containing asbestos—
45
need revision and resources. The ILO/WHO Joint Programme for the Elimination of Asbestos-related
46
Diseases need to be revitalized. Exposure limits do not protect properly against cancer but for
47
asbestos removal and equivalent exposure elimination work we propose a limit value of 1000
48
fibres/m3.
49
50
Keywords: asbestos; ban; global estimates, costs
51
52
1. Introduction
53
The First Supplement to the “Occupation and Health - An Encyclopedia of Hygiene, Pathology
54
and Social Welfare” of the International Labor Office, ILO, Vol. I, 999 pp.; Vol. II, 1310 pp. was
55
published in 1938 and contained a Chapter on Asbestos [1]. It was the first time when an ILO
56
document refers to cancer in relation to asbestos when identifying the criteria for action in
asbestos-57
related workplaces. Asbestosis had been well recognized already at that time but the magnitude of
58
the problem was revealed gradually better when the carcinogenic properties of all kinds of asbestos
59
fibres were convincingly identified.
60
61
It took some 40 years to start international action. The ILO Asbestos Convention No. 162 was adopted
62
in 1986 [2]. This Convention itself was a compromise of the pro-asbestos parties and those who
63
wanted strict measures to stop using asbestos. Later the Convention wording has been misused
64
against the original intent.
65
66
Most of the asbestos exposures were considered to be limited to asbestosis and mesothelioma until
67
recently – this millennium - when the magnitude of lung cancer, ovary and larynx cancer deaths have
68
come to be better known. IARC - International Agency for Research on Cancer, of WHO has classified
69
all types of asbestos causing these cancers and possibly other cancers and diseases. Other cancers
70
may be confirmed as asbestos induced in future.
71
72
“ILO Resolution concerning asbestos in 2006”[3] finally corrected the missing parts of the Convention
73
in stating that “all forms of asbestos, including chrysotile, are considered as known human
74
carcinogens.” and “elimination of the future use of asbestos and the identification and proper
75
management of asbestos currently in place are the most effective means to protect workers from
76
asbestos exposure.”
77
78
Asbestos is the most significant factor for work-related cancer and work processes including asbestos
79
affect indirectly family members of asbestos workers, and the environment anywhere where asbestos
80
and related products are present. Lung cancer counts for 54–75 per cent of all occupational cancer.
81
Epidemiological studies indicate that occupational exposures cause 5.3–8.4 per cent of all cancers and
82
among men 17–29 per cent of all lung cancer deaths, according to best estimates. Asbestos accounts
83
for 55–85 per cent of lung cancer and causes other cancers and other ARDs today [4].
84
2. Materials and Methods
86
Materials and data were obtained from ILO, WHO, and from the Institute of Health Metrics and
87
Evaluation, and by using individual scientific papers and country and using global trade and health
88
statistics. Crude mortality numbers and age-adjusted mortality rates were used to balance and
89
compare outcomes for different countries and populations with varying age structures. Comparisons
90
were made based on selected regions, countries, asbestos consumption, deaths and disability
91
adjusted life years (DALY’s) for several confirmed asbestos-related diseases. In many workers’
92
compensation schemes the individual worker’s smoking status is not a reason to exclude a victim
93
from compensation. In practice, however, most asbestos caused cancers are not reported, recorded
94
and compensated and in most countries none of them are properly identified and compensated. The
95
synergistic additive or sometimes multiplicative impact of smoking and asbestos often confuses and
96
masks the identification asbestos caused problems. Major ARDs and, in particular, lung cancer is a
97
typical major manifestation of multiple simultaneous exposures complicating individual diagnosis.
98
Depending on the reliability of source materials and methods of estimation a considerable number
99
of asbestos exposure victims may have been be classified as victims of smoking only thus producing
100
gross under-estimates of the role of asbestos. According to the definition of the attributable fraction
101
the baseline for estimation should be to count the difference between the numbers of negative
102
outcomes in studied comparable populations when the related exposure, such as asbestos exposure,
103
is or is not present. This means independence of the impact of other simultaneously present factors.
104
The practice of adjusting attributable fractions for smoking may not be ethically sound.
105
106
Direct statistics and relatively reasonable estimates of asbestos related pneumoconiosis are available
107
from WHO and IHME statistics. For pleural and peritoneal mesothelioma which are overwhelmingly
108
caused by asbestos exposure this is also the case. However, a serious under-diagnosing or
non-109
diagnosing is a source of error for recording, in particular, lung cancer cases. Recorded lung cancer,
110
ovary and larynx cancers do not usually indicate asbestos as a cause of death. Diagnosing these
111
properly for individual needs a post mortem including fibre counts of the lung tissue, which is not a
112
usual practice for the huge majority of cases. Consequently, the numbers may be estimated either
113
using the attributable fraction method based on quantity of asbestos exposure and number of exposed
114
workers. Furthermore, the number of mesothelioma cases - where almost all cases/deaths are linked
115
to asbestos exposure - can be used as a proxy for asbestos exposure exactly in the same way as has
116
been done for the IHME estimates on the Global Burden of Diseases and Injury GBD 2016 [5].
117
118
Cost comparisons were made using the estimated disability adjusted life years, DALYs, caused by
119
asbestos as compared to an ideal case where no ARDs, no asbestos consumption and no asbestos
120
exposures were present [6]. This itself is somewhat challenging and may cause a source of error as it
121
is practically impossible to find a populated location without any asbestos fibres in air globally.
122
Statistics are not available from most countries in the world and proxy estimates based on comparable
123
countries and regions were made when no data was available. Exposures and negative outcomes
124
were estimated separately – when data was available - for occupational exposures and
non-125
occupational sources. The IHME/GBD number of DALYs, Years of Lost Life (YLL) and Years Lived
126
in Disability were taken as a baseline while the mortality numbers were extrapolated from available
127
data by Chimed-Ochir et al. The method is equal to that of ILO study on economic costs of
128
researchers including ILO, ICOH, WSH Institute of Singapore, Finnish Institute of Occupational
130
Health, ministries of Finland and Singapore and the European Agency for Safety and Health at Work
131
[7].
132
133
3. Results
134
Deaths and diseases caused by asbestos were studied and presented globally. A summary of
135
present knowledge related to mesothelioma is presented in Table 1. We have used the occupational
136
component of work-related mesothelioma 94.9% from Rushton et al [8]. A corresponding value for
137
work-relatedness of all mesothelioma deaths by the GBD2016 was 91.4%, see Supplementary Table
138
1.
139
140
Table 1. Summary of most recent information related to mesothelioma
141
142
Sources Global China EU28
Takala 2015 10,368
Odgerel 2017 Reported 15,011 NA 8,363
Estimatedi 21,247-23,377 6,456-10,459 NA
Total 36,258-38,388
GBD 2016 30,208 2,747 10,700
Work related mesothelioma GBD 2016 27,612
Odgerel 2017 35,087ii
I Mesothelioma deaths were estimated based on continental region, % of employment in industrial sector and
143
asbestos consumption. Please refer to original article for details.
144
ii Calculated from asbestos adjusted estimation which is 38,388.
145
146
Mesothelioma deaths were estimated by GBD2016 to be 30,208. The latest scientific paper by Odgerel
147
Chimed-Ochir et al [9] estimated the number of deaths to be 38,388 using asbestos consumption
148
related estimation method. Equivalent work-related outcomes were correspondingly 27,612
149
(GBD2016) and 35,087 (Chimed-Ochir). Earlier data for GBD2016 are given as a comparison for China
150
and EU28 in Table 2. Further details and table on country level mesothelioma deaths by
Chimed-151
Ochir et al. are given by the authors, in addition a mesothelioma excel table by country based on
152
WHO data is included in the CEJOEM journal web version [10].
153
Table 2. Asbestos related lung cancer and other asbestos related deaths
155
156
Methods of estimated lung cancer deaths using mesothelioma as a proxy for asbestos
use
Lung cancer or
asbestos related cancers/
mesothelioma death ratio
Global China EU28
McCormack, Peto et al. (2013) average
estimate using chrysotile, lung cancer, all , GBD 2016
6.1 184,269
McCormack, Peto et al. (2013), low - high
estimates, lung cancer, all, GBD 2016
2.0-10 55,224-302,208
Asbestos-related cancersiii & asbestosis
(occupational exposure to asbestos, GBD 2016)
7.05iv
Mesothelioma 27,612 2,178 10,480
ARLC (Asbestos related lung cancer) 181,450 17,971 70,291
Ovarian cancer 6,022 270 2,868
Larynx cancer 3,743 198 1,287
Total asbestos related cancer at work (GBD 2016/Odgerel 2017)
222,322work /247,363vwork
Mid point 234,840
Total asbestos using mesothelioma all-work as proxies (GBD 2016/Odgerel 2017)
243,223all /270,635viall Mid point 256,930
iii - Mesothelioma, ARLC, ovarian and larynx cancer
iv- (ARLC+Ovarian+Larynx cancer+Asbestosis)/Occupational mesothelioma
v- 35,087 x 7.05
vi - 38,388 x 7.05
157
Table 2 provides estimated summary outcomes for the GBD2016 of the four types of asbestos related
158
cancers and asbestosis which was 222,322 deaths at work and extrapolating the number to all asbestos
159
deaths was 243,223 deaths. Corresponding numbers of deaths based on the higher mesothelioma
160
estimates by Chimed-Ochir et al. and a similar extrapolating method will come to 247,363 at work,
161
and 270,635 including all exposures at work, semi-occupational exposures, such as family members
162
of workers, and environmental exposures.
163
164
A mid-point has been shown for both work-related and all asbestos exposed death cases, 234,840 and
165
256,930 correspondingly. These are updated from the CEJOEM paper [10].
166
167
Supplementary Tables 2 and Figure 1 compare the outcomes of the two estimation methods for
168
mesothelioma of the biggest asbestos using countries in the past as the mesothelioma case number is
169
Asbestosis victims may develop cancers as well while cancer and asbestosis do not necessarily
171
develop simultaneously.
172
173
Figure 1. Comparison of Global Burden of Mesothelioma Deaths for leading countries in terms of
174
mesothelioma death (Odgerel et al 2017/ GBD 2016)
175
176
177
178
Evidence on the rising numbers of numbers of mesothelioma deaths are given in Figure 2. It appears
179
that these numbers go up for some time in future [11]. Figure 2 shows that there is so far no solid
180
evidence that the total mesothelioma numbers would be starting to go significantly down in any
181
country while reports of younger cohorts in Sweden - and the Netherlands - will show that the
182
cessation to use asbestos in the 1980’s started to have impact after the long latency period [12].
183
Figure 2. Mesothelioma death rate for selected countries
185
186
WHO Mortality Database, ICD 10: C45 Mesothelioma, ICD 9: 163 Malignant Neoplasm of Pleura
187
UK: HSE Statistics - Mesothelioma, http://www.hse.gov.uk/statistics/causdis/meso.htm
188
Australia: National Cancer Statistics Clearing House of Australian Institute of Health and Welfare
189
(AIHW)
190
191
Supplementary Table 1 shows the relative importance of lung cancer in the burden caused by
192
asbestos in major asbestos using countries and globally. The data are based on the relatively
193
conservative estimates of the GBD 2016 outcome of the Institute of Health Metrics and Evaluation.
194
The evidence from the U. K. shows that the numbers are likely to start going down in the 2020’s based
195
on the gradually reduced asbestos consumption and exposures first and later legally banning the use
196
altogether, see Figure 3 [13].
197
198
Figure 3. Mesothelioma annual deaths, IIDB cases and projected future deaths to 2030 in GB, HSE/UK
200
2016
201
202
Figure 4 shows the age-adjusted rates for selected countries and the rising trend is visible in some
203
countries in the GBD2016 measures while the trends based on reported data in Chimed-Ochir paper
204
are less clear. This may be caused by the recent increases of young migrant populations in selected
205
countries that may result in significantly bigger young populations today as compared to the
206
originally exposed populations some 30-50 years earlier. Note that in the Chimed-Ochir paper, for
207
each calendar year, age-adjusted rates were directly calculated from actually reported numbers of
208
mesothelioma deaths in these countries, without accounting for statistical fluctuation caused by
209
generally low rates. In contrast, the GBD2016 paper provide estimates accounting for fluctuation of
210
“rare events.” Most likely the estimates in the GBD2016 study “smooths out” fluctuations by
211
statistical modelling.
212
Figure 4. Age adjusted mortality rate of mesothelioma for selected countries
214
215
216
Based on these numbers and the global peak annual consumption of asbestos globally in 1980, which
217
was 4,728,619 metric tons [14] and the Table 2 number in 2016 of asbestos caused deaths by the
mid-218
point value of asbestos deaths 257,000 deaths would provide a rough estimate of 18.4 tons of asbestos
219
consumption killing one person some 37 years later. Using the lowest GBD2016 estimate provides an
220
amount of 19.4 tons causing one death. It would be safe to say that – as a thumb rule - 20 tons of
221
asbestos use will cause one death.
222
223
As it appears the mesothelioma death numbers are consistently still going up. This leads to the
224
conclusion – based on the earlier method of using the mesothelioma deaths as a proxy to asbestos
225
exposure and consequently asbestos related cancer deaths are equally going up. The amount of the
226
than 20 tons. The increasing mesothelioma and other cancer numbers would mean that the number
228
of all asbestos caused deaths are expected to grow for some years ahead.
229
230
The EU28 is one of the heaviest exposed world region and Figure 5 provides details of the GBD 2016
231
estimates.
232
233
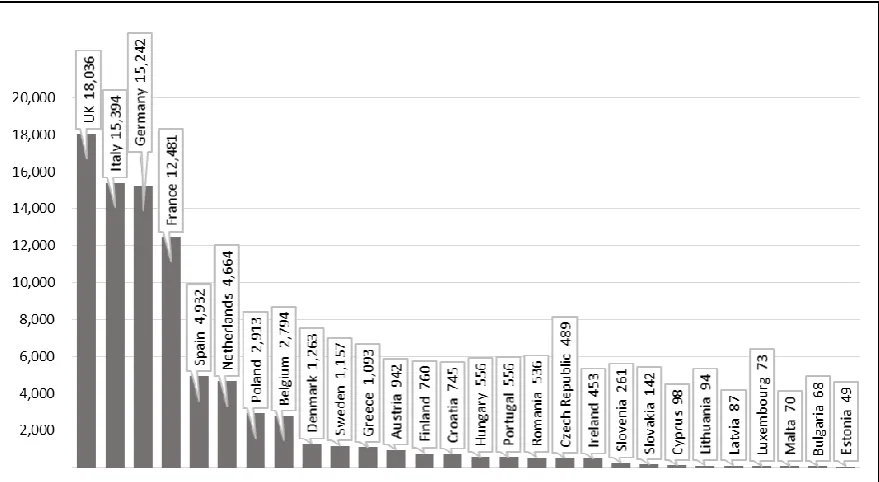
Figure 5. Asbestos cancer deaths at work (GBD 2016)
234
235
236
The International Labour Organization and the European Agency for Safety and Health at Work have
237
estimated the costs of poor safety and health at work. The overall global estimate was equal to 3.94
238
% of the global GDP equalling 2,966,000 million USD. This estimate was made in using the
work-239
related Disability Adjusted Life Years, DALYs as a share of a maximum number of years of gainfully
240
productive worker years if no one was out of work due to occupational injuries and work-related
241
diseases[15]. Asbestos is likely to be the most significant individual occupational risk factor and
242
consequently the most significant component in such economic losses. Using the same method for
243
specific countries and regions one may estimate the losses caused by asbestos related risks.
244
245
Based on the GBD 2016 estimated 85,419 work-related deaths and 1,277 million DALYs [5] in the
246
European Union of 218.3 million workers and an equal number of productive years, the rate :
247
DALY asbestos/Employment years without losses will end up in 0.70 % loss of productive output
248
caused by asbestos at work, which could be compared to the Gross Domestic Product, GDP of the
249
region.
250
251
Equal comparable rate for United States of America using GBD 2016 classification is presented below.
252
USA has a somewhat lower incidence rate, lower loss rate and smaller population while higher GDP
253
per capita:
254
European Union 0.70 % of GDP equal to 114,900 million USD losses by asbestos
255
All WHO region “High income countries” together had an estimated loss of 0.48 % of GDP caused
257
by asbestos risk, while the global rate and losses are significantly lower due to lower asbestos use -
258
so far in the past – and much lower average GDP levels. Comparing countries at different levels of
259
development globally or regionally based on different GDP levels may not be appropriate.
260
261
These estimates were based on lower mesothelioma estimates. Using the latest and higher
262
mesothelioma estimates 38,400 as a proxy for asbestos exposure all these numbers, rates and costs
263
will be higher, see Tables 1 and 2. As a result also asbestos related lung cancer, other cancers and
264
asbestosis death numbers of the high end of the estimate 270,635 would result to corresponding
265
higher DALY level, and higher cost estimate.
266
267
4. Discussion
268
The metrics to appropriately estimate the magnitude of asbestos related disorders are gradually
269
improving and the size of the problem is increasing. Meanwhile “fake news” not based on facts are
270
still actively advocated against all and overwhelming scientific evidence of carcinogenicity of all
271
types of asbestos.
272
273
It is not an easy task to estimate the intangible costs of using asbestos. Production losses are simpler
274
to calculate. However, when applying the Value of Statistical Life (VSL) of 4 million EUR per cancer
275
death used by the European Commission we could arrive at a cost of 410 * 109 USD while the human
276
suffering and loss of life is impossible to quantify. These costs for the European Union 85,419 deaths
277
are much higher than the traditional estimates presented here above. Furthermore, the same VSL case
278
cost could be applied to the global deaths – 222,000 – if based on the conservative GBD 2016 estimate,
279
or the alternative latest estimate of 270,635 in Table 2. This would go far beyond the practice of just
280
looking at the productive losses through DALYs. The earlier presented DALY and productivity loss
281
based estimates are, however, in line with the ILO’s costs estimate method. A detailed study by HSE
282
in United Kingdom on occupational cancer – of which asbestos was the overwhelmingly main cause
283
arrived to a cost in U.K of 12.3 * 109 GBP in 2010 [16]. Lung cancer (£6.8 billion) and mesothelioma
284
(£3.0 billion were the main causes of costs. The method above used for economic costs of occupational
285
cancer and asbestos-related cancer arrived at 18.3*109 USD in 2015 which is practically equal to the
286
result of a detailed study in the U.K. taken the GBP/USD rate and the different years. While the
287
methods were quite different the background information of the magnitude and the numbers of
288
deaths are obviously based on the same sources and research reports [8].
289
290
The numbers and costs are increasing practically in every country and region in the world. Asbestos
291
has been banned in 55 countries but used widely today, some 2,030,000 tons consumed annually
292
according to latest available consumption data. Every 20 tons of asbestos produced and consumed
293
kills a person somewhere in the world. Buying 1kg asbestos in powder format e.g. in Asia costs some
294
0.38 USD and 20 tons would cost 7600 USD. The present asbestos consumption and exposures will
295
cause the negative outcomes some 30-50 years later.
296
297
While banning of asbestos is a simple way to stop future exposures, the management of existing
298
asbestos in buildings and structures and the work to remove of asbestos needs exposure limits. The
299
countries that have banned asbestos tens of years ago. A present commonly used limit of 0.1
301
fibres/cm3 means 100,000 asbestos fibres in one cubic meter m3. Human lungs will easily inhale
302
100,000 asbestos fibres in an hour. An appropriate limit at work would be 1,000 fibres/m3.
303
304
5. Conclusions
305
Present efforts to eliminate this man-made problem and exposures leading to the present
306
epidemiological disaster have been insufficient in most countries in the world. Applying
307
programmes and policies, such as on the elimination of all kind of asbestos use – that is banning of
308
new asbestos use and tight control and management of existing structures containing asbestos – need
309
strengthening and follow up. The present policies and practices need revision and resources. The
310
ILO/WHO Joint Programme for the Elimination of Asbestos-related Diseases needs to be revitalised.
311
Exposure limits do no protect properly against cancer but for asbestos removal and equivalent
312
exposure elimination work we propose a limit value of 1,000 fibres/m3.
313
314
315
Supplementary Materials: The following are available online, Table S1: All estimated asbestos related deaths at
316
work (semi-occupational and non-occupational), Table S2: Comparison of Global Burden of Mesothelioma
317
Deaths (Odgerel et al 2017/ GBD 2016)
318
319
Author Contributions: SF and OC compiled data, analyzed data and produced figures and tables. SF, OC, KT
320
and AD provided comments for manuscript. JT wrote the manuscript.
321
322
Conflicts of Interest: The authors declare no conflict of interest.
323
References
325
326
1. Gloyne, S.R.; Merewether, ERA. Asbestos . In First Supplement of the “Occupation and Health - An
327
Encyclopaedia of Hygiene, Pathology and Social Welfare”. International Labour Office 1938, Vol. I, 999 pp.; Vol. II,
328
1310 pp.
329
2. International Labour Organisation, Asbestos Convention, 1986 (No. 162).
330
http://www.ilo.org/dyn/normlex/en/f?p=NORMLEXPUB:12100:0::NO::P12100_ILO_CODE:C162 Accessed 10
331
March 2018.
332
3. International Labour Organisation, ILO Resolution Concerning Asbestos, 2006 Geneva.
333
http://www.ilo.org/safework/info/standards-and-instruments/WCMS_108556/lang--en/index.htm Accessed 10
334
March 2018.
335
4. Takala, J. Eliminating Occupational Cancer, Editorial, Industrial Health 2015, 53, 307- 309. DOI:
336
10.2486/indhealth.53-307
337
5. GBD 2016 Causes of Death Collaborators. Global, regional, and national age-sex specific mortality for 264
338
causes of death, 1980–2016: a systematic analysis for the Global Burden of Disease Study 2016. Lancet 2017; 390:
339
1151–210. DOI: https://doi.org/10.1016/S0140-6736(17)32152-9
340
6. International Labour Organisation, International Commission of Occupational Health, Workplace Institute
341
of Occupational Health, European Agency for Occupational Safety and Health. Project on Global Estimates of
342
Injuries and Ill-Health at Work and related Cost Estimates: early findings presented at the World Congress on
343
Safety and Health at Work. http://www.icohweb.org/site/news-detail.asp?id=131
344
7. Takala, J; Tan, B.K; Hämäläinen, P. Global Estimates of Occupational Accidents and Work-related Illnesses
345
2017, WSH Institute, Ministry of Manpower of Singapore et al. https://goo.gl/ZFH9un Accessed on 12 March
346
2018.
347
8. Rushton, L; Hutchings, S; Brown, T. The burden of occupational cancer: estimation as the first step to
348
prevention, Occupational & Environmental Medicine 2008, 65 (12),789-800. DOI:
349
http://dx.doi.org/10.1136/oem.2007.037002
350
9. Odgerel, C-O; Takahashi, K; Sorahan, T; Driscoll, T; Fitzmaurice, C; Makoto, Y; Sawanyawisuth, K; Furuya,
351
S; Tanaka, F; Horie, S; von Zandwijk, N; Takala. J. Occup Environ Med 2017, 74, 851–858.
DOI:10.1136/oemed-352
2017-104298 10.1136/oemed-2017-104298
353
10. Takala, J; Hämäläinen, P; Nenonen, N; Takahashi, K; Chimed-Ochir, O; Rantanen, J. Comparative Analysis
354
of the Burden of Injury and Illness at Work in Selected Countries and Regions. Centr. Eur J. Occ & Env Med 2017,
355
23 (1-2), 7-31. http://www.omfi.hu/cejoem/Volume23/Vol23No1-2/23_1-2_Article_01-.pdf
356
11. Takala, J. Eliminating Occupational Cancer in Europe and Globally. ETUI Working Paper 2015.10
357
www.etui.org/Publications2/Working-Papers/Eliminating-occupational-cancerin-Europe-and-globally ,
358
Accessed on 12 March 2018.
359
12. Järvholm, B; Burdorf, A. Emerging evidence that the ban on asbestos use is reducing the occurrence of
360
pleural mesothelioma in Sweden. Scand J. of Public Health 2015, 43, 875–881.
361
http://journals.sagepub.com/doi/pdf/10.1177/1403494815596500
362
13. Health and Safety Executive, HSE. Mesothelioma in Great Britain Mesothelioma mortality in Great Britain
363
1968-2015, U.K. 2017. http://www.hse.gov.uk/statistics/causdis/mesothelioma/mesothelioma.pdf Accessed
364
on 12 March 2018.
365
14. Virta, R. Worldwide Asbestos Supply and Consumption Trends from 1900 through 2003. United States
366
Geological Survey, USA VA 2006. https://pubs.usgs.gov/circ/2006/1298/c1298.pdf Accessed on 12 March 2018.
367
15. Elsler, D; Takala, J; Remes, J. An International Comparison of the Cost or Work-related Accidents and
368
Illnesses. European Agency for Safety and Health at Work. Bilbao, Spain, Oct.2017.
369
https://osha.europa.eu/en/tools-and-publications/publications/int0ernational-comparison-cost-work-related-370
accidents-and Accessed on 10 March 2018.
371
16. Health and Safety Executive, HSE. RR1074 - Costs to Britain of Work-Related Cancer.
372