Research Article
Comparative Analysis of V-Akt Murine Thymoma Viral
Oncogene Homolog 3
(AKT3)
Gene between Cow and Buffalo
Reveals Substantial Differences for Mastitis
Farman Ullah
,
1,2Dinesh Bhattarai,
1Zhangrui Cheng,
3Xianwei Liang,
4Tingxian Deng,
4Zia Ur Rehman,
1,5Hira Sajjad Talpur,
1Tesfaye Worku,
1Rahim Dad Brohi,
1Muhammad Safdar,
1Muhammad Jamil Ahmad,
1Mohammad Salim,
6Momen Khan,
7Hafiz Ishfaq Ahmad,
1and Shujun Zhang
11Key Laboratory of Agricultural Animal Genetics, Breeding and Reproduction, Education Ministry of China,
College of Animal Science and Technology, Huazhong Agricultural University, Wuhan 430070, China
2Faculty of Veterinary and Animal Sciences, Department of Animal Breeding and Genetics, Lasbela University of Agriculture,
Water and Marine Sciences, Uthal, Balochistan, Pakistan
3Department of Pathobiology and Population Sciences, Royal Veterinary College, Hawkshead Lane, Hatfield,
Hertfordshire AL9 7TA, UK
4The Opening Project of Guangxi Key Laboratory of Buffalo Genetics, Reproduction and Breeding, Nanning, Guangxi 530000, China
5Department of Animal Health, Faculty of Animal Husbandry and Veterinary Sciences,
The University of Agriculture, Peshawar, Pakistan
6Department of Forestry and Wildlife Management, The University of Haripur, Khyber Pakhtunkhwa, Pakistan
7Livestock and Dairy Development, Khyber Pakhtunkhwa, Pakistan
Correspondence should be addressed to Shujun Zhang; [email protected]
Received 5 August 2017; Revised 31 December 2017; Accepted 14 January 2018; Published 15 May 2018
Academic Editor: Yudong Cai
Copyright © 2018 Farman Ullah et al. This is an open access article distributed under the Creative Commons Attribution License, which permits unrestricted use, distribution, and reproduction in any medium, provided the original work is properly cited.
AKT3gene is a constituent of the serine/threonine protein kinase family and plays a crucial role in synthesis of milk fats and cholesterol by regulating activity of the sterol regulatory element binding protein (SREBP).AKT3is highly conserved in mammals and its expression levels during the lactation periods of cattle are markedly increased.AKT3is highly expressed in the intestine followed by mammary gland and it is also expressed in immune cells. It is involved in the TLR pathways as effectively as proinflammatory cytokines. The aims of this study were to investigate the sequences differences between buffalo and cow. Our results showed that there were substantial differences between buffalo and cow in some exons and noteworthy differences of the gene size in different regions. We also identified the important consensus sequence motifs, variation in 2000 upstream of ATG, substantial difference in the “3UTR” region, and miRNA association in the buffalo sequences compared with the cow. In addition, genetic analyses, such as gene structure, phylogenetic tree, position of different motifs, and functional domains, were performed to establish their correlation with other species. This may indicate that a buffalo breed has potential resistance to disease, environment changes, and airborne microorganisms and some good production and reproductive traits.
1. Introduction
Buffalo are more defiant to disease and antagonistic sur-roundings compared with cows [1–7]. In the present studies, therefore, we focused on investigating the differences in genomic sequences between buffalo and cow. Livestock are
the main source of animal proteins such as meat, fish, poultry, eggs, and dairy products. They are also considered as the source of draft power in human daily agricultural activities in some areas. In human civilization history, cattle play a vital role while the cattle phylogeny is still debatable. Cattle were the first livestock animal whose full genome Volume 2018, Article ID 1463732, 13 pages
has been mapped [8]. The human whole genome sequence and its importance in the genetic complications have been established. This has contributed to the understanding of the phenotype diversity and disease and provided an approach to sequencing the whole genome of mammals and showing their correlation with human (cattle, buffalo, dogs, pigs, and cats) [9].
AKT family plays key roles in mammary gland devel-opment, lactation, and degradation, and their isoforms are potential candidate genes associated with milk production even though they have some different function [10]. With the advance in new biotechnology and science, it is important to review the genetic variability among and within different species. This measurement could be very supportive for preserving genetic resources.
Buffalo is an important domestic animal in subtropical and tropical areas. However, the mechanism of genes related to mammary gland growth, lactation, and deprivation of lipid metabolism is not fully understood. AKT family is involved in a multiplicity of genetic processes such as counting cell prop-agation, demarcation, angiogenesis, apoptosis, tumor genesis, metabolism, cell survival, growth, glycogen synthesis, and
glucose uptake [11, 12]. AKT3is well expressed in immune
cells and this suggests its involvement in immune process [13]. AKT genes play important roles in mammary gland maturity, lactation, dilapidation, and lipid amalgamation and this indicates its importance in milk production [14]. Asian buffalo has promising characteristics for production as a livestock species with socioeconomic importance. In developing countries the buffalo is mostly used for providing milk and meat for local communities through integrating supply systems.
The buffalo milk has some intrinsic characteristics such as high fat contents which are favorable for cheese production. For example, Mozzarella cheese in Italy is a famous dairy product from buffalo milk. The genomic data resources of buffalo, a “subsequent kith and kin” species of cattle, are not fully established. In regard to evolution, the buffalo and cattle species have close rapport. In comparison to buffalo, the cattle genome is far better characterized. Derived markers of cattle were used initially for buffalo genome maps and potential rearrangements were identified between those species [15]. Nonetheless, the application of cattle genomic tools to buffalo is not frank and, as shown in the outcome, regardless of genome sequences resemblance, the genetic polymorphisms are diverse [16].
The AKT serine/threonine protein kinase, also branded as (PKB) protein kinase B, was reported as the protooncogene v-akt homolog in 1991 [14, 17]. There are three subtypes
of AKT in mammals: AKT1, AKT2, and AKT3, which are
preset by 3 different genes independently, AKTs are the downstream effectors of the PI3K signaling alleyway [18, 19]. To regulate the glucose metabolism balance the PI3K-AKT signal pathway performs a decisive function [20]. Previous studies have reported that, in the fibroblast cell line in mouse, the ATP levels are substantially influenced by the AKT family [21, 22]. Appropriate maturity in bovine mammary tissue is necessary for high milk production. It is an important factor affecting milk production traits.
Therefore, for proper mammary gland development, it is essential to provide appropriate energy supplies which are essential for lactation, degradation, and proper mammary gland development. It is yet not clear how the AKT regulates the above processes in the mammary gland. The AKT expression in mice during late pregnancy was substantially upregulated [23]. Despite functions specific differences in AKT isoforms, all 3 subtypes are imminent entrant genes linked with milk production. A recent study showed that, during lactation periods in cattle, the expression levels of
AKT1andAKT3were markedly increased [10]. In addition,
the synthesis of breast milk fat and cholesterol are affected by the changes in AKT. AKT family contributes to numerous disorders such as inflammation and ischemia [24]. Experi-mental autoimmune encephalomyelitis, which plays a role in central nervous system and immune system susceptibility, is
regulated byAKT3. The previous studies show that the
iso-topeAKT3of the AKT family is involved in various functions.
We hypothesized that, compared with cows, buffalo have more potential characteristics toward resistance to mastitis disease and adverse environmental conditions, which may account for these species unambiguous differences.
Our bioinformatics analysis unraveled a few but actually
decisive, preset, and noteworthy differences ofAKT3gene
between buffalo and cattle. The results of this study will provide important information to strength and elicit genome structure, metabolism, and physiology differences between species and their evolution.
2. Materials and Methods
2.1. In Silico and Bioinformatics Analysis
2.1.1. Data Structure. The AKT3gene sequences of buffalo
(NW 005783781.1) and cattle (AC 000173.1) were selected from the database of National Center for Biotechnology Information (NCBI https://www.ncbi.nlm.nih.gov/gene/?term=akt3) [25].
Bioinformatics approach was used to target the 5-upstream
region, 5UTR region, coding regions, and “3UTR” region
for the differences in the AKT3gene between buffalo and
cattle. The 5-upstream region and “5UTR” region are
important for the promoter sequences, transcription starting sites (TSS), and CPG island prediction and differences in buffalo and cow. The coding region is important for the
single nucleotides polymorphism sites. The “3UTR” region
is concerned with the prediction and differences of miRNA in buffalo and cattle. The bioinformatics tools including fruit fly, cbs, ebi, mirbase, smart, and pfam were used for different
regions ofAKT3differences between buffalo and cow.
2.2. Promoter Prediction, Transcription Starting Sites (TSS),
and CPG Island Prediction. The promoter sequences
the tool in http://www.cbs.dtu.dk/services/Promoter/ was used. These consensus sequences motifs have key role in the gene transcription and expression. The CPG islands in buffalo and cow were predicted using MethPrimer (http://www.urogene.org/methprimer/) and the tools pro-vided in https://www.ebi.ac.uk/Tools/emboss/cpgplot/ [26].
2.3. Sequences Similarity, miRNA Prediction, and
Protein-Protein Interaction. For the sequences similarity and
mRNA analysis, we performed the highly similar sequence (megaBLAST) analysis. NCBI blast tools were used (https:// blast.ncbi.nlm.nih.gov/Blast.cgi). The tool of mirbase (http:// www.mirbase.org/search.shtml) was used for the prediction
of miRNA in “3UTR” region in buffalo and cow. We used an
NCBI blasting tool (https://blast.ncbi.nlm.nih.gov/Blast.cgi) to compare the differences between buffalo and cow in their
“3UTR” region. We also used research tool for
protein-protein interaction for the buffalo and cow provided in https://www.string-db.org/. It was also used to determine the proteins and protein interactions in both buffalo and cows.
2.4. Protein Structure and Domains Prediction. The in silico
analysis was carried out for the protein structure and domain prediction in both buffalo and cow. The different bioinformatics research tools were used, including http://smart.embl-heidel-berg.de/smart/change mode.pl, http://smart.embl-heidelberg .de/help/smart about.shtml [27], http://pfam.xfam.org/search/ sequence [28], https://www.ebi.ac.uk/services, https://prosite .expasy.org/, and https://www.ncbi.nlm.nih.gov/Structure/ cdd/wrpsb.cgi.
2.5. Alignment, Phylogenetic Tree, Motifs and Gene Structure,
Proximal Control, and Core Promoters. The alignments and
phylogenetic trees were performed in twenty different species to establish their association and evolutionary relationship with these animals for the same gene. The evolutionary tree is designed by MEGA6 or fig tree in Gene Doc software [29]. The gene structure display server program (GSDS) was used for gene structure analysis [30]. To display the motifs in these species and analyze the proximal control elements and core promoters, we used the MEME 4.10.1 program [31]. GC box or GSG box is a nucleotides distinct pattern regulatory transcriptional cis-acting element in the promoter region. The proximal control elements restrain GC box (GGGCG) and CAAT box (GCCCAATCT). The core promoters included TSS and TAATA box (TATAAA).
3. Results and Discussion
The AKT3 size is 287 kb and 265 kb in buffalo (locus
NW 005783781, 286082 bp) and cow (locus NC 007314, 267865 bp), respectively, and they are located on chromo-some 16. AKT in humans and mice were adaptable bustle of the sterol regulatory element binding protein (SREBP), which influences the production of breast milk fat and cholesterol [32–35]. In regard to mammary gland of mice, regulation of SREBP by AKT is through two possible pathways, both of which escort to boost in nuclear SREBP.
AKT family is involved in a variety of biological processes. AKT plays a role in relocation of juvenile SREBPS through promoting the coat protein toward the golgi from the endo-plasmic reticulum and/or inhibiting the glycogen synthesis
kinase-3𝛽phosphorylation [36]. Integrity of CNS cell and T
cell function regulation require the presence ofAKT3.AKT3
is expressed in immune cells [13]. For controlling cell number
and size, theAKT3was required [37]. In the PI3K pathway
AKT isotopes are the crucial signaling molecules which regulate cell growth, proliferation, survival, and metabolism [13]. For tackling diseases, their immunity related functions are important [38, 39]. AKT is also involved in the regulation of inflammatory cytokines with proinflammatory property as shown in the TLR signaling pathway. The functional important genes related to TLR pathway contain markers in breeding selection [40].
3.1. Cow and Buffalo Sequences Similarity. We have analyzed
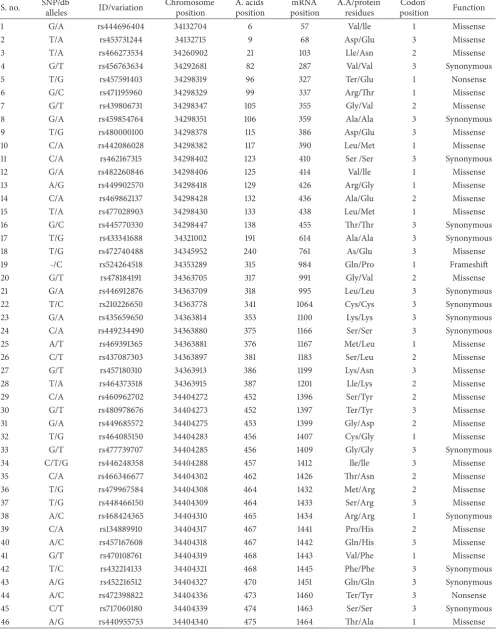
the sequencing data of cattle to identify the SNPs through the databases from NCBI and Ensembl. Data in Table 1 were synchronized with the SNPs list for measurement and analysis. The buffalo SNPs data are not available in any database for harmonization with the relevant SNPs records.
In Figure 1, the typescript of AKT3 for cow and buffalo
in interval (exons 5 to 3) is available in databases. In
Figure 1(a), there are 13 exons in cow and buffalo which show substantial differences in the cow and buffalo in exon size in exons numbers 1, 2, and 13.
The coding lengths between cow and buffalo are different in the 1 and 2 coding regions. There is no coding sequence in region 1 in buffalo while the 2 coding regions in cow are longer than those in buffalo, indicating substantial differences. The intron size shows substantial differences on region 1 and 2. In the exon number 13, no coding regions were detected in both species. In region 1, the intron size in cow is four times that of buffalo, while on region 2, in the buffalo, the intron size is two times larger than that in cow. Total size of annotated spliced exon in the buffalo is threefold larger than that in the cow while there are more annotated amino acids in the cow, indicating substantial differences. The total gene size followed similar patterns as above. In the cow, it is sized at 265 kb while in the buffalo its size is 287 kb, which
shows that buffalo have a larger size of AKT3 gene. The
Table 1: SNPs list of cow AKT3 reported on NCBI and Ensembl databases.
S. no. SNP/db
alleles ID/variation
Chromosome position
A. acids position
mRNA position
A.A/protein residues
Codon’
position Function
1 G/A rs444696404 34132704 6 57 Val/lle 1 Missense
2 T/A rs453731244 34132715 9 68 Asp/Glu 3 Missense
3 T/A rs466273534 34260902 21 103 Lle/Asn 2 Missense
4 G/T rs456763634 34292681 82 287 Val/Val 3 Synonymous
5 T/G rs457591403 34298319 96 327 Ter/Glu 1 Nonsense
6 G/C rs471195960 34298329 99 337 Arg/Thr 1 Missense
7 G/T rs439806731 34298347 105 355 Gly/Val 2 Missense
8 G/A rs459854764 34298351 106 359 Ala/Ala 3 Synonymous
9 T/G rs480000100 34298378 115 386 Asp/Glu 3 Missense
10 C/A rs442086028 34298382 117 390 Leu/Met 1 Missense
11 C/A rs462167315 34298402 123 410 Ser /Ser 3 Synonymous
12 G/A rs482260846 34298406 125 414 Val/lle 1 Missense
13 A/G rs449902570 34298418 129 426 Arg/Gly 1 Missense
14 C/A rs469862137 34298428 132 436 Ala/Glu 2 Missense
15 T/A rs477028903 34298430 133 438 Leu/Met 1 Missense
16 G/C rs445770330 34298447 138 455 Thr/Thr 3 Synonymous
17 T/G rs433341688 34321002 191 614 Ala/Ala 3 Synonymous
18 T/G rs472740488 34345952 240 761 As/Glu 3 Missense
19 -/C rs524264518 34353289 315 984 Gln/Pro 1 Frameshift
20 G/T rs478184191 34363705 317 991 Gly/Val 2 Missense
21 G/A rs446912876 34363709 318 995 Leu/Leu 3 Synonymous
22 T/C rs210226650 34363778 341 1064 Cys/Cys 3 Synonymous 23 G/A rs435659650 34363814 353 1100 Lys/Lys 3 Synonymous 24 C/A rs449234490 34363880 375 1166 Ser/Ser 3 Synonymous
25 A/T rs469391365 34363881 376 1167 Met/Leu 1 Missense
26 C/T rs437087303 34363897 381 1183 Ser/Leu 2 Missense
27 G/T rs457180310 34363913 386 1199 Lys/Asn 3 Missense
28 T/A rs464373518 34363915 387 1201 Lle/Lys 2 Missense
29 C/A rs460962702 34404272 452 1396 Ser/Tyr 2 Missense
30 G/T rs480978676 34404273 452 1397 Ter/Tyr 3 Missense
31 G/A rs449685572 34404275 453 1399 Gly/Asp 2 Missense
32 T/G rs464085150 34404283 456 1407 Cys/Gly 1 Missense
33 G/T rs477739707 34404285 456 1409 Gly/Gly 3 Synonymous 34 C/T/G rs446248358 34404288 457 1412 lle/lle 3 Missense
35 C/A rs466346677 34404302 462 1426 Thr/Asn 2 Missense
36 T/G rs479967584 34404308 464 1432 Met/Arg 2 Missense
37 T/G rs448466150 34404309 464 1433 Ser/Arg 3 Missense
38 A/C rs468424365 34404310 465 1434 Arg/Arg 1 Synonymous
39 C/A rs134889910 34404317 467 1441 Pro/His 2 Missense
40 A/C rs457167608 34404318 467 1442 Gln/His 3 Missense
41 G/T rs470108761 34404319 468 1443 Val/Phe 1 Missense
42 T/C rs432214133 34404321 468 1445 Phe/Phe 3 Synonymous 43 A/G rs452216512 34404327 470 1451 Gln/Gln 3 Synonymous
44 A/C rs472398822 34404336 473 1460 Ter/Tyr 3 Nonsense
45 C/T rs717060180 34404339 474 1463 Ser/Ser 3 Synonymous
5000
4000
3000 400
200
0
Ex
o
n
len
gt
h in b
p
1 2 3 4 5 6 7 8 9 10 11 12 13
Cow Buffalo
(a)
1 2 3 4 5 6 7 8 9 10 11 12 13
Cow Buffalo
300
200
100
0
C
o
din
g r
egio
n len
gt
h (b
p)
(b)
1 2 3 4 5 6 7 8 9 10 11 12 13
Cow Buffalo
200000 180000 160000 140000 120000 100000 30000
20000
10000
0
In
tr
o
n
len
gt
h (b
p)
(c)
Cow Buffalo
400000
200000
6000 4000 2000 400 200 0
L
en
gt
h (b
p)
TASE AAA AKT3
(d)
Figure 1: Length ofAKT3gene, exons, and introns in both cow and buffalo. (a) Cow and buffalo 13 exons length (bp). (b) Comparing cow and buffalo coding length (bp) of 13 regions. (c) Intron length (bp) of cow and buffalo. (d) Total length of annotated spliced exon ofAKT3, annotated amino acids, andAKT3gene for cow and buffalo.
A total of 13 exons were found in the cow and buffalo for
AKT3 gene. We performed the high similarity sequence
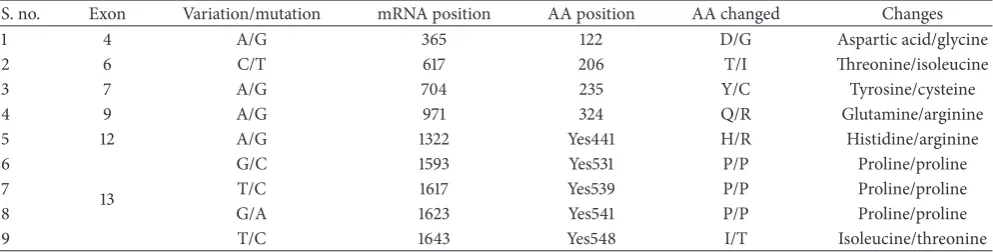
(megaBLAST) analysis of the exon one by one between cow and buffalo using NCBI blast tool (https://blast.ncbi.nlm.nih .gov/Blast.cgi). In total, we found the substantial differences in 6 out of 13 exons between cow and buffalo. The important differences in exons 4, 6, 7, 9, 12, and 13 have been found between cow and buffalo. Each of the first 5 exons has one amino acid difference while exon 13 has four amino acid differences in its sequence between cow and buffalo. To confirm these findings, we carried out the high similarity sequence (megaBLAST) analysis for the mRNA between cow and buffalo using an NCBI blast tool, (https://blast.ncbi.nlm .nih.gov/Blast.cgi?PROGRAM=blastx&PAGE TYPE=Blast-Search&LINK LOC=blasthome). This derived the same result we have obtained in the exons (Table 2). Our study
highlighted the substantial differences ofAKT3gene between
the cow and buffalo.
In addition to determination of the substantial differences
in cow and buffalo forAKT3gene, our results suggest that
there is a difference in position for the genome between
buffalo and cow, which may be important for coexpression of the gene. These findings provided information for enhancing tolerance toward disease, stress, and so forth although they may differ between genotypes.
3.2. Prediction of Promoters, Proximal Control, Core
Pro-moters, and Other Consensus Sequence Motifs. Gene
net-work analyses assist in the classification of genes that have pleiotropic effects and/or regulatory roles [41]. The environ-ments and their change in adopting new function of genes have important correlation as the genes were commonly diversified during evolution period of multigene families, which facilitates the evolutionary cooption of genes [42]. For the measurement accuracy, we took 2000 bp of the upstream
from the starting ATG of theAKT3gene of cow and buffalo.
Table 2: List of substantial differences between cow and buffalo in exon regions, traced by mRNA sequences of cow and buffalo for confirmation.
S. no. Exon Variation/mutation mRNA position AA position AA changed Changes
1 4 A/G 365 122 D/G Aspartic acid/glycine
2 6 C/T 617 206 T/I Threonine/isoleucine
3 7 A/G 704 235 Y/C Tyrosine/cysteine
4 9 A/G 971 324 Q/R Glutamine/arginine
5 12 A/G 1322 Yes441 H/R Histidine/arginine
6
13
G/C 1593 Yes531 P/P Proline/proline
7 T/C 1617 Yes539 P/P Proline/proline
8 G/A 1623 Yes541 P/P Proline/proline
9 T/C 1643 Yes548 I/T Isoleucine/threonine
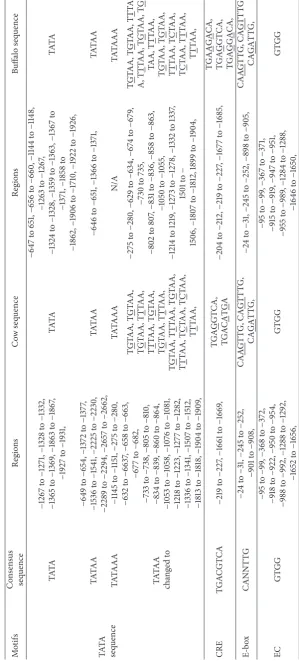
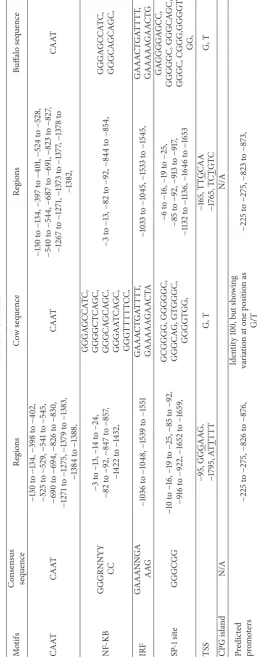
DNA promoter sequences helps identify other molecules for starting transcription and the positions where the genetic sequence can be read and decoded. The TATAA was found in the cow in six different regions while in the buffalo it was found in two different regions only. The TATAAA was found in two different positions in the cow sequence while it was absent in the buffalo sequence. The TATAA changed in the cow sequence found in 15 different regions with change
of TAT>TNT as G, T, and C were counted as 7, 6, and 2,
respectively. In the buffalo its G, T, and C counts were 6, 6 and 2, respectively, in 14 regions. DNA sequence sandwiching is known as floxing between two loxP sites. The cyclic adenosine monophosphate responsive elements (CRE) occur in cow at
two different regions with C>G and A. These are found in
three different regions in buffalo sequence with C>G and
A, with 2 and 1 times occurring, respectively. Enhancer box (CANNTTG) is also very important in eukaryotes as it acts as binding molecule with AST2. Enhancer box (E-box) is a short region of DNA and play keys roles in the regulation of gene expression in tissues such as muscles, neurons, and others acting as protein binding sites. In both cow and buffalo, there are two E-boxes in the same position while the other is located at different position. We showed the AG, GT, and GA, in occurrence of the NN replacement. The enhancer core GTGG is also available in the cow and buffalo sequences at different positions and repeats 7 times in sequences of both species. A DNA sequence of cis-regulatory is known as enhancer core (EC) and plays key role in gene expression with cluster of transcription. EC is important in the development of thymocyte and macrophage as observed in the transgenic studies of animal. It is expressed in a variety of tissues [43]. Nucleotides sequence has distinct patterns and is involved in regulatory process, which is known as CAAT box. CAAT box was found in both species at different positions. NF-KB (nuclear factor-kappa B) is involved in many normal cellular and organismal processes, such as developmental process, immune and inflammatory response, and apoptosis. NF-KB sequence (GGGRNNYYCC) is found in the species at different positions. It appeared five times in cow and two times in buffalo sequences with substantial variation. Interferon regulatory factor having N-terminal is located at a conserved region and plays a key role in activation or repressor of transcription. The sequence of IRF (interferon
regulatory factor 3, GAAANNGAAAG) is also found with substantial variation in position and sequences between cow and buffalo.
Transcription factors SP1/specificity protein plays a key role in transcription activation or repressing. The sequence motifs of sp-1 (special protein binding site; sp-1 GGGCGG) occurred five times in cow and six times in buffalo sequence with important variation in position. Transcription starting site (TSS) occurred two times in the sequences of cow and buffalo at different positions. Transcription starting sites are near to the promoters which help with initiation of transcription for a particular gene. No CPG island is found in the sequences of cow and buffalo. CPG island is the DNA short stretch which is found in the upstream regions, where the sequence CG frequency is higher than others and greater than 50%, and ranges are counted when Obs/Exp value is greater than 0.6. The promoters are predicted in this region at two positions with one in the same position and the
other in different region and substantial variation with G>T.
These important consensus sequences motifs and variation observed for the promoter of cow and buffalo are shown in Table 3.
3.3. The Importance of Upstream Sequences and Their
Varia-tion between Cow and Buffalo. The important genes under
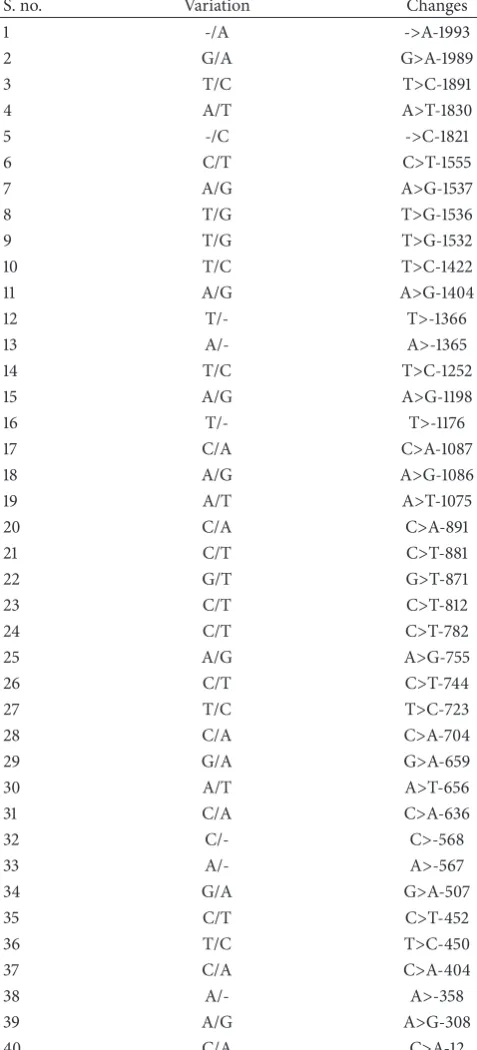
study might be expressed, with substantial high variation in the starting ATG to upstream sequences in cow and buffalo. We observed and analyzed them with NCBI database (https://blast.ncbi.nlm.nih.gov/Blast.cgi?PAGE=MegaBlast& PROGRAM=blastn&BLAST PROGRAMS=megaBlast&PAGE TYPE=BlastSearch&BLAST SPEC=blast2seq&DATABASE= n/a&QUERY=&SUBJECTS) and found some noteworthy variation in both species. They are presented in Table 4. Sequencing blast results of the cow and buffalo show 98% similarity but with variations at 40 positions of alleles. These may be associated with the transcription initiation and gene expression in different species with sequences variation and their function regulation.
3.4. miRNA Prediction. The “3UTR” regions of the cow and
Table 4: List of variations found in the 2000 bp of the cow and buffalo in the upstream region from starting ATG.
S. no. Variation Changes
1 -/A ->A-1993
2 G/A G>A-1989
3 T/C T>C-1891
4 A/T A>T-1830
5 -/C ->C-1821
6 C/T C>T-1555
7 A/G A>G-1537
8 T/G T>G-1536
9 T/G T>G-1532
10 T/C T>C-1422
11 A/G A>G-1404
12 T/- T>-1366
13 A/- A>-1365
14 T/C T>C-1252
15 A/G A>G-1198
16 T/- T>-1176
17 C/A C>A-1087
18 A/G A>G-1086
19 A/T A>T-1075
20 C/A C>A-891
21 C/T C>T-881
22 G/T G>T-871
23 C/T C>T-812
24 C/T C>T-782
25 A/G A>G-755
26 C/T C>T-744
27 T/C T>C-723
28 C/A C>A-704
29 G/A G>A-659
30 A/T A>T-656
31 C/A C>A-636
32 C/- C>-568
33 A/- A>-567
34 G/A G>A-507
35 C/T C>T-452
36 T/C T>C-450
37 C/A C>A-404
38 A/- A>-358
39 A/G A>G-308
40 C/A C>A-12
RNAs that play important role in degradation/translation repression, RNA silencing, pathway synthesis, and regulatory
process. The “3UTR” regions in the cow and buffalo are also
analyzed for miRNA prediction; the results are illustrated in Table 5 and variation is illustrated in Figure 2. These predictions will explore the variation and differentiation
between cow and buffalo for gene function and expression.
The “3UTR” region in cow is 295 bp while it is much bigger
in buffalo, 5072 bp. Translation termination codon follows immediately by section of messenger RNA (mRNA) and there
are three prime untranslated regions (“3UTR”) in molecular
genetics.
3.5. Protein-Protein Interaction, Structure, and Domain.
Protein-protein interactions (PPIs) through highly estab-lished physical contact and interaction are important for prediction and modulation of the function, activity, and drug ability of the target protein. In PPI of the cow and buffalo, we found different types of indication and interaction. Some of the proteins are known, with predicted 3D structure. Some of the node/protein query indications show the first shell and second shell of interactions. While some of them show the interactions from curated databases and are experimentally determined, the rest of them show the predicted interactions of gene neighborhood, gene fusions, and gene cooccurrences. Some others show text mining, coexpression, and protein homology. The results of PPI were shown in Figure 3 and the data in Supplementary Table 1. There are so many domains found in the cow and buffalo protein sequences with different interval and E values, and some of them are hit by profiles or by patterns (Supplementary Table 2). They have two types of functions. Protein phosphorylation is biological process and the molecular function, which are characterized in three categories (protein kinase activity, protein serine/threonine kinase activity, and ATP binding). Some software tools show that their predicted features are ATP, protein kinase, and protein acceptor.
3.6. Phylogenetic, Alignment, Structural, and Motif Analysis of
AKT3 Gene. Multiple sequence alignment (MSA) is a
tech-nique of bioinformatics to find out the region of important similarity in different sequences, which may indicate the evolutionary, structural, and functional relationship in the biological sequences and homologous regions of different sequences. Phylogenetic analysis and a MSA were performed using quick tree. The evolutionary tree is finally designed with MEGA6 or FigTree. Phylogeny or evolutionary tree or phylo-genetic tree is a branching diagram based on the information of difference and similarity, genes from common ancestor, and evolutionary relationship among various species. In this analysis we used the proteins sequences from 20 different species. The similarity of the different species was described in Supplementary Figure 1. This shows different similarity score, in the way of assessing the evolutionary liaison of
AKT3by means of further genus, neighbor-joining methods
used for constructed phylogenetic trees based on amino acid
sequencing of AKT3. The phylogenetic trees showed the
different group of species with close genetic relationships.
The AKT3 was much conserved in different species and
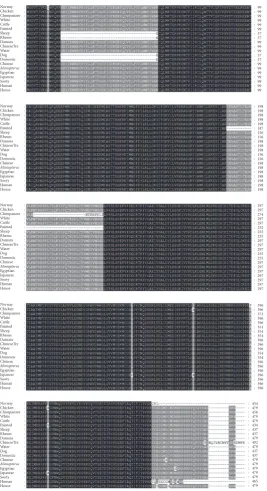
clustered in different groups. Based on the phylogenetic tree, the multiple alignments are also performed for these 20 different species and the results are shown in Figure 4. We have analyzed in depth the structure, distribution, and
Table 5: List of miRNA predicted in the “3UTR” region of cow and buffalo.
S. no. Accession ID Query start Query end Subject start Subject end Strand Score 𝐸value Alignment Species 1 Mimat0024577 bta-miR-574 163 184 2 23 − 65 5.4 Align
Cow 2 Mimat0012060 bta-miR-2470 103 118 6 21 − 62 9.7 Align
1 Mimat0011984 bta-miR-1814c 932 949 3 20 + 72 5.1 Align
Buffalo 2 Mimat0024577 bta-miR-574 162 184 2 24 − 70 7.4 Align
3 Mimat0012021 bta-miR-2444 538 554 4 20 − 76 2.3 Align 4 Mimat0011874 bta-miR-1814a 533 548 5 20 − 71 6.1 Align 5 Mimat0011946 bta-miR-2393 533 548 5 20 − 71 6.1 Align 6 Mimat0012011 bta-miR-2437 533 553 1 21 − 69 9.0 Align 7 Mimat0011934 bta-miR-2325c 380 399 1 20 + 73 4.2 Align 8 Mimat0011943 bta-miR-2390 381 400 1 20 + 73 4.2 Align 9 Mimat0012011 bta-miR-2437 377 397 1 21 + 69 9.0 Align
Cow Buffalo
Cow Buffalo
Cow Buffalo
Cow Buffalo
Cow Buffalo
GTCTCTTTACTTCTGCTACTTCACTGTCATCTTAGGTTTATTACTGAAAATGATTCCTGG
GTCTCTTTACTTCTGCTACTTCACTGTCATCTTAGGTTTATTACTGAAAATGATTCCTGG
ACATCACAGCAGTCCTAACTCTTACAAATGCAGGAGCACCTTCAGACATCCCAGACCAGT
ACATCACAGCAGTCCTAACTCTTACAAATGCAGGAGCACCTTCAGACATCCGAGACCAGT
CCAAGGTCTTCACCCCTCGCCACCTTTCACCCACATGAGAACACACATATACGCAGACAC
CCAAGGTCTTCACCCTTCGCCGCCTTTCACCCACATGAGAATACACATATACGCAGACAC
ACTCGACATTTTTGTTTTTGCATGAAATTGTATCTCAGTCTAAGGTCTCATGCTGTTGCT
ACTCGACATTTTTGTTTTTGCATGAAATTGTATCTCAGTCTAAGGTCTCATGCTGTTGCT
GCTACTGTCTTACTATTATAGCAACTTTAAGAGGTAATTTTACAATCTTTGAAAG
GCTACTGTCTTACTATTATAGCAACTTTAAGAGGTAATTTTACAATCTTTGAAAG
Figure 2: Comparing “3UTR” of cow and buffalo and their variation observed in the sequences.
FOXO1
FOXO3
PTEN
PIK3CB AKT3
RICTOR
TSC1
TSC2
MTOR
PIK3CA
ILK
Figure 3: Protein-protein interaction of cow and buffaloAKT3gene.
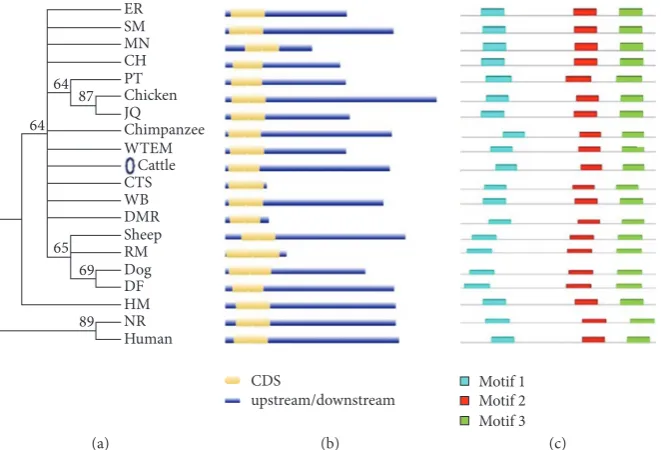
according to the phylogenetic relationship and the results are given in Figure 5(b). Pattern of widespread amino acids or nucleotide sequence with biological importance is called motifs. To examine the diverse structure of AKT3 protein, we used the MEME program supported by InterPro subsequent annotation. The conserved motifs were identified in all tested species. The conserved motifs are displayed and each is represented by colored box and the nonconserved sequence is presented by black lines (Figure 5(c)). The CPG island was
also checked for both cow and buffalo forAKT3gene and the
results are shown (Supplementary Figure 2).
4. Conclusion
Our findings show that there are substantial differences of
Norway Chicken Chimpanzee White Cattle Painted Sheep Rhesus Damara ChineseTre Water Dog Domestic Chinese Miniopterus Miniopterus Miniopterus Miniopterus Miniopterus Egyptian Japanese Sooty Human House : : : : : : : : : : : : : : : : : : : : : : : : : : : : : : : : : : : : : : : : Norway Chicken Chimpanzee White Cattle Painted Sheep Rhesus Damara ChineseTre Water Dog Domestic Chinese Egyptian Japanese Sooty Human House : : : : : : : : : : : : : : : : : : : : : : : : : : : : : : : : : : : : : : : : Norway Chicken Chimpanzee White Cattle Painted Sheep Rhesus Damara ChineseTre Water Dog Domestic Chinese Egyptian Japanese Sooty Human House : : : : : : : : : : : : : : : : : : : : : : : : : : : : : : : : : : : : : : : : Norway Chicken Chimpanzee White Cattle Painted Sheep Rhesus Damara ChineseTre Water Dog Domestic Chinese Egyptian Japanese Sooty Human House : : : : : : : : : : : : : : : : : : : : : : : : : : : : : : : : : : : : : : : : Norway Chicken Chimpanzee White Cattle Painted Sheep Rhesus Damara ChineseTre Water Dog Domestic Chinese Egyptian Japanese Sooty Human House : : : : : : : : : : : : : : : : : : : : : : : : : : : : : : : : : : : : : : : : 99 99 99 99 99 99 99 99 99 99 99 99 99 99 99 99 57 57 57 57 198 198 198 198 198 198 198 198 187 156 156 198 198 198 198 198 198 198 156 156 297 297 297 297 297 297 297 297 297 297 297 297 297 297 274 252 255 255 255 255 396 396 396 396 396 396 396 396 396 396 396 396 396 396 373 351 354 354 354 354 454 479 479 479 456 479 479 479 479 479 479 434 437 437 437 437 479 479 492 465
Figure 4: A multiple sequence alignment (MSA) ofAKT3gene in 20 different species. The different color shows the conserved regions in 20 different species. The deep black strip lines which consist of mixtures of colors of green, red, yellow, and so on indicate high intensity with 100% conserved region similarity, the light black color indicates more than 75% intensity of conserved region in these species, and the white color shows 50% of conserved region similarity.
This may, at least in part, explain the variation, potential resis-tance, and higher immunity against hostile environments and diseases in buffalo compared with that in cows. Their
upstream of the ATG, “3UTR,” and CDS are substantially
different which may be related to the differences in initiation of transcription and gene expression in different tissues. The important consensus sequences motifs differences have been found between the buffalo and cow at different positions.
The gene structures are also substantially different between buffalo and cow. Our study provided information for genetics selection for disease and environment resistance in these species although other factors should be considered. Fur-ther studies, such as association of these differences and variation with disease and environment resistance between
buffalo and cow forAKT3gene, are required to confirm our
ER SM MN CH PT Chicken JQ Chimpanzee WTEM
Cattle CTS WB DMR Sheep RM Dog DF HM NR Human 64
87
64
65 69
89
CDS
upstream/downstream
(a) (b) (c)
Motif 1 Motif 2 Motif 3
Figure 5: Phylogenetic relationship, gene structure, and motifs composition ofAKT3gene in 20 different species. (a) Phylogenetic trees by the neighbor-joining method constructed by the multiple alignments of 20 full length proteins ofAKT3gene with the MEGA 6.0 software. (b) Gene structure for 20 different species using GSDS. (c) Schematic conserved motifs representation of theAKT3gene by MEME software tool. Each motif is represented by a colored box. The nonconserved sequences are represented by black line.
Conflicts of Interest
The authors declare that there are no conflicts of interest regarding the publication of this paper.
Acknowledgments
The authors are grateful for the financial assistance by the project Research Platform Construction of the Ministry of Agriculture International Exchange and Cooperation in Science and Technology and the Opening Project of Guangxi Key Laboratory of Buffalo Genetics, Reproduction and Breeding (SNKF-2016-01).
Supplementary Materials
The supplementary file contains two supplementary figures and two supplementary tables. Supplementary Figure 1:
phylogenetic relationship of 20 different species for theAKT3
gene. Supplementary Figure 2: CPG island for the AKT3
gene in buffalo and cow using two different software tools. Supplementary Table 1: predicted protein-protein interaction
of cow and buffalo AKT3. Supplementary Table 2: list of
predicted domains in cow and buffalo for AKT3 gene.
(Supplementary Materials)
References
[1] M. S. Qureshi, G. Habib, H. A. Samad, M. M. Siddiqui, N. Ahmad, and M. Syed, “Reproduction-nutrition relationship in dairy buffaloes. I. Effect of intake of protein, energy and blood metabolites levels,”Asian-Australasian Journal of Animal Sciences, vol. 15, no. 3, pp. 330–339, 2002.
[2] R. Tiwari, M. C. Sharma, and B. P. Singh, “Buffalo calf health care in commercial dairy farms: a field study in Uttar Pradesh (India),”Livestock Research for Rural Development, vol. 19, no. 3, article 8, 2007.
[3] C. Thomas,Efficient Dairy Buffalo Production, De Laval Inter-national AB, Tumba, Sweden, 2008.
[4] M. Sarwar, M. A. Khan, M. Nisa, S. A. Bhatti, and M. A. Shahzad, “Nutritional management for buffalo production,”
Asian-Australasian Journal of Animal Sciences, vol. 22, no. 7, pp. 1060–1068, 2009.
[5] G. K. Deb, T. N. Nahar, P. G. Duran, and G. A. Presicce, “Safe and sustainable traditional production: the water buffalo in Asia,”
Frontiers in Environmental Science, vol. 4, article 38, 2016. [6] R. Sengupta, A. Gupta, and J. Dutta, “Multi-objective
optimiza-tion,” inDecision Sciences: Theory and Practice, pp. 145–184, CRC Press, 2016.
[7] G. A. Presicce,The Buffalo (Bubalus bubalis)—Production and Research, Bentham Science Publishers, 2017.
[8] D. Brown, “Scientists unravel genome of the cow. Sign of human intervention seen,”Washington Post, 2009.
[9] K. Soini, U. Ovaska, and J. Kantanen, “Spaces of conservation of local breeds: the case of yakutian cattle,”Sociologia Ruralis, vol. 52, no. 2, pp. 170–191, 2012.
[10] M. Bionaz and J. J. Loor, “Gene networks driving bovine mammary protein synthesis during the lactation cycle,” Bioin-formatics and Biology Insights, vol. 5, pp. 83–98, 2011.
[11] B. D. Manning and L. C. Cantley, “AKT/PKB signaling: navigat-ing downstream,”Cell, vol. 129, no. 7, pp. 1261–1274, 2007. [12] J. A. Engelman, J. Luo, and L. C. Cantley, “The evolution
[13] V. Tsiperson, R. C. Gruber, M. F. Goldberg et al., “Sup-pression of inflammatory responses during myelin oligo-dendrocyte glycoprotein-induced experimental autoimmune encephalomyelitis is regulated by AKT3 signaling,”The Journal of Immunology, vol. 190, no. 4, pp. 1528–1539, 2013.
[14] C. Wu, L. Liu, J. Huo et al., “Molecular characterization of the encoding regions and tissue expression analyses for 3 novel buffalo AKT genes, AKT1, AKT2, and AKT3,”Turkish Journal of Biology, vol. 38, no. 1, pp. 63–75, 2014.
[15] M. E. J. Amaral, J. R. Grant, P. K. Riggs et al., “A first generation whole genome RH map of the river buffalo with comparison to domestic cattle,”BMC Genomics, vol. 9, article 631, 2008. [16] G. M. F. de Camargo, R. R. Aspilcueta-Borquis, M. R. S.
Fortes et al., “Prospecting major genes in dairy buffaloes,”BMC Genomics, vol. 16, no. 1, article 872, 2015.
[17] A. Bellacosa, J. R. Testa, S. P. Staal, and P. N. Tsichlis, “A retroviral oncogene, akt, encoding a serine-threonine kinase containing an SH2-like region,”Science, vol. 254, no. 5029, pp. 274–277, 1991.
[18] M. Burgering and P. J. Coffer, “Protein kinase B (c-Akt) in phosphatidylinositol-3-OH kinase signal transduction,”Nature, vol. 376, no. 6541, pp. 599–602, 1995.
[19] T. F. Franke, S. I. Yang, T. O. Chan et al., “The protein kinase encoded by the Akt proto-oncogene is a target of the PDGF-activated phosphatidylinositol 3-kinase,”Cell, vol. 81, no. 5, pp. 727–736, 1995.
[20] I. Hers, E. E. Vincent, and J. M. Tavar´e, “Akt signalling in health and disease,”Cellular Signalling, vol. 23, no. 10, pp. 1515–1527, 2011.
[21] K. Gottlob, N. Majewski, S. Kennedy, E. Kandel, R. B. Robey, and N. Hay, “Inhibition of early apoptotic events by Akt/PKB is dependent on the first committed step of glycolysis and mitochondrial hexokinase,”Genes & Development, vol. 15, no. 11, pp. 1406–1418, 2001.
[22] A. Hahn-Windgassen, V. Nogueira, C.-C. Chen, J. E. Skeen, N. Sonenberg, and N. Hay, “Akt activates the mammalian target of rapamycin by regulating cellular ATP level and AMPK activity,”
The Journal of Biological Chemistry, vol. 280, no. 37, pp. 32081– 32089, 2005.
[23] L. A. Chodosh, H. P. Gardner, J. V. Rajan, D. B. Stairs, S. T. Marquis, and P. A. Leder, “Protein kinase expression during murine mammary development,”Developmental Biology, vol. 219, no. 2, pp. 259–276, 2000.
[24] Y. Zheng and Z. Xu, “MicroRNA-22 induces endothelial pro-genitor cell senescence by targeting AKT3,”Cellular Physiology and Biochemistry, vol. 34, no. 5, pp. 1547–1555, 2014.
[25] D. L. Wheeler, C. Chappey, A. E. Lash et al., “Database resources of the national center for biotechnology information,”Nucleic Acids Research, vol. 28, no. 1, pp. 10–14, 2000.
[26] Y. Yang, S. J. Adelstein, and A. I. Kassis, “Target discovery from data mining approaches,”Drug Discovery Therapy, vol. 14, no. 3-4, pp. 147–154, 2009.
[27] I. Letunic, R. R. Copley, S. Schmidt et al., “SMART 4.0: towards genomic data integration,”Nucleic Acids Research, vol. 32, pp. D142–D144, 2004.
[28] R. D. Finn, J. Mistry, B. Schuster-B¨ockler et al., “Pfam: clans, web tools and services,”Nucleic Acids Research, vol. 34, supplement 1, pp. D247–D251, 2006.
[29] T. Mailund and C. N. S. Pedersen, “QuickJoin—fast neighbour-joining tree reconstruction,”Bioinformatics, vol. 20, no. 17, pp. 3261-3262, 2004.
[30] A.-Y. Guo, Q.-H. Zhu, X. Chen, and J.-C. Luo, “GSDS: a gene structure display server,”Yi Chuan/Zhongguo Yi Chuan Xue Hui Bian Ji, vol. 29, no. 8, pp. 1023–1026, 2007.
[31] R. M. Hussain, M. Ali, X. Feng, and X. Li, “The essence of NAC gene family to the cultivation of drought-resistant soybean (Glycine max L. Merr.) cultivars,”BMC Plant Biology, vol. 17, no. 1, article 55, 2017.
[32] T. Porstmann, B. Griffiths, Y.-L. Chung et al., “PKB/Akt induces transcription of enzymes involved in cholesterol and fatty acid biosynthesis via activation of SREBP,”Oncogene, vol. 24, no. 43, pp. 6465–6481, 2005.
[33] X. Du, I. Kristiana, J. Wong, and A. J. Brown, “Involvement of Akt in ER-to-Golgi transport of SCAP/SREBP: A link between a key cell proliferative pathway and membrane synthesis,”
Molecular Biology of the Cell (MBoC), vol. 17, no. 6, pp. 2735– 2745, 2006.
[34] M. T. Bengoechea-Alonso and J. Ericsson, “SREBP in signal transduction: cholesterol metabolism and beyond,” Current Opinion in Cell Biology, vol. 19, no. 2, pp. 215–222, 2007. [35] J. L. Yecies, H. H. Zhang, S. Menon et al., “Akt stimulates hepatic
SREBP1c and lipogenesis through parallel mTORC1-dependent and independent pathways,”Cell Metabolism, vol. 14, no. 1, pp. 21–32, 2011.
[36] M. C. Rudolph, M. C. Neville, and S. M. Anderson, “Lipid synthesis in lactation: Diet and the fatty acid switch,”Journal of Mammary Gland Biology and Neoplasia, vol. 12, no. 4, pp. 269– 281, 2007.
[37] B. E. Cristiano, J. C. Chan, K. M. Hannan et al., “A specific role for AKT3 in the genesis of ovarian cancer through modulation of G2-M phase transition,”Cancer Research, vol. 66, no. 24, pp. 11718–11725, 2006.
[38] T. Usman, Y. Wang, Y. Yu, C. Liu, X. Wang, and Y. Zhang, “Association study of single nucleotide polymorphisms in STAT5A/B with mastitis susceptibility in Chinese Holstein cattle,” in Proceedings of the 10th World Congress of Genetics Applied to Livestock Production, 2014.
[39] W. Vanderhaeghen, S. Piepers, F. Leroy, E. Van Coillie, F. Haesebrouck, and S. De Vliegher, “Invited review: Effect, per-sistence, and virulence of coagulase-negative Staphylococcus species associated with ruminant udder health,”Journal of Dairy Science, vol. 97, no. 9, pp. 5275–5293, 2014.
[40] N. Lawless, P. Vegh, C. O’Farrelly, and D. J. Lynn, “The role of microRNAs in bovine infection and immunity,”Frontiers in Immunology, vol. 5, article 611, 2014.
[41] M. R. S. Fortes, A. Reverter, Y. Zhang et al., “Association weight matrix for the genetic dissection of puberty in beef cattle,”
Proceedings of the National Acadamy of Sciences of the United States of America, vol. 107, no. 31, pp. 13642–13647, 2010. [42] M. Nuruzzaman, R. Manimekalai, A. M. Sharoni et al.,
“Genome-wide analysis of NAC transcription factor family in rice,”Gene, vol. 465, no. 1-2, pp. 30–44, 2010.
Stem Cells
International
Hindawiwww.hindawi.com Volume 2018
Hindawi
www.hindawi.com Volume 2018
INFLAMMATION
Endocrinology
International Journal ofHindawi
www.hindawi.com Volume 2018 Hindawi
www.hindawi.com Volume 2018
Disease Markers
Hindawi
www.hindawi.com Volume 2018
BioMed
Research International
Oncology
Journal ofHindawi
www.hindawi.com Volume 2013
Hindawi
www.hindawi.com Volume 2018
Oxidative Medicine and Cellular Longevity
Hindawi
www.hindawi.com Volume 2018
PPAR Research
Hindawi Publishing Corporation
http://www.hindawi.com Volume 2013
Hindawi www.hindawi.com
The Scientific
World Journal
Volume 2018
Immunology Research
Hindawi
www.hindawi.com Volume 2018
Journal of
Obesity
Journal ofHindawi
www.hindawi.com Volume 2018
Hindawi
www.hindawi.com Volume 2018
Computational and Mathematical Methods in Medicine
Hindawi
www.hindawi.com Volume 2018
Behavioural
Neurology
Ophthalmology
Journal ofHindawi
www.hindawi.com Volume 2018
Diabetes Research
Journal ofHindawi
www.hindawi.com Volume 2018
Hindawi
www.hindawi.com Volume 2018 Research and Treatment
AIDS
Hindawi
www.hindawi.com Volume 2018 Gastroenterology Research and Practice
Hindawi
www.hindawi.com Volume 2018
Parkinson’s
Disease
Evidence-Based Complementary and Alternative Medicine
Volume 2018 Hindawi
www.hindawi.com