CRC for
Established and supported underthe Australian Government’s Cooperative Research Centres
Program
Improving the efficiency of pig feed
manufacturing and application of
additives
4B-104
Prepared for the
Co-operative Research Centre for High Integrity Australian Pork
ByPeter Sopade1, Brenton Hosking2, Cherie Collins3,Simon Diffey4,Glen Fox1, David Henman3, Chris Brewster5, Andrew Philpotts3, Annette Tredrea6, Hugh Rodrigues7,
Danny Singh7, Aaron Cowieson8,Mike Gidley1 and John Black9
1Centre for Nutrition and Food Sciences, Queensland Alliance for Agriculture & Food Innovation, The University of Queensland St Lucia, Qld 4072
2Formerly of Better Blend Stockfeeds (Rivarina (Australia) Pty. Ltd.), Oakey, Qld 4401 3Rivalea (Australia) Pty. Ltd., Corowa, NSW 2646
4National Institute for Applied Statistics Research Australia, School of Mathematics and Applied Statistics, The University of Wollongong, Wollongong, NSW 2522
5Formerly of Ridley AgriProducts Pty. Ltd., Corowa NSW 2646 6Plant Breeding Institute, University of Sydney, Narrabri, NSW 2390 7Formerly of Wacol Pig Research Centre, DEEDI, Wacol, Qld 4076
8Formerly of Poultry Research Foundation, The University of Sydney, Camden NSW 2570 9John L Black Consulting, PO Box 4021, Warrimoo, NSW 2774
2
Table of Contents
Executive Summary 9
A. Introduction 13
Part One – Commercial feed processing 15
B. Survey of Commercial Pig Feeds 16
B.1 Methods 16
B.2 Results 18
B.3 Conclusions 25
C. Variation to Processing Conditions in Commercial Mills 26
C.1 Background 26
C.2 Methods 27
C.2.1 Treatments 27
C.2.2 Laboratory procedures 28
C.2.3 Mill characteristics 29
C.2.4 RVA and in vitro assays 29
C.3 Results 29
C.3.1 Mill and physical pellet characteristics 29
C.3.1.1 Effects of sorghum inclusion 29
C.3.1.2 Effects of conditioning temperature 31 C.3.1.3 Effects of adding surfactants 32
C.3.1.4 Effects of grind size 33
C.3.1.5 Effects of sorghum inclusion and processing on pellet
size and hardness 33
C.3.1.6 Effects of processing on particle size distribution 35
C.3.2 Nutritional characteristics 35
C.3.2.1 Effects of processing on nutritional quality 35 C.3.2.2 Effects of processing on pellet composition 40 C.3.3 Grain composition and physical characteristics 41
C.4 Conclusions 42
D. Processing Conditions and Animal Performance 43
D.1 Effects of processing temperature, time and sorghum inclusion 44
D.1.1 Background 44
D.1.2 Methods 44
D.1.3 Results 45
D.1.3.1 Mill and pellet physical characteristics 45 D.1.3.2 Laboratory assessment of nutritional quality 45 D.1.3.3 Effects of processing on chemical composition 47
D.1.3.4 Results of animal studies 47
D.1.3.5 In vitro starch digestion and feed conversion rate 50
D.2 Effects of particle size and steam pelleting 52
D.2.1 Mill and physical characteristics 52
D.2.2 Results of particle size analysis 53
D.2.3 Chemical analyses and mill characteristics of ground grains
3
D.2.4 Animal studies 57
D.2.4.1 Methods 57
D.2.4.2 Results 57
D.3 Conclusions 58
E. Development of NIR Calibrations 61
E.1 Background 61
E.2 Methods 61
E.3 Results 61
E.3.1 Effects of processing on NIR scans 61
E.3.2 Preliminary NIR calibrations 64
E.4 Conclusions 65
Part Two – Pilot-plant feed processing 67
F. Grain and Diet Formulation 68
F.1 Background 68
F.2 Methods 68
F.2.1 Wheat 68
F.2.2 Feed formulation 68
F.2.3 Physicochemical property 68
F.3 Results 69
G. Manufacture of pellet diets 74
G.1 Background 74
G.2 Methods 74
G.2.1 Milling 74
G.2.2 Particle size distribution 74
G.2.3 Experimental design 74
G.2.4 Process parameters 76
G.3 Results 77
H. Proximate composition of the pellet diets 80
H.1 Background 80
H.2 Methods 80
H.3 Results 80
I. Pellet quality: Hardness and durability 82
I.1 Background 82
I.2 Methods 82
I.3 Results 82
J. Pasting properties of the pellets 84
J.1 Background 84
J.2 Methods 84
4
K. In vitro starch digestion of the pellets 91
K.1 Background 91
K.2 Methods 91
K.3 Results 91
L. Starch gelatinisation characteristics of the pellets 94
L.1 Background 94
L.2 Methods 94
L.3 Results 94
M. In vitro protein digestion of the pellets 101
M.1 Background 101
M.2 Methods 101
M.3 Results 101
N. Fourier transform infra-red spectroscopy (FTIR) on the state of starch and
protein in the Pellets 103
N.1 Background 103
N.2 Methods 103
N.3 Results 103
O. Animal performance – Feed efficiency with weaners 108
O.1 Background 108
O.2 Methods 108
O.2.1 Animals and treatments 108
O.2.2 Husbandry and management 108
O.3 Results 109
P. Enhancement of the NIR calibrations 113
P.1 Background 113
P.2 Methods 113
P.3 Results 113
P.3.1 Effects of processing on NIR scans 113
P.3.2 Preliminary NIR calibrations 113
Q. Research needs and recommendations 117
Q.1 Further research 117
Q.1.1 Processing model 117
Q.1.2 Enhancing NIR calibrations 117
Q.2 Recommendations 118
References 118
Acknowledgements 121
Publications 121
5
List of Figures
1 An approximation to the processing that is carried out each mill 17 2 Pasting properties of the flaked and raw barley and sorghum 21 3 Starch digestograms of the flaked and raw barley and sorghum with the model
parameters 21
4 Pasting properties of the mixtures of grains from mills A and B 22
5 Starch digestograms for several diets from two mills 23
6 Progressive changes in the pasting properties (RVA) of typical samples – A (mill
A), B (mill B). 24
7 Particle size distribution of barley, sorghum and wheat grains used in the
manufacture component 36
8 Particle size distribution of ration mixtures containing nil, 40% or 60 % sorghum
as used in the manufacture component 37
9 Starch digestion parameters of the mash and pellets from the diet common across
the three mills 38
10 Difference between mash and pellets in the variables describing starch digestion
for the three mills 39
11 Effects of process conditions and formulations on RVA parameters (PV = peak viscosity, FV = final viscosity and IV = initial viscosity) 46 12 Effects of process conditions and formulations on in vitro starch digestibility
parameters 48
13 Relationship between animal performance and in vitro digestion parameter (H =
high, L = low, T = temperature, C = conventional conditioning, E = extended conditioning, S = sorghum inclusion)
51
14 Particle size distribution after a first hammer milling through a 4 mm screen and after re-grinding (3.2 mm screen) those particles captured on 1.8 mm (barley) and 0.9 mm (sorghum) screens
54
15 Particle size distribution of milled and fractionated grains and feed mixtures,
GA104 55
16 Effect of re-grinding large particles fed either as mash or conventional pellets on
feed conversion ratio for weaner and grower pigs 60
6 18 Spectral differences within an individual processor (QAF) 62 19 Example of spectral differences between two processors including all processing
stages (BBS – white; QAF – green) 63
20 Loading plot of spectral regions associated with pellet quality 63
21 A schematic diagram of a ripple mill 75
22 The pellet mill 75
23 Particle size distributions and parameters 78
24 The measured temperature of the conditioned samples against the set temperature 79
25 Typical viscograms of the pellets showing grain effects 85
26 Dependence of the changes (mash-pellet) in pasting parameters of the mash on the
grain, and conditioning temperature and time 89
27 Typical starch digestograms of the pellets showing the temperature effects 92 28 Typical thermograms of the pellets and corresponding mash 95 29 Gelatinisation characteristics of the pellets showing the grain and conditioning
temperature main effects, and the grain x conditioning temperature x conditioning time interaction effects
96
30 Flowchart of the procedure for degree of starch gelatinisation by the amylose
solubility method 98
31 Grain x conditioning temperature x conditioning time interactions (nominal values) on degree of starch gelatinisation by the amylose solubility method 99
32 Typical protein digestogram of the pellets 102
33 Grain x temperature effects on in-vitro protein digestibility of the pellets 102
34 Typical spectra of the pellet diets 104
35 Effects of grain x conditioning temperature x conditioning time on the FTIR
absorbance ratios 106
36 Animal performance parameters of the pellet diets as affected by the processing
condition 111
37 PCA showing new samples (circled) clustering away from the previous samples
7
List of Tables
1 Description of samples for the project 19
2 Changes in pasting properties along the processing chain as indicated by RVA
variables 25
3 Ingredient inclusions (%) for rations manufactured under protocol BBS 27
4 Manufacturing component (BBS, QAF, RAP) - Mill processing conditions 28
5 Milling equipment and capacities 30
6 Variables used to calculate retention time at the mixer conditioner 31
7 Processing conditions and responses to increasing sorghum inclusion at the BBS,
QAF and RAP mills 31
8 Effect of conditioner temperature on mill and pellet characteristics at the BBS mill 32
9 Processing conditions and responses to the inclusion of surfactant (Kemzyme W,
BBS) 32
10 Processing conditions and responses to the inclusion of surfactant (Bredol, RAP) 33
11 Processing conditions and responses to grind size, QAF 33
12 Particle size of feed mixtures before (mash) processing and pellet characteristics in response to increasing sorghum inclusion and temperature, BBS 34
13 Particle size of feed mixtures before (mash) processing and pellet characteristics in response to increasing sorghum inclusion and 2 grind sizes, QAF 34
14 Particle size of feed mixtures before (mash) processing and pellet characteristics in response to increasing sorghum inclusion and the use of a surfactant (Bredol), RAP
35
15 Processing effects on the chemical composition of a pig grower feed
manufactured at BBS 40
16 Processing effects on the chemical composition of a pig grower feed
manufactured at QAF 41
17 Processing effects on chemical composition of a pig grower feed manufactured at
RAP 41
18 Chemical and physical characteristics of grains used in the manufacture of a pig
grower feed at the mills 42
8 20 Physical characteristics of feed components before (mash) and after processing
(pellet) 45
21 Chemical components of the mash 49
22 Chemical components of the pellet 49
23 Predicted mean values for feed conversion ratio (feed:gain) over 0-28 days for the interaction between conditioning temperature (temp) and conditioning time (conditioning)
49
24 Predicted mean values for feed conversion ratio (feed:gain) over 7-28 days for the
interaction between conditioning temperature time 49
25 Predicted mean values for feed conversion ratio (feed:gain) over 7-28 days for the interaction between conditioning temperature and sorghum inclusion in the diet 50
26 Processing conditions for conventional and fractionated ration mixtures
52
27 Physical components of conventional and fractionated ration mixtures before
(mash) after (pellet) processing 53
28 Chemical and physical characteristics of grains and grain fractions 56
29 Chemical components of conventional and fractionated ration mixtures after
processing 56
30 Rivalea weaner pig experiment. Effects of grain type, particle size and diet form on average daily intake (ADI), rate of gain (ROG) feed conversion ratio (FCR) of pigs from 0-28 days
57
31 Wacol grower pig experiment. Effects of grain type, particle size and diet form on average daily intake (ADI), rate of gain (ROG) feed conversion ratio (FCR) of pigs from 0-28 days
58
32 Criteria used to assess the value of NIR calibrations 65
33 Statistics for NIR calibrations established for variables measured on final
processed pellets 66
34 Physicochemical (laboratory and NIR) properties of the wheats 70
35 Diet formulation for soft wheat 1894 71
36 Diet formulation for hard wheat 1895 72
37 Diet formulation for sprouted wheat 1896 73
9 39 The main effects of the processing conditions on the specific mechanical energy
(SME) 79
40 Proximate composition of the pellet diets 81
41 Predicted hardness and durability of the 18 pellet treatments 83 42 Summary of statistical analysis (p-values) of the RVA parameters as affected by
the processing conditions 86
43 Predicted RVA parameter values of the three-level interactions 87 44 Predicted RVA parameter values of the four-level interactions 88 45 Predicted starch digestion parameters for the 18 pellet treatments using the
modified first-order kinetic model 93
46 Summary of statistical analysis (p-values) of the animal performance parameters
as affected by the processing conditions 110
47 Pearson’s correlation analysis of the key parameters of the pellets 112 48 Comparison of calibration statistics from previous calibrations and the new
10
List of Appendices
These appendices relate to part two of the project
I Experimental design codes for part two of the project 123
II Statistical report on moisture content of the pellet diets 124 III Statistical report on starch content of the pellet diets 138 IV Statistical report on protein content of the pellet diets 150 V Statistical report on fat content of the pellet diets 162 VI Statistical report on ash content of the pellet diets 174 VII Statistical report on pasting behaviours of the mash and pellets 186 VIII Statistical report on in vitro starch digestion of the pellet diets 198
IX Statistical report on differential scanning calorimetry of the mash and pellets 214 X Statistical report on in vitro protein digestion of the pellet diets 225
XI RIVALEA ethic approval 11N093C – Influence of grain and processing conditions on
pig growth 237
XII Statistical report on weaner feeding trials 240
11
Executive Summary
The project has demonstrated that processed feeds with similar ingredient mixtures differ widely between mills in throughput, energy use, pellet hardness and durability and nutritional quality for growing pigs. Preparation of grains before mixing, specific ingredients and additives used as well as the physical structure of the processing units all affect the cost of manufacture and physical and nutritional quality of the finished product.
Important findings from the project were:
Characteristics of individual grains (wheat, barley, sorghum) that influence pellet quality and nutritional value are not additive when mixed in a diet with the characteristics of sorghum dominating.
The size of grain particles, particularly the proportion of large particles, significantly affects RVA, in vitro starch digestion variables, pellet hardness and durability and the
efficiency of feed use by young pigs. Regrinding large particles produced by normal hammer milling of grains increased the efficiency of feed use by young pigs by up to 22% with sorghum based diets and 15% with barley based diets.
Low conditioning temperature for an extended period significantly increased the rate of
in vitro starch digestion and efficiency of feed use by growing pigs.
Addition of surfactants to diet mixtures produced small and variable results. At one mill, a surfactant significantly reduced retention time and pellet length, whereas there were no significant effects at the other mill.
There were significant differences between soft, hard and naturally sprouted wheat samples in energy use during diet processing, pellet quality and efficiency of feed use by weaner pigs.
Significantly more energy was used during diet processing and pellet formation (as measured by specific mechanical energy (SME, kJ/kg)) for diets based on soft wheat samples compared with diets based on either hard or naturally sprouted wheat.
Pellets made from diets containing sprouted wheat were significantly softer and tended to be less durable (non-significant) than pellets made from diets containing either soft or hard wheat.
Although feed consumption for pigs offered diets containing sprouted wheat was greater than for pigs offered diets containing either soft or hard wheat, efficiency of feed use was 16% less than weaner pigs given diets based on soft wheat. There was no difference between soft and hard wheat in efficiency of feed use.
Increasing temperature of the conditioning period during feed processing from 60°C to 80°C significantly reduced the efficiency of feed use in weaner pigs by 16%.
There was a strong relationship between several variables from the in vitro starch
digestion assays (rate constant K, area under the curve and 240 min starch disappearance) and the efficiency of feed use by growing pigs. This observation needs strengthening with more data, but confirms that the in vitro assay is an excellent
method for rapidly screening feed products for their nutritional value in pigs.
Preliminary NIR calibrations developed from scans of the final pelleted product are encouraging for predicting faecal DE content, in vitro starch digestion variables and the
physical and chemical characteristics of the product.
13
A.
Introduction
Differences in throughput rates and pellet quality are regularly observed in the manufacture of pig feed products and occur despite increasingly sophisticated procedures for process control and ingredient description and selection. Anecdotal reports suggest grain type and inclusion level, particle size and the conditioning and press settings of individual mills are contributing factors. Throughput and specific mechanical energy (SME) used are key measures of feed mill efficiency. Thus, feed mills direct considerable attention toward maximizing production rates due to their impact on overall mill costs and profitability. Pellet quality, that is product durability and absence of fines, is the most relevant measure of feed processing effectiveness in commercial stock feed manufacture. Few pig producers adequately record or monitor feed use efficiency so that feedback to mills on the performance of individual processing methods are generally restricted to complaints about the form and consistency of the pellet rather than any aspect of animal performance related to the nature of the feed supplied. Not surprisingly, variations in pellet quality are an ongoing source of frustration for both stock feed manufacturers and pig producers with potential implications for both mill efficiency and on-farm feed use efficiency.
Further complicating attempts to develop more consistent methods for feed manufacture is that the nutritional values of ingredients used in the preparation of diet formulations are generally developed from analysis of the unprocessed raw materials. Commercially prepared animal feeds are complex mixtures of heat-processed protein meals and minerals as well as grains and it is unclear how further processing during manufacture affects either the milling characteristics or nutritional value of the resulting pig feed products.
The extent to which processing conditions influence feed characteristics is also a consideration in the application of new technologies such as microwave and NIR spectroscopy (NIR) to the on-line control of feed manufacture systems. If processing alters the spectral profiles of individual grains and ration mixtures, there will be significant implications for the precision of individual nutrient calibrations and how readily such technology may be taken up by the wider stock feed industry.
The project aims to reduce production costs for high-quality pork through understanding how commercial processing conditions affect mill throughput, processing energy efficiency, product durability and the nutritional value of pig feed. This was achieved by investigating the effects of commercial processing conditions, grain characteristics, ingredient mixtures and additives on product throughput, energy efficiency of processing, durability of the product and the nutritional value of processed feed for pigs. Initially a survey of feeds collected from two commercial mills was conducted. The pig feeds collected varied in type and ingredient mixtures, as well as processing techniques. The feeds were subjected to in vitro starch digestion and RVA analysis as an assessment of likely differences in nutritional
quality. Subsequently, an experiment investigating the effect on in vitro assays of sorghum
content in the feed mix, hammer mill screen size, temperature of conditioning, use of surfactants and mill location was conducted. Finally, an experiment altering the amount of sorghum in the mixture, conditioning temperature and time was undertaken where both in vitro assays and growth performance for grower pigs were measured.
14 grain samples and ingredient mixtures to improve manufacturing efficiency, product durability and nutritional value for pigs.
Reliable NIR calibrations have been developed in projects 1B-101/104 to predict the energy value of cereal grains for pigs. These calibrations have proven to be extremely useful for reducing the cost of production of pigs offered meal or cold pelleted diets. The degree of starch gelatinisation within grains can substantially affect the rate of starch digestion by pigs and the energy value of feeds. The original NIR calibrations are therefore less reliable for predicting the energy value of feed pellets made by the conventional steam pellet press. A final objective of the project is to determine whether NIR calibrations of the final processed feed can be developed to reliably predict factors that may influence animal performance or directly predict animal performance.
The report is divided into two parts. Part One deals with commercial feed processing that examined the issues above. However, commercial mills are limited by their sizes, which restrict processing levels and settings, quantities of raw materials to process, possibly the grains to process because of locations, and the processed parameters to measure. With the global objective to understand material-process-property relationships, these limitations can affect the generation of baseline data that are valuable for commercial feed processing. A pilot-plant feed processing study is, therefore, required, and this was undertaken and forms Part Two of the report. Moreover, it is well recognised that Australian pig diets are grain-based with wheat, barley, sorghum, maize, triticale, and rice as the major cereals used. Wheat is the grain used predominantly for pig diets in most years in southern Australia. Both hard and soft wheat varieties are available and in some years, shot and sprung (sprouted) samples are common. These wheat types differ in their physical and chemical properties, as well as the concentration of naturally-occurring enzymes. For example, following rain damage, α-amylase will increase in sprouted wheat, while differences in fracturability can influence particle size distributions of milled soft and hard wheats. Previous Pork CRC and PGLP projects have shown that these variables influenced energy delivery and animal performance.
Hence, Part Two of the report details the following tasks:
Sourcing soft, hard and sprouted wheats, and NIR-scanning of the wheats. Formulation of diets to fixed grain percentage, digestible energy and dry matter.
Manufacturing pellet diets at different conditioning conditions while fixing other processing conditions in a pilot-scale feed mill.
Establishing process response to changes in grain types and conditions. Assessing feed efficiency of the pellet diets with weaner pigs.
Examination of pellet quality (hardness and durability).
Analysing the physicochemical properties of the grains and diets. NIR-scanning of the diets.
Investigating functional and digestibility properties of the diets.
Examination of the relationships between in vitro, in vivo and NIR-predicted data to
15
PART ONE
16
B. Survey of Commercial Pig Feeds
The basic principle of manufacturing a pelleted product is to take a specified mixture of milled grains, protein meals and minerals from ambient temperature with moisture content of around 11% to approximately 15-17% moisture at the press to form the desired pelleted structure. The heat and excess moisture is then dissipated to produce a product that is sufficiently durable and stable to persist through transport, storage and delivery to the animal. The settings used in feed processing vary for each mill as does the nature of the final product.
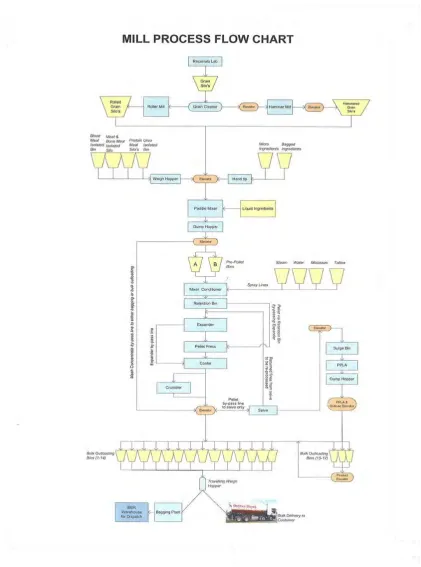
Steam pelleting allows for the addition of moisture, needed to form or mould the pellet, in the presence of heat. The heat with moisture assists to gelatinise starch fractions within the grain component, effectively cooking the mixture and aiding to cement the mixture together. Through this process, steam pelleting assists to improve throughput while minimizing wear on mill equipment and reducing energy consumption at the press. Figure 1 provides an outline of a typical steam pelleting, feed manufacturing system.
B.1
Methods
Fifty samples (Table 1) were selected from a range of diets made by two feed mills (Riverina, formerly Better Blend, Oakey, Queensland, Mill A; Ridley AgriProducts, Toowoomba Queensland, Mill B) that involved different grains, at various stages of processing, with and without heat treatment. The samples consist of processed and unprocessed grains, all of which were ground in a laboratory hammer mill through a 1 mm retention sieve, to create sample material of a consistent size for analysis. To assess likely differences in the nutritional value of the samples, assays were conducted for in vitro starch digestion (Sopade
and Gidley 2009) and RVA analyses (Mahasukhonthachat et al. 2010). The RVA variables
listed below were obtained using the Thermocline for Windows(R) software. These
measurements have been widely used to characterise pasting behaviours of human food and animal feed:
Initial viscosity – Pasting viscosity at 1 min.
Pasting temperature – Temperature of an appreciable change (>10%) change in viscosity
Peak viscosity – Highest pasting viscosity prior to cooling the gelatinised starch dispersion
Trough viscosity – Lowest pasting viscosity during holding the gelatinised starch dispersion at about 95oC
Final viscosity – Viscosity at the end of cooling and holding at 50oC
For systems that exhibit monophasic starch digestograms during in vitro starch digestion, a
modified first-order kinetic model (Eqn.[1]) can be used to describe the digestograms;
17
Figure 1. An approximation to the processing that is carried out at each mill
18 where, Dt = digested starch (g/100g dry starch) at time t (min), D0 = digested starch (g/100g
dry starch) at time t = 0, which is equivalent to gastric digestion, D∞ = digested starch
(g/100g dry starch) at infinite time (t → ∞), which is equivalent to maximum digested starch, and K = rate of digestion (g/min). It has been widely estimated that digestion in the small intestine (pancreatic digestion) can be up to 4 h. Therefore, starch digestion at 240 min. (predicted, PreD240 and measured, ExpD240) as well as the area under the starch digestogram (g.min/100 g dry starch, AUC (Eqn. [2]), can be used as additional digestion variables, which estimate the amount of glucose released into the blood (glycemic index).
2400 0
0
0 D t DK exp Kt
D
AUC
Eqn. 2
Hence, except when otherwise stated, six starch digestion parameters, D0, D∞, K, PreD240,
ExpD240, and AUC were used to characterise the in vitro starch digestion of samples
throughout the study.
For all analyses, samples were randomised and duplicated. The following hypotheses were investigated:
a. Grains behave differently when processed
b. End-use properties of grains are dependent on processing
c. Changes in product properties are progressive along the processing change
B.2
Results
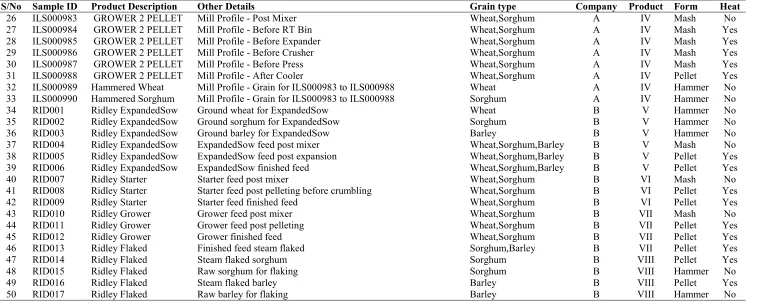
Results are presented for 10 of the 50 samples examined. These samples demonstrate some of the major effects of processing on individual grains and feed mixtures. Figure 2 illustrates the effects of steam flaking either barley or sorghum on viscosity as measured with the RVA apparatus. Viscosity was substantially higher for barley grain (RID016, RID017) than for sorghum (RID014, RID015). However, for both grains, steam flaking increased viscosity, which possibly reflected better swelling behaviours of the flaked samples (RID016 cf. RID017 for barley and RID014 cf. RID015 for sorghum). Steam flaking is a heat-moisture treatment, which is expected to gelatinise starch and reduce RVA viscosity in the presence of other favourable conditions. However, the pasting behaviours of these samples indicate the flaking process did not appreciably gelatinise the starches in the barley and sorghum. This conclusion was reached because, apart from the pasting behaviours, microscopy (not shown) revealed many native starch granules (low gelatinisation) in the samples. Moreover, differential scanning calorimetry (not shown), which measures gelatinisation properties, showed evidence of incomplete gelatinisation in the samples. It is noteworthy that while the flaked (RID014) and raw (RID015) sorghum exhibited shear-thickening pasting behaviours, the flaked (RID016) and raw (RID017) barley showed shear-thinning behaviours. Mahasukhonthachat et al. (2010) proposed shear-thickening behaviours occur because of
restricted swelling of sorghum starch due to protein matrix, but these starch-protein interactions can be disrupted by a careful choice of processing conditions. Such disruptions can enhance starch digestion and energy delivery from sorghum pellets as Mahasukhonthachat et al. (2010) measured shear-thinning pasting behaviours in extruded
19
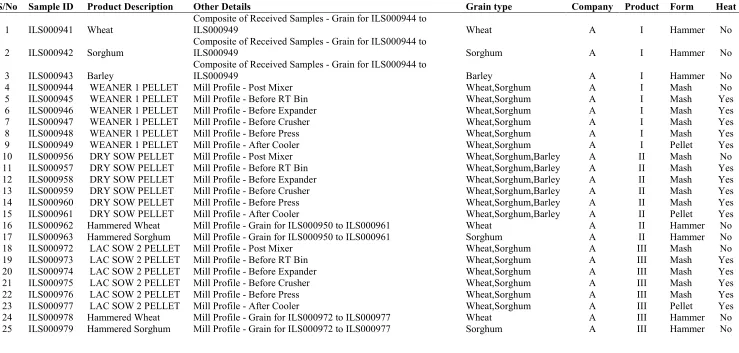
Table 1. Description of samples for the project (1 of 2)
S/No Sample ID Product Description Other Details Grain type Company Product Form Heat
1 ILS000941 Wheat Composite of Received Samples - Grain for ILS000944 to ILS000949 Wheat A I Hammer No
2 ILS000942 Sorghum Composite of Received Samples - Grain for ILS000944 to ILS000949 Sorghum A I Hammer No
20
Table 1. Description of samples for the project (2 of 2)
S/No Sample ID Product Description Other Details Grain type Company Product Form Heat 26 ILS000983 GROWER 2 PELLET Mill Profile - Post Mixer Wheat,Sorghum A IV Mash No 27 ILS000984 GROWER 2 PELLET Mill Profile - Before RT Bin Wheat,Sorghum A IV Mash Yes 28 ILS000985 GROWER 2 PELLET Mill Profile - Before Expander Wheat,Sorghum A IV Mash Yes 29 ILS000986 GROWER 2 PELLET Mill Profile - Before Crusher Wheat,Sorghum A IV Mash Yes 30 ILS000987 GROWER 2 PELLET Mill Profile - Before Press Wheat,Sorghum A IV Mash Yes 31 ILS000988 GROWER 2 PELLET Mill Profile - After Cooler Wheat,Sorghum A IV Pellet Yes 32 ILS000989 Hammered Wheat Mill Profile - Grain for ILS000983 to ILS000988 Wheat A IV Hammer No 33 ILS000990 Hammered Sorghum Mill Profile - Grain for ILS000983 to ILS000988 Sorghum A IV Hammer No 34 RID001 Ridley ExpandedSow Ground wheat for ExpandedSow Wheat B V Hammer No 35 RID002 Ridley ExpandedSow Ground sorghum for ExpandedSow Sorghum B V Hammer No 36 RID003 Ridley ExpandedSow Ground barley for ExpandedSow Barley B V Hammer No 37 RID004 Ridley ExpandedSow ExpandedSow feed post mixer Wheat,Sorghum,Barley B V Mash No 38 RID005 Ridley ExpandedSow ExpandedSow feed post expansion Wheat,Sorghum,Barley B V Pellet Yes 39 RID006 Ridley ExpandedSow ExpandedSow finished feed Wheat,Sorghum,Barley B V Pellet Yes 40 RID007 Ridley Starter Starter feed post mixer Wheat,Sorghum B VI Mash No 41 RID008 Ridley Starter Starter feed post pelleting before crumbling Wheat,Sorghum B VI Pellet Yes 42 RID009 Ridley Starter Starter feed finished feed Wheat,Sorghum B VI Pellet Yes 43 RID010 Ridley Grower Grower feed post mixer Wheat,Sorghum B VII Mash No 44 RID011 Ridley Grower Grower feed post pelleting Wheat,Sorghum B VII Pellet Yes 45 RID012 Ridley Grower Grower finished feed Wheat,Sorghum B VII Pellet Yes 46 RID013 Ridley Flaked Finished feed steam flaked Sorghum,Barley B VII Pellet Yes
47 RID014 Ridley Flaked Steam flaked sorghum Sorghum B VIII Pellet Yes
48 RID015 Ridley Flaked Raw sorghum for flaking Sorghum B VIII Hammer No
49 RID016 Ridley Flaked Steam flaked barley Barley B VIII Pellet Yes
21
Figure 2. Pasting properties of the flaked and raw barley and sorghum
22 The in vitro starch digestograms of the flaked and raw barley and sorghum are shown in
Figure 3. The differences in the RVA behaviours are partially reflected in the in vitro starch
digestibility of these samples. Possibly because of sorghum starch-protein interactions, the raw barley (RID017) was generally more digested than the raw sorghum (RID015). Steam flaking of both grains (barley RID016; sorghum RID014) increased the rate of starch digestion (K) compared with the raw grains, and sorghum was more affected (Figure 3, insert). Although substantial differences in the rate of starch digestion at 240 minutes remained for steam flaked sorghum compared with raw sorghum, there was little difference in the proportion of starch digested at this time between raw and steam-flaked barley (PreD240 and ExpD240).
Figure 4 shows the effect of processing whole diets containing a mixture of grains at different mills on pasting properties as measured by the RVA. There were marked differences in viscosity between sow diets containing wheat, sorghum and barley when prepared at mill A (ILS000959 & ILS000961) compared with mill B (RID004 & RID005). There were relatively small differences in viscosity measurements at each mill between the raw mixed mash and the finished pellet. However, at both mills, pelleting reduced viscosity. This was possibly because of an increase in starch gelatinisation. The marked differences in viscosity between the sow diets prepared at the different mills suggests that there were major differences in the treatment of grains prior to mixing and possibly processing conditions, rather than due to the processing techniques because both mills pelletised the feeds (ILS000961 and RID005). However, grower diets prepared at mill B (RID011) had similar viscosity profiles to the sow diets prepared at mill A (ILS000961). Pelleting the grower diet increased viscosity slightly compared with the mixed mash diet prior to pelleting, and this could be due to enhanced swelling, rather than gelatinisation.
23 Figure 5 shows the in vitro starch digestograms for the mixed mash diets and pellets. Starch
digestion was substantially faster for the sow diets prepared at mill B (RID005) compared with mill A (ILS000961) and reflects the differences seen in the viscosity measurements. Pelleting enhanced starch digestion for sow diets prepared by both mills. This is reflected by an increase (>10%) in all the digestion parameters compared to mash with the rate of digestion increasing by more than 200%. Similarly, starch digestion for grower diets prepared at mill B was substantially increased by pelleting (RID010 cf RID011). The increases observed were of the order as seen for the sow diets. .
`
Figure 5. Starch digestograms for several diets from two mills
24 significant reduction in the RVA parameters. This slight increase in RVA viscosity occurred possibly because of post-process changes (structural and additives).
Figure 6. Progressive changes in the pasting properties (RVA) of typical samples – A (mill A), B (mill B)
5
c
·
.~ 0 ~>-..
"
c· .~ 128 8 .~ ;> 4 o o
A
1
B
I 001 I 002
1
010 011012
944 Post Mixer (wheat, sorghum)
945 Before RT Bin (post steaming)
946 Before Expander (post equilibration)
947 Before Crusher
1
948 Before Press
949 After Cooler
946
3 6 9
Time Olios
_ Gelatinisation/microstructure?
Ground wheat Ground sorghum
Post mixer (wheat, sorghum)
Post pelieting
1
Finished feed
J 6 9
Time mius
944
945
949
948
947
Gelatinisation?
Ge lati n i sati on/m i crostructure? 12
002
001
",~"c::::=: .12
... 010
- - - - .11
25
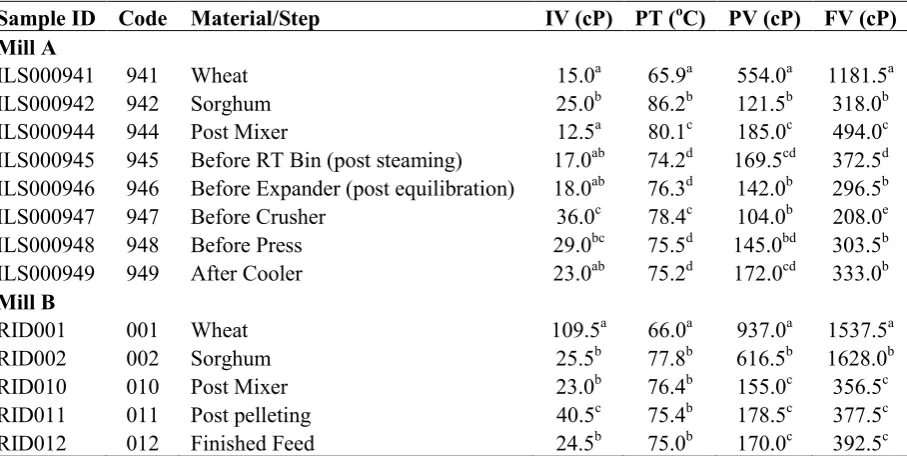
Table 2. Changes in pasting properties along the processing chain as indicated by RVA variables#
Sample ID Code Material/Step IV (cP) PT (oC) PV (cP) FV (cP)
Mill A
ILS000941 941 Wheat 15.0a 65.9a 554.0a 1181.5a ILS000942 942 Sorghum 25.0b 86.2b 121.5b 318.0b ILS000944 944 Post Mixer 12.5a 80.1c 185.0c 494.0c ILS000945 945 Before RT Bin (post steaming) 17.0ab 74.2d 169.5cd 372.5d ILS000946 946 Before Expander (post equilibration) 18.0ab 76.3d 142.0b 296.5b ILS000947 947 Before Crusher 36.0c 78.4c 104.0b 208.0e ILS000948 948 Before Press 29.0bc 75.5d 145.0bd 303.5b ILS000949 949 After Cooler 23.0ab 75.2d 172.0cd 333.0b
Mill B
RID001 001 Wheat 109.5a 66.0a 937.0a 1537.5a
RID002 002 Sorghum 25.5b 77.8b 616.5b 1628.0b RID010 010 Post Mixer 23.0b 76.4b 155.0c 356.5c RID011 011 Post pelleting 40.5c 75.4b 178.5c 377.5c RID012 012 Finished Feed 24.5b 75.0b 170.0c 392.5c #In a column per mill, values with the same letters are not significantly (p>0.05) different; IV = initial viscosity, PT = pasting temperature, PV = peak viscosity, and FV = final viscosity
B.3
Conclusions
The survey of grains and diets taken from different places in the feed processing units confirmed that there are major effects of grain mixtures and mill processing techniques on pasting properties (RVA viscosity) and in vitro starch digestion. The in vitro assays provide
a reflection of the likely differences in the nutritional quality of processed feeds. The survey showed that processed pellets of feeds with similar ingredient mixtures, for example sow feeds, can have widely different RVA and digestion characteristics when prepared by different mills. In addition, the survey suggested that the mixtures of grains when incorporated into a feed do not behave as would be expected by the sum of the in vitro
characteristics of the individual grains.
Viscosity, as measured by the RVA, provides an assessment of the amount of starch in a feed that can be gelatinised. Potential gelatinisation increases as starch within the grain is made more accessible, for example, by fine grinding. However, viscosity will be reduced when starch has already been gelatinised prior to the RVA assay following, for example, wet heat treatment during processing. On the contrary, in vitro starch digestion assays indicate the
accessibility of starch to amylase enzymes. Accessibility of starch would be expected to increase with fine grinding and also following gelatinisation, provided the starch has not retrograded. The rate of in vitro starch digestion has been shown in the Pork CRC project
1B-102 to be related to the proportion of dietary starch digested at the ileum.
26
C.
Variation to Processing Conditions in Commercial
Mills
C.1
Background
Particle size, grain type and moisture content and the nature of the other materials in the ration mixture will influence how quickly a given ration mixture will take up moisture either as steam or free water and so each have an influence on the nature of the material presented to the press for processing.
Thomas et al. (1997) categorised factors affecting feed quality according to the properties of:
Raw materials, their chemical and physico-chemical characteristics, bulk density and particle size distribution
Process variables including conditioning temperatures and pressure, press settings and cooling system
System variables such as throughput and energy consumption
Functional characteristics including starch hydration and gelatinisation, protein denaturation and fibre solubility and
Optimisation objectives – nutritional quality, pellet durability and hardness and feed hygiene (bacteria control).
This experiment examines the effects of each of these properties of feed manufacture in relation to the particular challenges of producing quality pellets of high nutritional value from mixtures containing appreciable amounts of sorghum. Utilisation of sorghum in diets for pigs is particularly problematic because it is a small hard grain and not readily milled. Sorghum contains a high proportion of kafirin proteins that are poorly solubilised compared to other feed grains. The resulting low rates of starch hydration and solubilisation are thought to be major reasons for the lower feed conversion often observed in pigs fed sorghum-based diets. Anecdotal reports that extended conditioning and increased moisture addition into the ration mixture before processing can enhance the quality of sorghum-based rations was a further stimulus for the research. Industry experience and results from the survey suggest that different mills will process the same ration formulations (specifications and ingredients) differently, which leads to different nutritional outcomes and different rates of animal performance.
27
C.2
Methods
C.2.1
Treatments
A pig grower feed formulated to contain similar raw materials and provide 13.8 MJDE/kg and 0.68 g available lysine per MJ DE was used at each mill. The ingredients used for the diets prepared at BBS are shown in Table 3.
Table 3. Ingredient inclusions (%) for rations manufactured under protocol BBS
Mill Nomenclature 169464191 169464291 169464391 169464491 169464591 169464691 Experimental diets PORK
CRC MFP 1 - 4 - 7
PORK CRC MFP 2 - 5 - 8
PORK CRC MFP 3 - 6- 9
PORK CRC MFP 10 PORK CRC MFP 11 PORK CRC MFP 12
PHYZYME LITE 0.300 0.300 0.300 0.300 0.300 0.300
BARLEY FEED 35.0 20.0 3.80 21.0 21.0 21.0
SORGHUM RED FEED 0 40.9 60.0 40.0 40.0 40.0
WHEAT FEED 44.6 20.0 14.0 20.0 20.0 20.0
CANOLA MEAL 38% 2.00 4.10 5.90 4.30 4.30 4.30 SOYBEAN MEAL 47.5% 5.30 4.00 4.00 4.00 4.00 4.00 BLOOD MEAL 85% 0.500 0.909 1.58 1.52 1.52 1.52
MEAT MEAL 50% 4.60 4.10 3.00 3.00 3.00 3.00
TALLOW 1.70 0.500 0.500 0.500 0.500 0.500
MOLASSES 2.00 2.00 2.00 2.00 2.00 2.00
SURFACTANT LIQUID 2.00 2.00 2.00 0 0 0
BIOFOS 25KG 0 0 0 0.597 0.597 0.597
COPPER SULPHATE 0.055 0.055 0.055 0.054 0.054 0.054 DICALCIUM PHOSPHATE 0 0 0.827 1.20 1.20 1.20
LIMESTONE 1.20 0.376 1.20 0.748 0.748 0.748
SALT 0.250 0.234 0.250 0.250 0.250 0.250
LYSINE 0.274 0.330 0.322 0.302 0.302 0.302
METHIONINE LIQUID 0.062 0.082 0.076 0.076 0.076 0.076 THREONINE 98% 0.048 0.056 0.046 0.046 0.046 0.046 BETTER PIG PREMIX 0.100 0.100 0.100 0.100 0.100 0.100
TOTAL 100 100 100 100 100 100
Twelve treatments were made at the Better Blend mill, seven were made at the Rivalea mill and six at the Ridley AgriProducts mill. There were two treatments common to each mill. The treatments were composed of sorghum inclusion level, grind size, mill temperature, surfactant, Avizyme® and phytase. The treatments adopted at each mill are summarized in
Tables 4. Samples were collected from several positions along the production line (Figure 1). Results are presented in this report for hammered grains and feed mixtures collected before (mash) and after (pellet) processing.
28
Table 4. Manufacturing component (BBS, QAF, RAP) - Mill processing conditions
BBS DIETS 1 4 7 2 5 8 3 6 9 10 11 12
Sorghum inclusion (%) 0 0 0 40 40 40 60 60 60 40 40 40 Grind size (mm) 3 3 3 3 3 3 3 3 3 3 3 3
Surfactant Y Y Y Y Y Y Y Y Y N N N
Avizyme N N N N N N N N N N Y N
Steam temperature (oC) 70 85 105 70 85 105 70 85 105 85 85 85 Steam pressure (kPa) 100 100 100 100 100 100 100 100 100 100 100 100 Batch size (Tonnes) 3 3 3 3 3 3 3 3 3 3 3 3 Throughput (tonnes per hour) 8 8 8 8 8 8 8 8 8 8 8 8 Expander temperature (oC) 105 105 105 105 105 105 105 105 105 105 105 105
QAF DIETS 1 4 2 5 7 3 6
Sorghum inclusion (%) 0 0 40 40 40 60 60
Grind size (mm) 2 3 3 2 3 3 2
Avizyme N N N N Y N N
Steam temperature (oC) 85 85 85 85 85 85 85
Steam pressure (kPa) 68 68 68 68 68 68 68
Batch size (Tonnes) 3 3 3 3 3 3 3
Throughput (tonnes per hour) 10 10 10 10 10 10 10
RAP DIETS 1 2 3 4 5 6
Sorghum inclusion (%) 0 0 40 40 60 60
Grind size (mm) 3 3 3 3 3 3
Surfactant N Y N Y N Y
Steam temperature (oC) 85 85 85 85 85 85
Steam pressure (kPa) 55.1 55.21 55.8 56.0 55.1 56.3
Batch size (Tonnes) 6 6 6 6 6 6
Throughput (tonnes per hour) 12 12 12 12 12 12
C.2.2
Laboratory procedures
Pellet samples obtained after processing were assessed for durability using a Holmen pellet tester (TekPro Limited Willow Park North Walsham Norfolk, UK). Laboratory analyses were undertaken using a NATA accredited laboratory (Symbio Alliance, Eight Mile Plains QLD 4113) using standard analytical procedures. Starch digestion was determined in-vitro
by the method of Sopade and Gidley (2009). Water activity (aw) was determined on a PAw
29
C.2.3
Mill characteristics
Throughput at the pellet press was obtained from the respective mill batching systems. The capacities of individual mills are summarised in Table 5 and variables used to calculate retention times at the mixer-conditioner are given in Table 6. Specific Mechanical Energy used at the press (SMEp) was calculated (Eqn. 3) as the ratio of the measured press amp usage to maximum amp rating multiplied by the motor size (kW) divided by actual throughput (tonnes/hour):
SMEp (kWh/tonne) =
Eqn. 3
where AmM = measured press ampere usage (Amp), AmMAX = maximum ampere rating of
the press (Amp), PR = maximum power rating of the motor (kW), and G = throughput
(tonnes/hour)
C.2.4
RVA and
in vitro
assays
The RVA and in vitro starch digestion assays described above (B.1) were also performed on
all diets made for the experiment.
C.3
Results
C.3.1
Mill and physical pellet characteristics
C.3.1.1 Effects of sorghum inclusion
Responses for some of the more important determinants of mill efficiency are shown in Table 7. Pellet durability and free water content, as determined by water activity (aw), are critical
measurements for pellet quality. Increasing the amount of sorghum in the diet showed markedly different effects between the mills. Pellet quality remained high as sorghum content was increased at the BBS mill, but not at either the QAF or RAP mills, where all diets containing sorghum had unsatisfactory pellet quality. A pellet is considered unsatisfactory or low in quality if durability is less than 90% and the hardness value is less than 7 kg. Although pellet durability was high for all sorghum treatments at BBS, water activity was higher than 0.65, where 0.7 is considered a critical value for microbial activity and may eventually lead to the formation of mould.
30
Table 5. Feed manufacturing equipment and capacities
Components BBS QAF RAP
BATCHING SYSTEM Probatch
Semi-automatic Automatic Automatic
MIXER Type Paddle shaft Paddle shaft
Horizontal Horizontal
Capacity (tonnes) 3 3
Amp Max 55
Amp 29 20
kW 30 37
MIXER CONDITIONER Diameter, ID 610 450
Length m 3.28 2.3
Amp Max 80
Amp 50
kW 45
RETENTION BIN Diameter (m) 2 na na
Amp Max 10
kW 10
Amp 8
kW 5.5
EXPANDER Amandus Kahl OE30 na na
Diameter mm 300
Length m 2.2
Amp Max 330
Amp 150
kW 250
TPH Max 22
PRESS Type Munch JayBee Super Ace
Diameter 520 500
Holes 4.7 4
Thickness 50 45
Amp max 250 205
kW 150 110
TPH max 20 20
COOLER Type Counterflow Counterflow
Capacity (tonnes) 3 3
Capacity max, TPH 20 15
Discharge Gravity Pneumatic
31
Table 6. Variables used to calculate retention time at the mixer conditioner
Conditioning specifications Units BBS RAP
Conditioner diameter Metres 0.67 0.45
Conditioner length Metres 2.800 2.300
Total conditioner volume Metre³ 0.987 0.366
Assumed fill 40% 40%
Working conditioner volume Metre³ 0.395 0.146
Mash bulk density Tonnes/metre³ 0.54 0.76
Stock in conditioner (i.e. 1 "fill") Tonnes 0.213 0.111
Press throughput Tonnes per hour 8 11.5
Number of "fills"/hour 37.5 103.4
Retention time Seconds 96 35
Table 7. Processing conditions and responses to increasing sorghum inclusion at the BBS, QAF and RAP mills
Responses BBS QAF RAP
0 40 60 sd 0 40 60 sd 0 40 60 sd
Amp @ press 142 137 142 9.1 206 207 205 3.3 163 159 159 2.1 Bulk density, mash (kg/m3) 568 561 584 7 603 624 630 6 603 616 630 5
Bulk density, pellet (kg/m3) 703 712 726 20 689 717 709 17 760 720 800 9
Water activity, mash 0.6 0.62 0.63 0.3 0.47 0.51 0.54 0.2 0.6 0.62 0.62 0.1 Water activity, pellet 0.66 0.68 0.68 0.2 0.52 0.53 0.54 0.1 0.63 0.63 0.66 0.2 Throughput (TPH) 7.7 7.5 7.5 0.4 9.2 9.7 9.3 0.6 12.1 12.1 11.6 0.4 Durability (%) 97 95.8 96.8 2.1 94.5 87.9 75.5 1.9 90 79 73.5 4.1 Retention time (sec) 113 111 113 2.4 94 94 98 4.5 76 76 82 2.7 SMEp# (kWh/Tonne) 12.2 11.5 12.1 0.5 10.3 10.2 10.5 0.6 7.9 7.7 8.2 0.3 #SMEp = Specific mechanical energy of the press, and it applies to all the tables it appears
C.3.1.2 Effects of conditioning temperature
32
Table 8. Effect of conditioner temperature on mill and pellet characteristics, BBS
Characteristics Temperature (oC)
70 85 105 sd P
Amp @ press 165 131 138 8.8 0.01
Moisture Mash % 12.8 12.0 12.8 0.46 NS
Bulk density Mash (kg/m3) 565 571 578 20 NS
Bulk density Pellet (kg/m3) 728 696 716 22 NS
Water activity (Mash) 0.59 0.61 0.58 0.03 0.05
Water activity (Pellet) 0.66 0.69 0.69 0.02 NS
Throughput (TPH) 7.7 7.1 7.0 0.27 0.1
Durability (%) 96.3 97.1 97.8 1.5 NS
Retention time (sec) 113 109 115 3.4 NS
SMEp (kWh/Tonne) 13.7 10.5 11.6 0.64 0.01
C.3.1.3 Effects of adding surfactants
Inclusion of surfactant at the BBS mill (Table 9) significantly reduced energy use (P<0.001, 139 v 151 amps) and retention time at the press (P<0.05, 106 v 118 sec) while increasing (P<0.05) aw (0.63 v 0.53), moisture content (13.1 v 12.0 %) and throughput (7.6 v 7.0 t/h).
Pellets produced with surfactant at the BBS mill tended (P=0.052) to be longer (13.7 mm) than those produced without surfactant (12.4 mm). In contrast, including a surfactant at the RAP mill (Table 10) had no statistically significant effect on these measures, despite numerically lower values recorded for durability, retention time and SMEp. Whether this inconsistency in results is a consequence of the different surfactants and application methods used at the two sites or some other factor is unclear.
Table 9. Processing conditions and responses to the inclusion of surfactant (KemWet LRTM), BBS
Responses No Surfactant Surfactant sd P
Amp @ press 139 151 7.5 0.01
Moisture of the mash % 12.0 13.1 0.6 0.01
Bulk density, mash (kg/m3) 580 560 0.01 NS
Bulk density, pellet (kg/m3) 703 721 0.03 NS
Water activity, mash 0.53 0.63 0.02 0.05
Water activity, pellet 0.64 0.72 0.021 0.03
Throughput (TPH) 7.0 7.6 0.11 NS
Durability (%) 97.4 96.6 1.1 NS
Pellet length (mm) 12.4 13.7 0.6 0.05
Pellet hardness (kg) 12.2 13.6 1.2 NS
Geometric particle size, mash (mm) 0.504 0.520 0.027 NS
Geometric standard deviation, mash (mm) 2.18 2.14 0.047 NS
Geometric particle size, pellet (mm) 4.81 4.81 0.05 NS
Geometric standard deviation, pellet (mm) 1.16 1.17 0.05 NS
Retention time (sec) 119 106 3.0 0.02
33
Table 10. Processing conditions and responses to the inclusion of surfactant (Bredol), RAP
Responses No Surfactant Surfactant sd P
Amp @ press 156 157 2.2 NS
Bulk density, mash (kg/m3) 613 619 5 NS
Bulk density, pellet (kg/m3) 670 662 5 NS
Water activity, mash 0.61 0.61 0.01 NS
Water activity, pellet 0.64 0.65 0.01 NS
Throughput (TPH) 11.2 11.3 0.3 NS
Durability (%) 82.0 76.4 3.4 NS
Retention time (sec) 79 77 2.7 NS
SMEp (kWh/Tonne) 8.0 7.8 0.21 NS
C.3.1.4 Effect of grind size
Grind size showed significant effects on the initial bulk density of the mixture and the ultimate durability of the product (Table 11). The most striking effect of reducing the size of grain particles prior to mixing was on the durability of the pellet, which increased from 83 to 89% as the hammer mill screen size was reduced from 3 to 2 mm. Although not significant, a reduced grind size also tended to increase throughput and reduce the energy used during processing.
Table 11. Processing conditions and grind size responses, QAF
Responses Grind Size mm
2 3 sd P
Amp @ press 209 220 3.8 NS
Bulk density, mash (kg/m3) 630 608 6 0.05
Bulk density, pellet (kg/m3) 714 696 6 NS
Water activity, mash 0.49 0.49 0.03 NS
Water activity, pellet 0.53 0.52 0.06 0.1
Throughput (TPH) 9.5 9.1 0.57 NS
Durability (%) 88.9 83.0 1.9 0.001
Retention time (sec) 95 95 5.5 NS
SMEp (kWh/Tonne) 10.0 10.7 0.51 NS
C.3.1.5 Effects of sorghum inclusion and processing on pellet size and hardness
34
Table 12. Particle size of feed mixtures before (mash) processing and pellet characteristics in response to increasing sorghum inclusion and temperature, BBS
Characteristics Sorghum inclusion (%) Temperature (oC)
0 40 60 P 70 85 105 sd P
Dgw, mash (mm) 0.535 0.531 0.484 0.05 0.532 0.510 0.508 0.02 NS Sgw, mash (mm) 2.176 2.157 2.164 0.05 2.164 2.170 2.162 0.034 NS Pellet length (mm) 15.0 12.0 12.2 0.001 12.6 13.1 13.4 0.45 NS Pellet hardness (kg) 13.9 12.1 12.7 NS 12.8 12.8 13.0 0.95 NS Dgw, pellet (mm) 4.82 4.84 4.77 NS 4.80 4.79 4.84 0.036 NS Sgw, pellet (mm) 1.17 1.13 1.20 NS 1.17 1.18 1.14 0.038 NS #Dgw = geometric particle size, Sgw = geometric standard deviation, and apply to all the tables where they appear
Reducing the screen size of the hammer mill used at QAF (Table 13) produced a numerical reduction in the particle size of the mixture to be processed but the difference was not statistically significant. The overall results from QAF indicate that grind size had relatively little effect on the physical characteristics of the pellet compared to the highly significant reductions in each measure of pellet quality with progressive increases in sorghum inclusion.
Table 13. Particle size of feed mixtures before (mash) processing and pellet characteristics in response to increasing sorghum inclusion and two grind sizes, QAF
Characteristics Sorghum inclusion (%) Grind size (mm)
0 40 60 P 2 3 sd P
Dgw, mash (mm) 0.509 0.528 0.542 NS 0.513 0.540 0.017 NS
Sgw, mash (mm) 1.999 1.999 1.907 NS 1.955 1.981 0.016 NS
Pellet length (mm) 9.8 8.0 6.7 0.001 8.2 8.3 0.25 NS
Pellet hardness (kg) 6.5 5.0 3.9 0.001 5.0 5.3 0.15 NS
Dgw, pellet (mm) 4.55 4.13 3.81 0.01 4.17 4.16 0.09 NS
Sgw, pellet (mm) 1.38 1.61 1.75 0.01 1.57 1.59 0.05 NS
35
Table 14. Particle size of feed mixtures before (mash) processing and pellet characteristics in response to increasing sorghum inclusion and the use of a surfactant (Bredol), RAP
Characteristics Sorghum inclusion % Surfactant
0 40 60 P No Yes sd P
Dgw, mash(mm) 0.728 0.761 0.794 NS 0.750 0.772 0.036 NS
Sgw, mash (mm) 1.818 1.716 1.705 NS 1.734 1.759 0.026 NS
Pellet length (mm) 13.6 9.5 9.3 0.001 11.2 10.6 0.59 NS
Pellet hardness (kg) 9.7 8.8 7.3 0.02 9.0 8.3 0.55 NS
Dgw, pellet (mm) 4.867 4.689 4.619 NS 4.642 4.806 0.076 NS
Sgw, pellet 1.093 1.319 1.370 NS 1.344 1.178 0.071 NS
C.3.1.6 Effects of processing on particle size distribution
Manipulation of particle size is one of the most important methodologies in stock feed manufacture as it both enhances the uniformity of feed mixtures and increases the surface area of components available for hydration and absorption of sensible heat if undergoing further processing or if fed in mash form, the area available for enzyme digestion. The grains processed at QAF were passed through either a 2 or 3 mm hammer mill screen before being incorporated into diets. Figure 7 shows the retention of grains used in each study on sieves of 2mm, 1mm, 0.5mm, and 0.25mm diameter. The amount of fine particles (<0.25mm) in the grain components ranked around 20-25% for grains obtained from the BBS mill, 15-20% for those from the QAF mill and less than 15% for the RAP mill.
Similar rankings were observed for mash mixtures obtained following the addition of other ration components including protein meals and minerals, Figure 8. The distribution of fine particles (<0.25mm) in the mash mixtures ranged from around 25% for mixtures obtained from the BBS mill to around 15% for those from the QAF mill and approximately 10% for the RAP mill.
The results suggest that the greater proportion of fine particles in the feed mixtures at the BBS mill may also have contributed to the improvement in pellet durability observed at the BBS mill as the proportion of sorghum in the diet was increased compared with the other two mills.
C.3.2 Nutritional characteristics
C.3.2.1 Effects of processing on nutritional quality
The variables describing the in vitro digestion of starch for the diet that were common across
36
Figure 7. Particle size distribution of barley, sorghum and wheat grains used in the manufacture component (sieve size 0 = pan)
Grain Particle Size Retention - QAF001
0% 5% 10% 15% 20% 25% 30% 35% 40% 45% 50%
2 1 0.5 0.25 0
2mm 3mm
Grain Particle Size Retention - RAP
0% 5% 10% 15% 20% 25% 30% 35% 40% 45% 50%
2 1 0.5 0.25 0
Barley Sorghum Wheat
Grain Particle Size Retention - BB001
0% 5% 10% 15% 20% 25% 30% 35% 40% 45% 50%
2 1 0.5 0.25 0
37 Seive Retention - RAP Mash
0% 5% 10% 15% 20% 25% 30% 35% 40% 45% 50%
2 1 0.5 0.25 0
0 40 60
Seive Retention - QAF Mash
0% 5% 10% 15% 20% 25% 30% 35% 40% 45% 50%
2 1 0.5 0.25 0
0 40 60
Figure 8. Particle size distribution of ration mixtures containing nil, 40% or 60 % sorghum as used in the manufacture component(sieve size 0 = pan).
Seive Retention - BBS Mash
0% 5% 10% 15% 20% 25% 30% 35% 40% 45% 50%
2 1 0.5 0.25 0
38
Figure 9. Starch digestion variables of the mash and pellets from the diet common across the three mills.
,-..,
-=
("I80
I-. ~
-
~>.
60
I-.
"0
bIl
=
40
=
....
--
c
.-S
20
~
~
...
,c
0.-S
~
-=
("I I-.~
160
-
~ >. I-.140
"0 bIl=
=
20
....
--
bIl ' - ' I-.00
~-
~S
80
~ I-. ~ ~60
40
20
0Sorghum 40%, 3mm. 850C, No Avizyme, No
Phytase, No Surfcanl
Do 000 K x 10-4 AUCxlOO
- BetterBlend
- QAF
- RA
Do 000 K x 10-4 AUCxlOO
A
Mash/Mixer
Pre0240 Exp0240
B Out/Cooler
39
Figure 10. Difference between mash and pellets in the variables describing starch digestion for the three mills (Insert, RVA parameters: PV = peak viscosity, FV = final viscosity, IV = initial viscosity).
The results show that there were significant differences between the mills in the rate of digestion of starch in the mash diets before pelleting. The K (rate of digestion constant), D240 (digestion at 240 minutes) and AUC (area under the curve) values were all significantly higher for the diet prepared at BBS than when the same diet was prepared at QAF. The values for RAP were intermediate. These differences, particularly in the K and AUC values were maintained for the finished product. However, final D240 values were not significantly different for the pellets produced at the 3 mills. Processing had the largest net effect on the K value at BBS than the other mills. However, the QAF mill produced the greatest change in AUC and D240 following processing.
40 Figure 9B shows that the pellets produced at BBS tended to have higher rates of in vitro
starch digestion than the other mills. A higher rate of in vitro starch digestion at BBS
compared with the other mills was also seen in the mash prior to processing (Figure 9A). Processing tended to cause less of a difference between the mash and pellets at BBS than the other mills in the starch digested in vitro at 240 minutes, area under the curve and peak RVA
(Figure 10). These observations suggest that difference in treatment of the grains and other ingredients prior to mixing may have been the major cause of these differences in starch digestion rates. These differences in the nature of ingredients in the mash may also be responsible for the BBS mill producing the most durable pellets compared with the other mills. It has been stressed above (C.3.1.1) that the high SME in the BBS diets could indicate low RVA parameters and high starch digestibility. As can be seen in the RVA insert in Figure 10, BBS gave the highest drop in the peak and final viscosity, and increase in the initial viscosity. These trends indicate greater disruption to the starch structure, increased starch damage and greater gelatinisation of starch through the BBS mill, possibly as a consequence of the high SME.
C.3.2.2 Effects of processing on pellet composition
Tables 15, 16 and 17 show the effect of processing on the chemical composition of the diets manufactured at each of the 3 mills. There were generally only small effects of processing on the composition of the feeds. The moisture content of all mixtures increased following pelleting because of the addition of steam. The fat content of pellets made at BBS and RAP also increased because both mills added fat to the pellets post-processing. The greatest effect of processing was to increase the proportion of starch that was damaged. This is a measure of breakdown of starch granules and their potential susceptibility to amylase digestion. Damaged starch can also reflect the extent of gelatinisation in the diet.
Table 15. Processing effects on the chemical composition of a pig grower feed manufactured at BBS
Compositions Before processing (Mash) After processing (Pellet) Sorghum inclusion (%) Sorghum inclusion (%)
0 40 60 0 40 60
Protein (%)# 17.4 17.6 18.0 17.9 17.9 17.4
Fat (%)# 2.6 2.6 2.6 3.6 3.6 3.2
Moisture (%) 10.8 10.8 10.7 11.6 11.6 11.4
Ash (%)# 5.4 4.7 4.9 5.3 5.3 4.9
Crude fibre (%) 3.5 3.2 2.7 3.0 3.0 2.7
Nitrogen free extract (%)# 67.6 68.4 68.4 66.2 66.2 68.2
Starch (%)# 50.4 53.5