Article
When to Detect Changes in Object-Based Image
Analysis: Before or after Classification?
Kaisheng Luo1,2,Fu-lu Tao2,*,Juana P. Moiwo3
1 School of Geography and Remote Sensing, Najing University of Information Science and Technology,
Nanjing 210044, China ; [email protected]
2 Key Labrary of surface Pattern and Simulation, Institute of Geographical Science and Natural Research, Chinese Academy of Sciences, Beijing 100101, China; [email protected] (K.S.)
3 Department of Agricultural Engineering, School of Technology, Njala University, Sierra Leone;
* Correspondence: [email protected]; Tel.: +86-15210033827
Abstract:
This study compared two object-oriented land use change detection methods—detection after classification (DAC) and classification after detection (CAD) —based on a digital elevation model, slope data, and multi-temporal Landsat images (TM image for 2000 and ETM image for 2010). We noted that the overall accuracy of the DAC (86.42%) was much higher than that of the CAD (71.71%). However, a slight difference between the accuracies of the two methods exists for deciduous broadleaf forest, evergreen coniferous forest, mixed wood, upland, paddy, reserved land, and settlement. Owing to substantial spectrum differences, these land use types can be extracted using spectral indexes. The accuracy of DAC was much higher than that of CAD for industrial land, traffic land, green shrub, reservoir, lake, river, and channel, all of which share similar spectrums. The discrepancy was mainly because DAC can completely utilize various forms of information apart from spectrum information during a two-stage classification. In addition, the change-area boundary was not limited at first, but was adjustable in the process of classification. DAC can overcome smoothing effects to a great extent using multi-scale segmentations and multi-characters in detection. Although DAC yielded better results, it was more time-consuming (28 days) because it uses a two-stage classification approach. Conversely, CAD consumed less time (15 days). Thus, a hybrid of the two methods is recommended for application in land use change detection.Keywords:object-oriented technique; change detection; eCognition® software; landuse
1. Introduction
Environmental monitoring and natural resources management require the considerably urgent development of operational solutions that can extract tangible information from remote sensing data [1]. Satellite remote sensing has been applied in the mapping of land use since the 1970s, and nearly all types of sensors have been studied [2, 3-5]. Different types of sensors have different advantages; Landsat images are extensively used in obtaining free and large swath, especially in large scale [6-9]. However, while the need for information continues to grow, only a small fraction of stored information in satellite data is often tapped. Transitioning magnanimity data into robust information has never been so important.
detection is essential to timely and accurately detect changes in Earth’s surface features and deepen our understanding of the interactions between man and nature for real-time policy decisions. In addition, its products are important input data for hygrological models [12] and climate models [13 ]and a basis data for eco-environment management [14,15].
Pixel- and object-based image analyses are two methods for detecting changes in land cover/use using a satellite image. Pixel-based methods are generally simple and easy to understand, and numerous algorithms for monitoring the dynamics of land cover/use exist. However, pixel-based methods ignore many available information apart from the pixel spectral value in remote sensing images. Moreover, the results of pixel-based change detection have “salt and pepper” effects [16]. Therefore, traditional pixel-based change detection is not suitable for processing the full range of change information. In contrast, object is the basic unit in the object-oriented method. It consists of a group of homogeneous pixels representing a meaningful object in the real world, including more information regarding shape, texture, and context features.
The shift toward object-oriented image analysis is driven by pixel limitations. Object-based image analysis (OBIA) has been extensively used in numerous countries and regions around the world [17-19]. OBIA is less sensitive to registration errors [20,21] and can effectively solve the “salt and pepper” effect [11,22]. Furthermore, the monitoring results of OBIA is higher than that of pixel-based methods because it completely utilizes object units and pieces of image information
18,23,24. Compared with land use classification, change detection using OBIA is still in its infancy stage
despite several previous studies.
By summarizing previous literature [15,25-32] and references to pixel-based land use change detection methods, we can conclude that two approaches to obtain change information through the object-oriented technique generally exist. One is classifying first and then comparing the classification results, which is a technique known as detection after classification (DAC). The other is detecting the area of change first via spectral similarity analysis and then classifying the results, which is a technique known as classification after detection (CAD). Unfortunately, only a few studies have been performed to compare the two approaches for detecting land cover changes using OBIA. We do not know whether detecting changes in OBIA should be conducted before or after classification. In addition, numerous conclusions from the pixel-based change detection cannot be applied to the object-based change detection of land cover/use because the basic units have essentially changed. Comparing the performance of the two methods further in relation to change detection analysis is necessary to determine which method is superior.
2. Study area and data
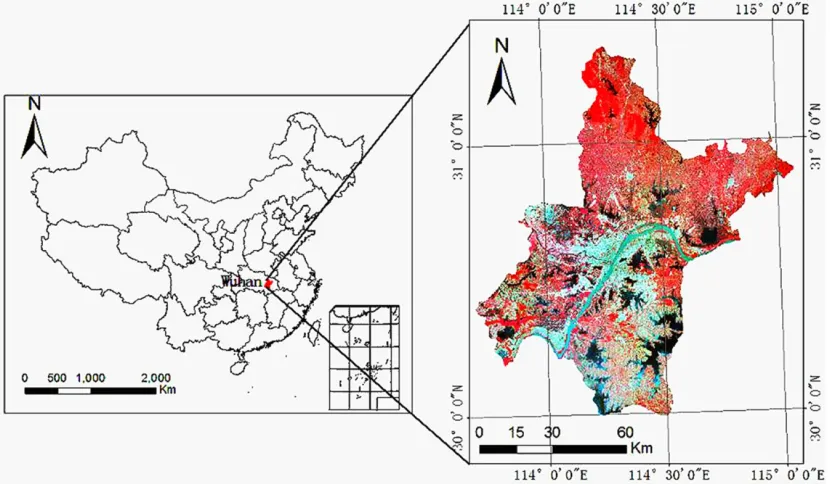
Wuhan is located at the intersection of the middle reaches of the Yangtze River and Hanshui River (the biggest tributary of the Yangtze River). Wuhan has an area of 8,494 km2, covering an expanse of 29°58′‒31°22′N and 113°41′‒115°05′E [33] over an average elevation of 27 m. Wuhan is in a typical subtropical monsoon climate region where the annual mean precipitation is 1,205 mm. The maximum temperature in the hot and rainy summer is 30 °C and the minimum temperature in the cold and dry winter is 3 °C. Surface water (lakes, rivers, and wetlands) is richly distributed in the region, with wetlands accounting for 39% of the 8,494 km2 study area.
[insert Figure 1 here]
Figure 1. A map showing the location of study area in China (left plate) and an expanded view of the 8494 km2 Wuhan study area (right plate).
The TM and ETM images for spring (11 March), summer (28 June), and winter (3 October) of
2000 and the ETM images for spring (21 March), summer (18 June), and winter (15 October) of 2010 were downloaded from the USGS data site together with 30-m resolution Shuttle-Radar DEM and
DEM-based slope maps. Subsequently, Wuhan land use maps of 1:100000 scale for 2000 and 2010 were obtained from the Data Center for Resources and Environmental Science, Chinese Academy of Sciences (RESDC) at http://www.resdc.cn/. These were used as the ground truth for validation of the
land use/land cover classification analysis.
The steps used to pre-process the images included: i) radiometric correction to compensate for the effects of atmospheric decay and ii) geometric correction to place the different images in the same reference system. In this study, the entire image was re-projected into the Gauss–Kruger coordinate system on the Krasovsky datum.
3. Methods
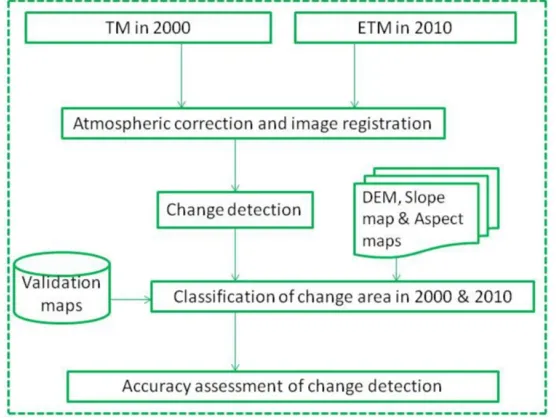
DAC often involves two main steps: i) independently classifying multi-temporal images and ii) comparing the object pairs in the same place, which are identified as change regions for different classes. The first step requires extracting land use information for two respective dates and then determining how objects change over time. The DAC process is graphically depicted in Figure 2.
Figure 2. A flowchart of the processes of Detection After Classification (DAC) technique for image analysis.
CAD detects change areas for two images on two dates by first using the detection function (vector similarity function in this paper) based on the objects and then classifying the objects into change and unchanged objects. Finally, the change objects are classified. The specific processes of CAD are graphically depicted in Figure 3.
A LENOVO workstation with a 64-bit Windows 7 operating system, Intel i3, 1 Terabyte hard drive, and 4 Gigabyte of memory was used. eCognition® 8.64 version was used to execute the OBIA.
3.2. Image segmentation and classification
Image segmentation is the process of delineating an image into homogeneous polygons, laying the basis for classification. Herein, we adopted the bottom-up region-merging [24] algorithm to segment images. In the process, the segmentation process was stopped when the smallest growth of an object exceeded a specific threshold, which is the maximum value or the so-called scale parameter. Trial-and-error and experience are still the best ways because no efficient method for choosing scale parameters exists [34 17]. The multi-resolution segmentation module of eCognition® software was used for segmentation and classification.
A few land use/land cover classification systems exist, including the USGS classification system and the Corine classification system developed by the United Nations Environment Program (UNEP). These systems are limited by the study site. The Land Cover Classification System (LCCS) developed by the Food and Agricultural Organization is extensively used as the standard for land use analysis. On the basis of the data communication and the prevailing conditions in Wuhan, we adopted the LCCS and established the land use classes, as summarized in Table 1.
Table 1. Land use/land cover classification system for Wuhan City study area in China
Code Type Code Type Code Type
23 Hassock 42 Paddy 66 Reserved land
34 Lake 51 Upland 102 Deciduous broadleaf forest
35 Reservoir/pool 52 Settlement 103 Evergreen coniferous forest
36 River 53 Industrial land 105 Mixed forest
37 Channel 54 Road 106 Deciduous broadleaf shrub
112 Green shrub
Object-oriented classification in the eCognition® software provides two classifiers: decision tree (DT) and nearest neighbor (NN). The classification accuracy of DT is higher than that of the NN
approach [34,35]. The DT model (also known as the rule-based model) first builds a classification tree and then completes the classification based on developmental rules [23,24]. In the DT approach,
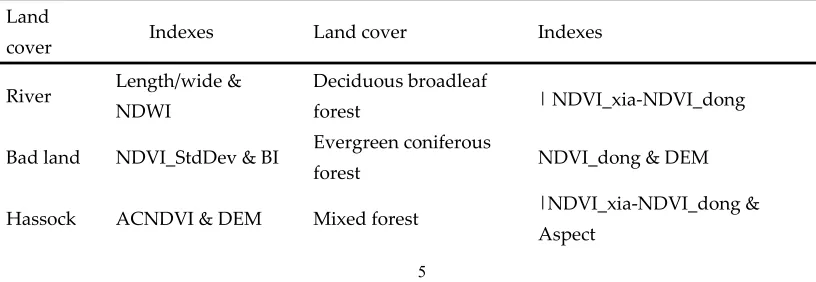
human interaction with the computer exists to allow the selection of suitable features. The DT classifier approach was applied in the DAC and CAD approaches, wherein similar features (Table 2) ensured comparability. For the DAC method, the two outputs of classification before determining the area of change included one class for the 2000 image data and another for the 2010 image data (Figure 5). For the CAD method, two classes (one for each of the 2000 and 2010 image data) also existed within the detected change area.
Table 2. Classification rules for the Detection After Classification (DAC) and Classification After Detection
(CAD) methods
Land
cover Indexes Land cover Indexes
River Length/wide &
NDWI
Deciduous broadleaf
forest | NDVI_xia-NDVI_dong
Bad land NDVI_StdDev & BI Evergreen coniferous
forest NDVI_dong & DEM
Hassock ACNDVI & DEM Mixed forest |NDVI_xia-NDVI_dong &
Road Density & GLCM Industrial land BI & Compactness & Band3/Band1
Chanel Density & GLCM Deciduous broadleaf
shrub NDVI_dong & DEM
Lake SI and MNDWI Reservoir & pool SI & NDWI
Settlement BI & Compactness Green shrub ACNDVI & Rel bord & Region
Paddy SAVI_xia & slope Upland SAVI_xia & Slope
Note: NDVI is normalized difference vegetation index; NDVI_StdDev is standard deviation of NDVI for a year;
ACNDVI is cumulative NDVI in a year; NDVI_dong and NDVI_xia are respectively winter and summer NDVI;
SAVI_xia is soil-adjusted vegetation index for summer; SI is shape index; MNDWI is modify normalized
difference vegetation index; GLCM is gray level co-occurrence matrix; “Rel bord to” is length of adjacent
boundary; “Region” is background of green shrub; BBI is brightness index; Compactness and density are
compactness and density of segmented images respectively; and Length and width are respectively the length
and width of object [36].
3.3. Change detection function
The vector similarity function was adopted to detect the area of change based on the images acquired in winter. The images for both the benchmark and change periods were used as the multi-dimension vectors as conducted for band dimensions [37] and the measurement standard of vectors as the X, Y vector angles. The greater the angle and vector module, the larger the vector difference [34,38]. Thus,
1
1
cos
+
−
=
xy xyR
S
θ
(1) with
= 2 2
cos i i i i y x y x θ
= = 2 2 i i xy y x y x R, (2)
where
θ
is the angle of the vectors X and Y for the 2000 and 2010 images, respectively;R
xy is therate; and
x
i andy
i are the values of thei
band of X and Y, respectively. The smallerS
xy is, thelarger the difference.
3.4. Accuracy assessment
3.4.1. Change area
number of objects. For a more robust accuracy assessment, kappa statistic was incorporated into the error matrix [39].
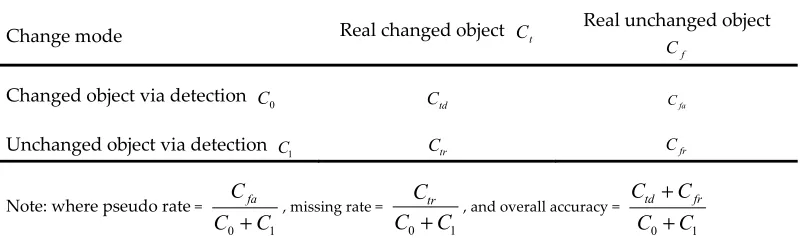
Table 3. Error matrix of accuracy assessment of change area
Change mode Real changed object Ct
Real unchanged object
f
C
Changed object via detection C0 Ctd Cfa
Unchanged object via detection C1 Ctr Cfr
Note: where pseudo rate =
1
0 C
C Cfa
+ , missing rate =
C
0C
1C
tr+
, and overall accuracy = C0 C1C Ctd fr
+ +
Accuracy assessment of the area of change pertains to whether the evaluated detected change area is true or false. The accuracy evaluation of land cover change is important to the decisions on the detection approach, index, and result [21,40]. The extraction of change area is similar to the classification of remote sensing images. Differences across the two classes of the images exist: changed and unchanged classes. Therefore, the error matrix is used to evaluate the accuracy of the change area derived from the classification error matrix. Pseudo rate is the rate of objects that remained unchanged and were detected as the changed objects to the total samples. Missing rate is the objects that changed and were not detected in the total samples. Herein, 304 random samples were used to assess the accuracy of the change area. The samples were obtained from the 1:10 0000 land use maps of Wuhan for 2000 and 2010.
3.4.2. Change direction
Being aware of changes in land cover is not only necessary but also helps in further understanding the direction of change (what changes into what) [21]. The accuracy of change direction is the overall and final estimation of land use change. The results are based on polygonal objects and not on pixels. A sample cannot completely reflect the real situation of an object consisting of a group of pixels. Therefore, the percent area method is used to assess the accuracy of change direction as follows:
a o i
S
S
=
δ
, (3)
where δi is the accuracy of the change direction of
i
class, So is the extracted area of the changearea of
i
class, and Sa is the actual area of change ofi
class.4.Results and discussions
4.1. Image segmentation and classification
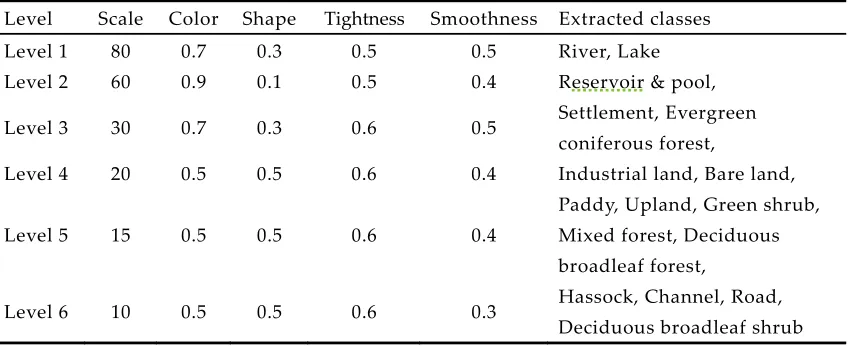
the land use information was finally extracted at six levels (with segmentation scales of 80, 60, 30, 20, 15, and 10) after repeated efforts (Table 4). Rivers and lakes were extracted at level 1, and reservoirs and pools at level 2. Extracting paddy, upland, green shrub, mixed forest, and deciduous broad-leaf forest was ideal at scale 15. Hassock, channel, road, and the deciduous broadleaf shrub were extracted at scale 10. Settlement and evergreen coniferous forest were extracted at scale 30, and the industrial and bare lands at level 4.
Figure 4. Results of the Wuhan City study area image segmentation at different scales: (a) scale 80, (b) scale 60, (c) scale 30, (d) scale 20, (e) scale 15 and (f) scale 10.
Table 4. Segmentation system and parameters of the Wuhan City study area images for 2000 and 2010
Level Scale Color Shape Tightness Smoothness Extracted classes
Level 1 80 0.7 0.3 0.5 0.5 River, Lake
Level 2 60 0.9 0.1 0.5 0.4 Reservoir & pool,
Level 3 30 0.7 0.3 0.6 0.5 Settlement, Evergreen
coniferous forest,
Level 4 20 0.5 0.5 0.6 0.4 Industrial land, Bare land,
Level 5 15 0.5 0.5 0.6 0.4
Paddy, Upland, Green shrub, Mixed forest, Deciduous broadleaf forest,
Level 6 10 0.5 0.5 0.6 0.3 Hassock, Channel, Road,
Deciduous broadleaf shrub
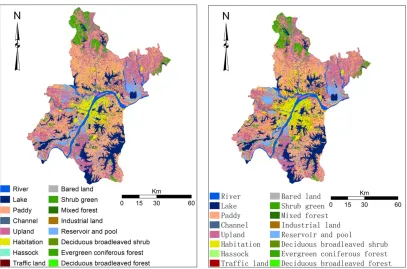
Figure 5. Results of CAD (Classification After Detection) land cover classification for Wuhan City study area (a) for 2000; (b) for 2010.
With regard to accuracy, the overall accuracy using DAC was 80.02% for 2000 and 83.4% for 2010, which were approximately 20% higher than those of CAD. The Kappa coefficient was 0.76 and 0.78 for 2000 and 2012 for DAC, respectively, which were approximately 21% higher than those of CAD. For CAD, although error accumulation occurred from the extraction of change area, which later limited the classification boundary, the detection function generally only used spectral information and not multi-level information, such as shape, texture, context, and adjoin. The change area comprised isolated and sporadic objects rather than an intact background and context. Thus, several pieces of information (except for spectral information) disappeared.
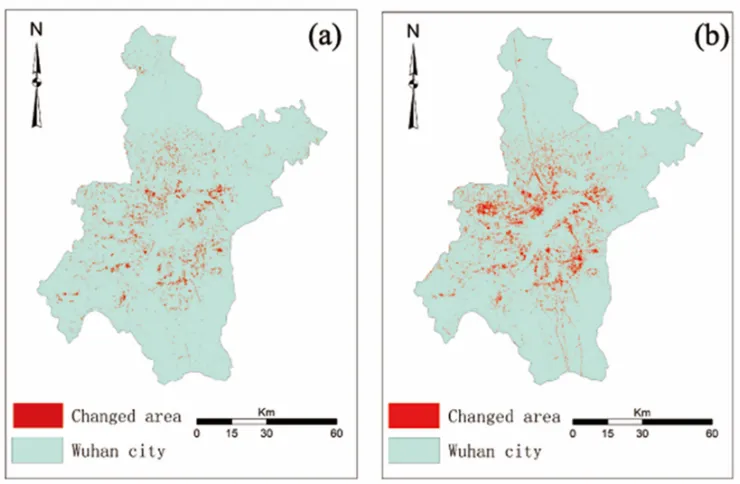
4.2. Change area
For DAC, two classified maps for 2000 and 2010 were superimposed in ArcMap to calculate the change fields by subtraction after the land cover output from the eCognition® software. The detailed process is illustrated in Figure 6 and the change area is depicted in Figure 7.
For the CAD, using a vector similarity function to detect change area is essentially dividing the entire image into two categories: changed and unchanged classes. The detection function threshold is a critical step. If the function value is smaller than the threshold, the difference between the objects is large and is classified as a change area, and the opposite phenomenon is the unchanged area. A sample approximation method integrated with visual interpretation was used to determine the threshold. First, 30 completely changed samples were selected from the land cover maps, which were subsets of the change area. The value of the detection function was t when the change area contained only 30 samples. The threshold must belong to [0, t], which was set at t = 0.74 through repeated trials at an increment of 0.2 per trial (Figure 6). The change area is plotted in Figure 7.
Figure 6. Remote sensing image for (a) 2000, (b) 2010 and change objects for a threshold of 0.72 similarity function (c).
4.3. Accuracy assessment
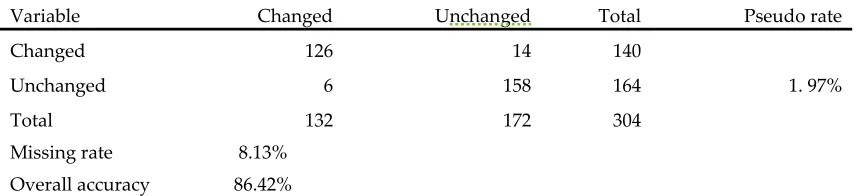
The missing and pseudo rates were 11.84% and 16.45% for the CAD analysis (Table 5) and 8.13% and 1.97% for the DAC analysis (Table 6), respectively. Also, the overall accuracy were 71.71% for the CAD analysis (Table 5) and 86.42% for the DAC analysis (Table 6). Both the pseudo and missing rates of the DAC analysis were lower than those of the CAD analysis. Furthermore, the DAC analysis also had a much higher overall accuracy than the CAD analysis. This suggested that the DAC analysis is better than the CAD analysis in extracting land use change variables. This can be attributed to the DAC analysis on the feature scale, whose accuracy depended on the classification results. The object-oriented classification technique completely utilizes several variables (e.g., spatial, textural, spectral, and contextual), which obviously improve classification results [5,41] and is an important merit of this method. Furthermore, the boundary of change area is initially unlimited, but adjustable in the process of classification and is later decided by differences in categories. This is where the difference from the earlier land use to the latter land use is considered as the land use change.
Table 5. CAD (Classification After Detection) error matrix for computed change area in Wuhan City study area
Variable Changed Unchanged Total Pseudo rate
Changed 104 36 140
16.45%
Unchanged 50 114 164
Total 152 152 304
Missing rate 11.84%
Overall accuracy 71.71%
Table 6. DAC (Detection After Classification) error matrix for computed change area in Wuhan City study area
Variable Changed Unchanged Total Pseudo rate
Changed 126 14 140
1. 97%
Unchanged 6 158 164
Total 132 172 304
Missing rate 8.13%
Overall accuracy 86.42%
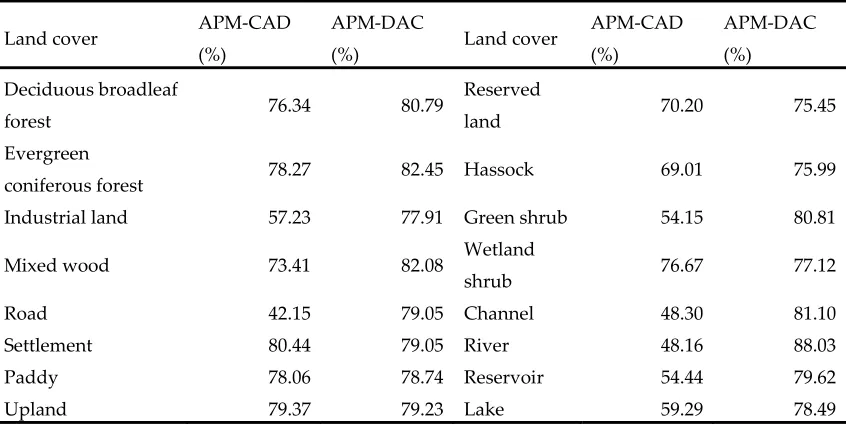
Table 7. Accuracy of computed changes in land use in Wuhan City study area, China
Land cover APM-CAD
(%)
APM-DAC
(%) Land cover
APM-CAD
(%)
APM-DAC
(%)
Deciduous broadleaf
forest 76.34 80.79
Reserved
land 70.20 75.45
Evergreen
coniferous forest 78.27 82.45 Hassock 69.01 75.99
Industrial land 57.23 77.91 Green shrub 54.15 80.81
Mixed wood 73.41 82.08 Wetland
shrub 76.67 77.12
Road 42.15 79.05 Channel 48.30 81.10
Settlement 80.44 79.05 River 48.16 88.03
Paddy 78.06 78.74 Reservoir 54.44 79.62
Upland 79.37 79.23 Lake 59.29 78.49
Note: APM-CAD is accuracy (δi value) of CAD method; and APM-CAD is accuracy (δi value) of DAC method.
Compared with the pixel-based method, the advantages of object-oriented technology lie in the use of spatial, textual, and contextual information rather than spectral information. A smoothing effect attributed to spectral information smoothing in pixel grouping occasionally occurred2,27. The
accuracy of the CAD approach based on medium resolution and high-resolution imagery were possibly low because the change detection function was determined by spectral information. Smoothing effect confuses the increase in spectral variability, which further increases errors of change area. OBIA first groups pixels into objects [9]. Therefore, the advantage of high spatial spectral variability for high-resolution imagery was not presented. The accuracy of the DAC approach was possibly higher because the high-resolution imagery provided more information for classification comparison with medium-resolution imagery.
5.Conclusion and summary
Both change detection methods had their own advantages and disadvantages. DAC had higher accuracy but was more time-consuming, taking 28 days to complete the classification for the two periods and requiring suitable decision trees and regulations to determine the overall change detection. By contrast, CAD only involved the classification of change area. Therefore, change detection using CAD was fast, taking only 15 days to complete the same classification.
Focusing further studies on developing a hybrid land cover change detection approach that combines CAD and DAC based on the merits of the approaches is necessary. However, this requires a significant improvement in the object-oriented technology and the field of image segmentation for the optimal scale. This also requires more experiments to determine better features that can be used in classification.
Acknowledgements:This study was funded by the National Foundation of China (Nos. 91325302, 41571088, and 31561143003).
Conflicts of Interest: The authors declare no conflict of interest.
References
1 Blaschke, T. Object based image analysis for remote sensing. Isprs J Photogramm.2010,65, 2-16.
2 Li, X. J.; Meng, Q. Y.; Gu, X. F.; Jancso, T.;Yu, T.;Wang, K.; Mavromatis, S.A hybrid method combining
pixel-based and object-oriented methods and its application in Hungary using Chinese HJ-1 satellite
images. Int J Remote Sens.2013,34, 4655-4668.
3 Leinenkugel, P., Esch, T.; Kuenzer, C. Settlement detection and impervious surface estimation in the
Mekong Delta using optical and SAR remote sensing data. Remote Sens Environ.2011,115, 3007-3019. 4 Qian, Y. G., Zhou, W. Q., Yan, J. L., Li, W. F. ; Han, L. J. Comparing Machine Learning Classifiers for
Object-Based Land Cover Classification Using Very High Resolution Imagery. Remote Sensing.2015,7, 153-168.
5 Frohn, R. C.; Autrey, B. C.; Lane, C. R.; Reif, M. Segmentation and object-oriented classification of
wetlands in a karst Florida landscape using multi-season Landsat-7 ETM+ imagery. Int J Remote Sens
2011,32, 1471-1489.
6 Raval, S.; Shamsoddini, A. A monitoring framework for land use around kaolin mining areas through
Landsat TM images. Earth Sci Inform. 2014,7, 153-163.
7 Schmitt-Harsh, M.; Sweeney, S. P.; Evans, T. P. Classification of Coffee-Forest Landscapes Using
Landsat TM Imagery and Spectral Mixture Analysis. Photogramm Eng Rem S7. 2013,9, 457-468.
8 Wang, Z. J.; Jiao, J. Y.; Lei, B.; Su, Y. An approach for detecting five typical vegetation types on the
Chinese Loess Plateau using Landsat TM data. Environ Monit Assess.2015,187,577.
9 Wang, Z. Q.; Gang, C. C.; Li, X. L.; Chen, Y. Z.; Li, J. L. Application of a normalized difference
impervious index (NDII) to extract urban impervious surface features based on Landsat TM images.
Int J Remote Sens . 2015, 36, 1055-1069.
10 Herendeen, B. L.; Bhatia, S. K.; Singh, A. Symmetrical and Unsymmetrical Coupling of Alkyl-Halides
Mediated by Grignard Reaction. Synthetic Commun. 1989, 19, 2899-2907.
11 Hussain, E.; Shan, J. Object-based urban land cover classification using rule inheritance over very
high-resolution multisensor and multitemporal data. Gisci Remote Sens.2016, 53, 164-182.
12 Luo, K. S.; Tao, F. L.; Moiwo, J. P.; Xiao, D. P. Attribution of hydrological change in Heihe River Basin
to climate and land use change in the past three decades. Sci Rep-Uk.2016, 6, 1-12.
13 Wu, W. B.; Verburg, P. H.; Tang, H. J. Climate change and the food production system: impacts and
adaptation in China. Reg Environ Change.2014, 14, 1-5.
14 Boschetti, L.; Roy, D. P.; Justice, C. O.; Humber, M. L. MODIS-Landsat fusion for large area 30 m
burned area mapping. Remote Sens Environ .2015,161, 27-42.
15 Lu, M.; Chen, J.;Tang, H. J.;Rao, Y. H.;Yang, P.; Wu, W. B. Land cover change detection by integrating
object-based data blending model of Landsat and MODIS. Remote Sens Environ . 2016, 184, 374-386. 16 Luo, K. S.; Li, R.D. Dynamic monitoring land-cover change in Hubei province using object-oriented
technology and remote sensing imagery." Transactions of the Chinese Society of Agricultural Engineering. 2013,29 ,260-7.
17 Lindquist, E. J.; D'Annunzio, R. Assessing Global Forest Land-Use Change by Object-Based Image
Analysis. Remote Sensing. 2016, 8,678. .
Object-Based Image Analysis: A Case Study from Maricopa, Arizona. Remote Sensing. 2014, 6, 6089-6110.
19 De Santiago, F. F.; Kovacs, J. M.; Lafrance, P. An object-oriented classification method for mapping
mangroves in Guinea, West Africa, using multipolarized ALOS PALSAR L-band data. Int J Remote Sens . 2013, 34, 563-586.
20 Hussain, M.; Chen, D. M.; Cheng, A.; Wei, H.; Stanley, D. Change detection from remotely sensed
images: From pixel-based to object-based approaches. Isprs J Photogramm.2013, 80, 91-106.
21 Chen, G.; Zhao, K. G.; Powers, R. Assessment of the image misregistration effects on object-based
change detection. Isprs J Photogramm. 2014, 87, 19-27.
22 Toure, S.; Stow, D.; Shih, H. C.; Coulter, L.; Weeks, J.; Engstrom, R.; Sandborn, A. An object-based
temporal inversion approach to urban land use change analysis. Remote Sens Lett. 2016, 7, 503-512. 23 Teo, T. A.; Huang, C. H. Object-Based Land Cover Classification Using Airborne Lidar and Different
Spectral Images. Terr Atmos Ocean Sci . 2016, 27, 491-504.
24 Li, M. M., Bijker, W. & Stein, A. Use of Binary Partition Tree and energy minimization for object-based
classification of urban land cover. Isprs J Photogramm102, 48-61, doi:10.1016/j.isprsjprs.2014.12.023 (2015).
25 Carvalho, L. M. T.; Fonseca, L. M. G.; Murtagh, F.; Clevers, J. G. P. W. Digital change detection with
the aid of multiresolution wavelet analysis. Int J Remote Sens.2001, 22, 3871-3876.
26 Civco, D. L.; Hurd, J. D.; Wilson, E. H.; Song, M. ; Zhang, Z. in ASPRS-ACSM Annual Conference.
27 Walter, V. Object-based classification of remote sensing data for change detection. Isprs J Photogramm
2004, 58, 225-238.
28 Gamanya, R.; De Maeyer, P.; De Dapper, M. Object-oriented change detection for the city of Harare,
Zimbabwe. Expert Syst Appl.2009,36, 571-588.
29 An, K.; Zhang, J.; Xiao, Y. Object-oriented urban dynamic monitoring — A case study of Haidian
District of Beijing. Chinese Geographical Science. 2007, 17, 236-242.
30 Liu, L.; Wen, X.; Gonzalez, A.; Tan, D.; Du, J.; Liang, Y.; Xiang, D. An object-oriented daytime
land-fog-detection approach based on the mean-shift and full lambda-schedule algorithms using
EOS/MODIS data. Int J Remote Sens. 2011, 32, 4769-4785.
31 Du, X.; Zhang C.; Yang, J.; Su, W. A New Multi-Feature Approach to Object-Oriented Change
Detection Based on Fuzzy Classification. Intelligent Automation & Soft Computing.2012, 18, 1063-1073. 32 Luo, K. S.; Li, R.D. Rearch Progress in Choosing Objected-oriented optimal Segmentation Scale. World
Sci-Tech R&D. 2013, 35, 75-79.
33 Lu, S. S.; Guan, X. L.; He, C.; Zhang, J. L. Spatio-Temporal Patterns and Policy Implications of Urban
Land Expansion in Metropolitan Areas: A Case Study of Wuhan Urban Agglomeration, Central China.
Sustainability-Basel . 2014, 6, 4723-4748.
34 Luo, K. S.; Li, R.D. Method for wetland type extraction using remote sensing combing object-oriented
and tasseled cap transformation. Transactions of the Chinese Society of Agricultural Engineering,
2017, 33, 198-203.
35 Goodin, D. G.; Anibas, K. L.; Bezymennyi, M. Mapping land cover and land use from object-based
classification: an example from a complex agricultural landscape. Int J Remote Sens. 2015, 36, 4702-4723.
36 Luo, K. S.; Li, R.D. Dynamic monitoring land-cover change in Hubei province using object-oriented
2013, 29, 260-267.
37 Xian, G.; Homer, C.; Fry, J. Updating the 2001 National Land Cover Database land cover
classification to 2006 by using Landsat imagery change detection methods. Remote Sens Environ.2009, 113, 1133-1147.
38 Xue, L.; Ning, S.; Yan, W. Segment-based Land Use Change Detection Using the Similarity of Vector.
Remote Sensing Information.2009, 6, 7-10.
39 Aguilar, M. A.; Saldana, M. M.; Aguilar, F. J. GeoEye-1 and WorldView-2 pan-sharpened imagery for
object-based classification in urban environments. Int J Remote Sens.2013, 34, 2583-2606.
40 Yue, A. Z.; Zhang, C.; Yang, J. Y.; Su, W.; Yun, W. J.; Zhu, D. H. Texture extraction for object-oriented
classification of high spatial resolution remotely sensed images using a semivariogram. Int J Remote
Sens . 2013, 34, 3736-3759.
41 Flores De Santiago, F.; Kovacs, J. M.; Lafrance, P. An object-oriented classification method for mapping