Technical Efficiency of Barley Production: The Case of Smallholde Farmers in Meket District, Amhara National Regional State, Ethiopia
Getachew Wollie
Samara University, Department of Economics
Email address for corresponding author; getachewwollie53@gmail.com
ABSTRACT
This study analyzed the technical efficiency of barley production by smallholder farmers in Meket district, Amhara National Regional State, Ethiopia . A cross sectional data from a sample of 123 barley producers during the 2016/17 production season was collected by applying two stage random sampling. To address the objective of the study, both descriptive statistics and econometric models were used to analyze the data. The trans-log functional form of the production function simultaneously with single stage estimation approach was used to estimate the production of barley output and technical inefficiency factors. The estimated stochastic production frontier model indicated that input variables such as fertilizer, human labor and oxen power were the significant variables to increase the quantity of barley output while, barley seed had a negative effect. The estimated mean levels of technical efficiency of the sample farmers were about 70.9% which revealed that, presence of a room to increase their technical efficiency level on average by 29.1% with the existing resources. The discrepancy ratio gamma indicated that 63% of the total variation from the frontier comes due to technical inefficiency while, the remaining 37% comes due to factors outside the control of farmers. Among the hypothesized factors that affect technical inefficiency; education level, extension contact and number of barley plots significantly and negatively affected technical inefficiency score. Besides, practice of crop rotation, distance of residence from the nearest main market, total expenditure and soil fertility was found to have a positive and significant effect. Hence, emphasis should be given to decrease the inefficiency level of those more inefficient farm households via experience sharing among the farmers and usage of improved or certified barley seed. Besides to this, policies and strategies of the government should be directed towards increasing farmers’ education, improve the system of input distributions and institutional facilities.
Keywords: Technical Efficiency; Stochastic Frontier; Trans-log; Meket; Barley
1. INTRODUCTION
Ethiopia is ranked 21th in the world in terms of barley production with a share of 1.2% of the
world’s total production and the second largest barley producer in Africa, next to Morocco
and followed by Algeria, accounting about 25% of the total barley production in the
continent (Abu and Teddy, 2014; FAO, 2014). Ethiopia is not only the largest producer but
also the biggest consumer of barley in Africa. At the national level, barley accounts for about
5.6% of the per capita calorie consumption as a main ingredient in staple foods and local
drinks. Hence, in relation to its dynamic nature and wide range of uses, barley is known as
the “king of grains”. Unlike in industrialized countries where barley is mainly used for
animal feed and malting, barley is important for developing countries in terms of the lives
and livelihood of smallholder farmers. It also a substitutable crop for other cereals in the
country and serve as a roof thatch for many highlanders. (Berhane et al., 2011; CSA, 2014).
At the national level from the total area of cereals allocated in hectare, barley covered only
14.65% producing 13.37% quintals with the yield of 10.42 quintal per hectare. The total
yield of barley has been increased by 4.99% between 2013/14 and 2014/15 and also by 5.2%
to the year 2015/16 (CSA, 2016). Furthermore, among the major cereals, barley is found to
have experienced the highest annual fluctuation in area and yield. Hence, this fluctuation in
barley yield and area shows that barley has received far less attention compared to the other
major cereals, especially teff, maize and wheat (Shahidur et al., 2015).
Rapid population growth multiplies the problems concerning food and other fundamental
human needs. Increasing food production is itself a complex process involving more
intensive and extensive use of land and water, increased availability of basic agricultural
inputs, appropriate agricultural policies and rural institutions and strengthened agricultural
researches. However, if effort is made, the potential for increasing food production in every
country in the world would be substantial. But, there is still yield gap between the output
obtained from research stations and farmer’s field. There are several factors believed to
contribute to the low yield including moistures stress, shortage of seeds for improved
varieties, degradation of soil fertility, insect pests, diseases, weeds and birds (Aung, 2012).
This higher gap between yields of crops under farmer’s management and what it can be
this gap by increasing their crop production and earn higher yield as much as possible equal
to the yield obtained at a research farm.
In Meket district, Barley is a major stable food and it takes the lion share in terms of the
extent of production, food consumption, number of producers and area coverage relative to
other major cereals grown in the district but, its production was owned by small holder
farmers which produces only to survive their hand to mouth livelihood. Therefore, it is
crucial to increase their volume of production and efficiency at least to secure their food
needs at family level.
There are different empirical studies which were employed within Ethiopia and abroad in
different agro-climatic and socio-economic conditions indicated the existence of efficiency
differentials among small-scale farmers at different time period. Moreover, the findings or
conclusions of some of them are not consistent with one another because of, different agro
ecological nature, farming system, and other factors. Therefore, policy implications drawn
from those empirical works also may not allow in designing area specific policies to be
compatible with its socio-economic as well as agro-ecologic conditions. Hence, this study
intends to fill these gaps by having the general objective of this study was to analyze the
economic efficiency of barley production the case of smallholder farmers in Meket district,
Amhara National Regional State, Ethiopia. The specific objectives of the study were also to
estimate the level of technical efficiency of small holder barley producers and to identify the
determinants for variation of inefficiency of barley producers in Meket district.
2. METHODOLOGIES
Study areas
Meket district is one of the eleven districts in North Wollo zone of Amhara National Regional
State, Ethiopia which is located 600 km north of Addis Ababa and bordered on the south by
Wadla districts, on the west by Debub Gondar Zone, on the northwest by Bugna districts,
on the north by Lasta, on the northeast by the Gidan districts and on the east by
Guba-Lafto districts. There are four main agro-climatic zones in the district. These are the
semi-arid lowlands less than 2,300 masl, the sub-humid midlands from 2,300 to 2,800 masl, the
over 3,200 masl, is often battered by frost and hail. Currently, the total population of Meket
has been reached to 263,567 of them 51.67% were male and that of 48.33% were females.
Sampling Technique and sample size
The sampling technique employed in this study was two-stage sampling technique. Meket
districts has a major barley producers and large extent of production in the zone. From the
total 47 kebeles of Meket district only 21 kebeles produce barley. In the first stage, a total of
three sample kebeles from 21 barley producer kebeles in the district were randomly selected.
In the second stage, 123 sample farmers were selected by using simple random sampling
technique from each kebele based on probability proportional to size.
The sample size of farmers was determined by applying Yamane’s (1967) formula of
calculating sample size with confidence interval of 95% and variability 0.05.
2 1 N eN n
1
Where: n= the sample size, N= number of barley producer households in Meket district in
2015/16 production season (which is 18036), e= margin of error (which equals with 9%)
then, n =122.6 but, the sample size held in this study was 123.
Both primary and secondary data were used for this study. Primary data were collected from
a cross sectional sample representative 123 farm households from three rural kebele’s
through questionnaires. Secondary data also collected from different governmental and
non-governmental institutions including both published and unpublished documents at zonal and
district level regarding the baseline general information to support the primary data.
Method of Data Analysis
Descriptive statistics and econometric models were employed to achieve the objective of
the study. The descriptive statistics includes means, standard deviation, minimum,
maximum, frequencies and percentage. Regarding the econometric model, different tests
of hypothesis were considered to select the appropriate functional form and model which
can fit to the data set. After conducting all the required hypothesis and make decision, a
transcendental logarithmic functional form simultaneously with one stage estimation
The output of barley was modeling in terms of five major input variables namely, amount of
fertilizer, amount of human labor, quantity of seeds, oxen power and land allocated for barley
crop. The transcendental logarithmic functional forms of the production function were
expressed as;
X expF
Y (2)
Where, Y= barley output, Xi= vector of input quantities, βi = a vector parameters to be
estimated and ε= composed error consisting of element U and V,
The random disturbance term Vi captures the effects of statistical noise on observed output
outside the farmers control including measurement errors, climate change, topography, soil
type, and others while, the stochastic noise Ui > 0 is included to capture effects from
technical inefficiency. Hence, both U and V are independent of each other (Aigner et al.,
1977).
According to Aigner et al. (1977), the advantage of this approach is we can estimate the
variance of Vi and Ui, productive efficiency should be measured by the ratio of
] ) ; (
[ i i
i V X F Y
rather than by the ratio of ( i;)
i
X F
Y
and lastly it distinguish productive
inefficiency from other source of disturbances that are beyond the farmers control. The
implicit trans-log form of the stochastic frontier production model was specified as follows;
20 1 20 1 20 10 *ln *ln
2 1 ln * ln ln i i j jk ik ij i ik i
i x x x
Y (3)
i i i i i i i i i i i i i i i i i i i i i X X X X X X X X X X X X X X X X X X X X Y 20 20 19 19 18 18 17 17 16 16 15 15 14 14 13 13 12 12 11 11 10 10 9 9 8 8 7 7 6 6 5 5 4 4 3 3 2 2 1 1 0 ln ln ln ln ln ln ln ln ln ln ln ln ln ln ln ln ln ln ln ln ln (4)
Where, Ln=Logarithm to base e, βi = the unknown parameters estimated, i=1, 2, 3. . . nth
farmer, j=inputs of production used, Yi= Output of barley, X1= Land allocated for barley
crop (ha), X2= Labor power (man-days), X3= Amount of barley seeds used (kg), X4= Oxen
power (oxen days), X5= Quantity of fertilizer used in barley crop (kg), from X6 to X20 are
the Square and interaction terms of those major five inputs, ε = Random composed
Technical inefficiency scores were estimated on hypothesized farm related, socioeconomic
and institutional factors using a one stage estimation procedure in frontier model
simultaneously with the production function. The technical inefficiency model was specified
as using:
) ( )
;
( i i i i i
i f x v z
Y (5)
Where, Yi is barley output and Zi is different farm specific, socioeconomic and institutional
variables that affect technical inefficiency.
i i i i i i i i i i i i i i i p p p p p p p p p p p p p Z 13 13 12 12 11 11 10 10 9 9 8 8 7 7 6 6 5 5 4 4 3 3 2 2 1 1
0 ln ln
(6)
Where Y* = Technical inefficiency ratio, P1 = Farming experiences of farmers in barley
production (years), P2 = Farmer education level (years of schooling), P3 = Frequency of
extension contact (numbers), P4 = Amount of credit taken (Ethiopian birr), P5 = Number of
barley plots (number), P6 = Total expenditure of households (Ethiopian birr), P7 = Crop
rotation (0= if they practice crop rotation, 1 otherwise), P8 = Participation on non-farm
income (0= if yes and= 1 if no), P9 = Livestock holding (TLU), P10= Fertility status of the
soil (0=fertile, 1=otherwise), P11= Distance to market (kilometers), P12= Gender (0 if the
household headed are male and 1 other wise) and P13=Distance of the plot from farmers
home (walking minutes)
4. RESULTS AND DISCUSSIONS
Descriptive Results about Barley output and input usage
Output of barley was the dependent variable in the production function and estimated mainly
with five important inputs which are fertilizer, seed, labor, oxen power and land that
employed on the study area. The mean of barley output for the sample household in the study
area in the 2015/16 production season was relatively 17 quintal with a minimum of 4 quintal
to a maximum of 45 quintals. Generally, the average inorganic fertilizer application for the
production of barley among the respondent was 40.52 kilogram and allocated 1.49 hectare
of their farm plot for barley production. The sample households apply only local barley seed
with an average of nearly 83.5 kilogram which was lower than the forecasting way of
recommended barley seed rate (120 kilogram /hectare). On average, a total of 54.1 man days
Table 1. Summary of barley outputs with major five inputs
Variable Mean Standard Deviation Minimum Maximum
Output(quintal) 16.94 9.22 4 45
Fertilizer amount (kg) 40.52 32.35 0 200
Seed amount (kg) 83.47 40.44 18 180
Human labor (MDs) 54.1 16.31 20 80
Oxen power (ODs) 34.88 8.91 20 50
Land under barley (ha) 1.49 0.78 0.25 5
Source: Own computation (2017)
The mean education level of the sample household in the study area was 2.54 ranging from
0 to grade 10. The mean frequency of extension contact was relatively nine times with a
minimum of twice to a maximum of 18 times per barley production season. The average
farming experience of the sample farmers in barley production were 33.62 years with a
minimum of 5 years to that of a maximum of 62 years. It was also found that, the mean
number of plots allocated for barley crop was 2.21 located at maximum of 4 plots in different
location or site. In addition, on average a farmers must walk relatively one hour to reach on
their farm plot. On average livestock population of the sample household farmers measured
in tropical livestock unit was 3.29 with a minimum of 0.815 to a maximum of 15. The mean
total expenditure of the sample households was 1279.92 birr within the range of 300 birr and
5000 birr. The mean amount of credit obtained from different sources was 1775.61 birr
ranging from null to 7000 birr. The mean distances of the nearest market to the farmers was
5.31 km and is ranging between 2 km and 12 km.
Sample respondents were composed of both male and female household heads. Out of the
total sampled household head farmers about 80.49% were male headed and the remaining
19.51% were female headed households. As it was presented in Table (5), 19.51% of the
sample households were not practicing crop rotation while, the remaining 80.49% was
adopted the practice of crop rotation. Based on their perceptions, about 24.39% of the
respondents classified the fertility status of their barley plot on average as infertile class
while, 75.61% respondents graded it as fertile. The same table also told that, majority (which
is 58.54%) of the farmers had participated on different non-farm income activities while
Table 2. Summary of variables that affect technical inefficiency
Variables Mean Standard
Deviation
Percentage of the mean with dummy 0
Percentage of the mean with dummy 1
Level of education 2.54 3.02
Extension contact 9.31 3.14
Farming experience 33.63 12.48
Number of barley plots 2.21 .77
Distance of plots 56.78 30.18
Total expenditure 1279.92 634.90
Livestock holding 3.29 2.29
Amount of credit 1775.61 1759.91
Distance to market 5.31 2.35
Sex 19.51 80.49
Crop rotation 19.51 80.49
Soil fertility 24.39 75.61
Non-farm income 41.46 58.54
Results of Econometric Models 1. Hypothesis testing
The first hypothesis was that selecting the appropriate functional form which fits to the data
set by using likelihood ratio test. The most commonly functional forms reviewed in most
previous researches were Cobb-Douglas and Trans-log. Then by applying the likelihood
ratio test statistic which isLR2[lr(CobbDouglas)lr(Translog)], the null hypothesis was rejected implies that the trans-log functional form adequately represented the data set.
Table 3. Generalized likelihood ratio tests of hypothesis for the parameters of the SPF
Null hypothesizes LH0 LH1 Calculated value
Critical value of χ2(0.05)
Decision
H0: βij=o -84.25 -70.43 27.64 24.99 Reject H0
H0: γ=0 0.63 Reject H0
H0: δ1=δ2=...=δ13=0 -88.54 -70.43 36.22 22.36 Reject H0
The second hypothesis was conducted to decide whether the average production function
without considering non-negative random error term best fits the data set or not. H0= γ =0
and H1= γ >0. The gamma (γ) parameter is defined as the ratio of the unexplained inefficiency error term (δu2) to the total sum of errors (δu2+δv2). Since, the value of gamma
is 63% which indicated that there was technical inefficiency so, the traditional production
function is not an adequate representation of barley production in this study.
Thirdly, the null hypotheses say that a model without explanatory variables of inefficiency
effects while, the alternative hypothesis says the full frontier model with explanatory
variables are supposed to determine inefficiency. Therefore, explanatory variables of
technical inefficiency can together determine variation in production of barley output in the
study area.
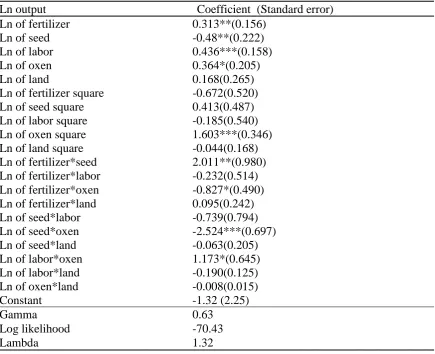
2. Estimation of production function
The dependent variable in estimation of stochastic production function was barley outputs
produced in quintals analyzed on the five major inputs with their square and interaction
terms. The major five inputs were land under barley, amount of barley seed, quantity of
fertilizer, human labor and oxen power. The stochastic frontier model estimates both the
trans-log functional forms of production function and variables of technical inefficiency
simultaneously by using the first stage estimation approach.
As it presented in Table (3) looking from the output of the model below, seed had negative
and significant effect on the output of barley at 5% level of significance. The negative effect
was might be due to the reason that, the farmers use low quality local seed below the
recommended rate (120 kg/hectare) and they did not apply improved barley seed that
improves the quantity of barley output in the study area. Fertilizer is one of the necessary
inputs to improve barley output by maintaining soil fertility and it was significant at 5% level
of significant. Hence, a farmer who increased the application of fertilizers in turn earns more
output of barley. Labor had a positive sign and significantly affected barley output at 1%
level of significance. In order to increase their barley output farmers must increase their
family or hired labor for performing different farming operation on the field. In most
activities like ploughing and sowing crops. In line to this, oxen power had a significant and
positive effect on farmers barley output in the study area.
Table 4. Production function model
Ln output Coefficient (Standard error)
Ln of fertilizer 0.313**(0.156)
Ln of seed -0.48**(0.222)
Ln of labor 0.436***(0.158)
Ln of oxen 0.364*(0.205)
Ln of land 0.168(0.265)
Ln of fertilizer square -0.672(0.520)
Ln of seed square 0.413(0.487)
Ln of labor square -0.185(0.540)
Ln of oxen square 1.603***(0.346)
Ln of land square -0.044(0.168)
Ln of fertilizer*seed 2.011**(0.980)
Ln of fertilizer*labor -0.232(0.514)
Ln of fertilizer*oxen -0.827*(0.490)
Ln of fertilizer*land 0.095(0.242)
Ln of seed*labor -0.739(0.794)
Ln of seed*oxen -2.524***(0.697)
Ln of seed*land -0.063(0.205)
Ln of labor*oxen 1.173*(0.645)
Ln of labor*land -0.190(0.125)
Ln of oxen*land -0.008(0.015)
Constant -1.32 (2.25)
Gamma 0.63
Log likelihood -70.43
Lambda 1.32
3. Technical efficiency score of barley producers
The result of frontier model revealed that, the mean technical efficiency of the sample
household farmers during the 2015/16 production season was 70.9% and it ranged from 14%
to 95%. This indicated that, there is a wide gap variation among the sample barley producer
farmers in the study area. It also told that, farmers could had more possibility to increase
their current production of barely output on average by 29.1% without changing the existing
inputs. In other word, farmers had an opportunities to decrease all the current input usage by
29.1% without decreasing the output of barley produced.
The socio economic, farm related and institutional variables expected to affect technical
inefficiency; education level, frequency of extension contact, the practice of crop rotation,
number of barley plots, distance of home to the plot, total expenditure, soil fertility of land
and distance to home from the nearest market were the significant variables that affected the
technical inefficiency score of barley growing farmers in the study area.
Table 5. Source of technical inefficiency
Technical inefficiencies variables Coefficient (S. error)
Farming experience -0.004(0.019)
Education Level -0.168*(0.098)
Frequency of extension contact -0.124*(0.074)
Number of barley plots -0.718**(0.33)
Crop rotation 1.535**(0.65)
Non-farm income -0.351(0.58)
Livestock ownership -0.017(0.12)
Ln credit -0.008(0.02)
Distance to market 0.191*(0.10)
Ln expenditure 1.984**(0.48)
Soil fertility -1.366**(0.55)
Distance to home 1.277**(0.57)
Sex -0.352(0.60)
Constant -9.540**(4.03)
Level of education: The education level of farmers had negative relation with technical inefficiency and significant at 10% significance level. For every increment in education level
by one years of schooling, the technical inefficiency of farmers would decreased by 0.168
scores. As a farmers becomes educated s/he has an awareness how to maximize their barley
output with the given limited inputs.
Frequency of extension contact: As expected the coefficient was negative and significantly affected the level of technical inefficiency at 10% level of significance, respectively. This
might be due to the reason that, the information that got from extension workers had a power
to increase the awareness and know-how of farmers towards technologies and efficient
As the extension workers frequently visit and follow up farmers more and more, farmers
may obtained important and influential information to decrease their technical inefficiency
level by 0.124 scores, ceteris paribus. This finding was in-line with (Jude et al., 2011;
Mustefa, 2014).
Number of barley plots: On contrary to the expected sign it had negative relationship and significant at 5% for technical inefficiency. Other variables holding fixed, additional barley
plot is associated with a decrement in technical inefficiency by a 0.718 score. It revealed that
those farmers having barley farm plots more than one in different locations were more
efficient. This might be due to the fact that, in the study area farmers cultivate barley by
share-cropping system in addition to their own land. So, this enables them had more farm
plots at different location and reduce inefficiencies associated with risks that come due to
frost. In the study area, some plots locations are vulnerable for frost and others are not and
it is a serious problem that aggravate their inefficiency of crop production. In addition, it
might be due to difference in the soil fertility of barley farm plots at different location that
is, on average fertile soils would help to earn higher output and improve efficiencies of
farmers. This finding was consistent with the findings of (Tan et al., 2010; Yami et al., 2013);
Wudineh and Endrias, 2016).
Crop rotation: Its coefficient was positive and significant at 5% level of significance for technical inefficiency. As compared to those farmers who practice crop rotation, the
technical inefficiency of not practicing crop rotation increased by 1.535 scores other factors
fixed. Therefore, practicing crop rotation especially cereals with legume crops can restore
and maintain soil fertility so as to decrease the technical inefficiency of barley producers by
increasing its barley production. This finding was in line with (Musa, 2013).
Distance to the nearest market: As expected it affected technical inefficiency level positively and significantly at 10% level of probability. As the distance of the nearest market
to the farmer’s residence increased by one kilometer, the technical inefficiency of farmers
also increased by 0.191 scores. This implies that as the farmers is far from market, their
inefficiency increases because it incurs more cost to transport inputs and outputs, transaction
costs and to get market information. The result was in line with (Hassen, 2011; Musa et al.,
Total expenditure of the household: The coefficient of total expenditure of the household had a positive sign and significant effect on technical inefficiency at 5% levels of probability.
Holding other variables constant, if expenditure of household increased by 1% farmers
technical inefficiency also increased by 0.02 scores. This might be due to the reason that,
during the survey period majority of their income is spend for consumption purpose to feed
their household and construction of houses. In turn, this causes cash deficiency to buy basic
and required inputs to decrease their technical and economic inefficiencies. The result was
in line with (Mustefa, 2014).
Soil fertility: It had a negative as well as a significant influence on technical inefficiency level at 5% levels of significance. It means that, as compared to those individuals having in
fertile lands, the technical inefficiencies of farmers having fertile land had decreased by 1.36
scores, holding other factors constant. Therefore, such policies to increase and maintain soil
fertility of land must had a negative effect on inefficiency of barley production. The result
was similar with the findings of (Alemayehu, 2010; Musa, 2013); Hailemaraim, 2015).
Distance to home: The average distance between the plots and farmers residence positively affected the technical inefficiency of barley producers at 5% levels of significance. Ceteris
paribus, additional average distance between residence of farmer and his/her barley plot is
associated with an increment of 1.277 technical inefficiency scores of the farmer. The
distance between farm and farmers residence strongly affect their frequency of supervision,
plant protection and application organic fertilizer especially animal dung. Because, all these
factors strongly increase his/her technical inefficiency level.The result was similar with the
findings of (Alemayehu, 2010).
CONCLUSIONS
This study was conducted with the objectives of estimating the level of technical efficiency
and identifying the sources of inefficiency variation among barley producers in Meket
District, Amhara National Regional State of Ethiopia. The trans-log functional form of the
production function revealed that, the mean technical efficiency of 70.9% and it ranging
from the minimum of 14% to the maximum of 95%. This figure told that, there is a possibility
to increase the technical efficiency of barely producers on average by 29.1% with the existing
technique of frontier model also clearly revealed that education level, frequency of extension
contact and number of barley plots affected technical inefficiency negatively. With the same
fashion, the practice of crop rotation by farmers, distance of the farmer’s residence from the
nearest market, total expenditure of household, soil fertility and distance of the plot from
home had positive effects on technical inefficiency variation among the barley producer
farmers.
Recommendations
The main goal of this study was showing the degree of variation and identification of
important variables that bring disparity of technical inefficiency among farmers. As
expected, the result of the study clearly showed the presence of technical inefficiency
variation among the farmers and identify which variables strongly affected their inefficiency
level. It also showed that there is a huge opportunity to improve their efficiency level and
increase barley output if appropriate measures are taken.
Firstly, the result of the study indicated that, frequency of extension contact of farmers with
extension agents was the significant variable and had a negative effect on all inefficiencies
level. This means that any policy aimed to improve the capacity of development agents will
decrease the technical inefficiency of farmers. Since, development agents had a pivotal role
to disseminate new production information, technologies and inputs from the research field
to the actual farmers on ground. Therefore, special emphasis and motivation should be given
for those personnel so as to improve the efficiency level. This is possible by upgrading the
development agents or extension workers by providing practical attachment training with the
current agricultural production and as much as possible decrease ratio of development agents
to the number of farmers so as to increase the number of extension contact and to make the
number of farmers manageable to the extension agents.
Secondly, the result confirmed that education level of the household calls a special emphasis
to upgrade the managerial ability of farmers or farmer’s education. This can be achieved by
providing youth training center, practical training and creation of awareness and knowhow
about the application of inputs and different farming system.
Thirdly, the result suggested that policy makers would significantly decrease the technical
reduce home to market distance as well as home to farm plot. In addition, it is better to
launching of new market around their residence exercising to purchase farm inputs and to
sell their outputs with a minimum transaction cost.
REFERENCES
Abu Tefera and Teddy, T. 2014. GAIN (Global Agricultural Information Network) Report
on assessments of commodity and trade issues made by USDA staff. Addis Ababa,
Ethiopia. Report no. 1301.
Aigner, D.C., Lovell, K.C.A. and Schmidt, P. 1977. Formulation and estimation of stochastic
frontier production functions models. Journal of Economics, 6: 21-37.
Alemayehu, E. 2010. Analysis of factors affecting the technical efficiency of coffee
producers in Jimma zone: a stochastic frontier analysis. MSc Thesis, Adiss Ababa,
Ethiopia.
Aung, N.M. 2012. Production and economic efficiency of earmers and Millers in Myanmar
Rice Industry. Institute of Developing Economies, Japan External Trade
Organization. V.R.F. Series No. 471.
Berhane, G., Paulos, Z., Tafere, K. and Tamru, S. 2011. Food grain consumption and calorie
intake patterns in Ethiopia. IFPRI Ethiopia Strategy Support Program II
(ESSP II) Working Paper, 23.
CSA (Central Statistics Agency). 2014. Annual Statistics Bulletin: Addis Ababa, Ethiopia.
CSA (Central Statistical Agency). 2016. Agricultural sample survey report on area,
production and farm management practice of belg season crops for private peasant
holdings, 5.
FAO (Food and Agricultural Organization). 2014. Annual report. Addis Ababa, Ethiopia.
Hailemariam Leggesse. 2015. Technical efficiency in Teff production: The case of Bereh
District, Oromia National Regional State. MSc Thesis, Haramaya University,
Haramaya, Ethiopia.
Hassen Beshir, 2011. Performance of mixed crop-livestock production system: The data
Jude, C., Benjamen C. and Patrick C. 2011. Measurement and determinants of production
efficiency among smallholder sweet potato farmers in Imo state, Nigeria. European
Journal of Scientific Research, 59 (3): 307-317.
Musa Hasen, 2013. Economic efficiency of smallholder farmers maize production: The case
of Arsi Negelle District of West Arsi Zone. MSc Thesis, Haramaya University,
Haramaya, Ethiopia.
Musa H., Lemma, Z. and Endrias, G. 2015. Measuring technical, economic and allocative
efficiency of maize production in subsistence farming: Evidence from the Central
Rift Valley of Ethiopia. Applied Studies in Agribusiness and Commerce, 9 (3): 63–
74.
Mustefa Bati. 2014. Economic efficiency in barely production: The case of Chole district,
East Arsi Zone, Oromia National Regional State, Ethiopia. MSc Thesis, Haramaya
University, Haramaya, Ethiopia.
Shahidur Rashid, Gashaw T. Abate, Solomon Lemma, James Warner, Leulsegged Kasa and
Nicholas Minot. 2015. The barley value chain in Ethiopia. REAP (Research for
Ethiopias’ Agriculture Policy).
Tan, S., Heerink, N., Kuyvenhoven, A. and Qu, F., 2010. Impact of land fragmentation on
rice producers’ technical efficiency in South-East China. NJAS-Wageningen Journal
of Life Sciences, 57 (2): 117-123.
Wudineh Getahun and Endrias Geta. 2016. Technical efficiency of smallholder wheat
farmers: The case of Welmera district, Central Oromia, Ethiopia Journal of
Development and Agricultural Economics, 8 (2): 39-51.
Yamane, Taro. 1967. Statistics: An Introductory Analysis, 2nd Edition, New York.
Yami, M., Solomon, T., Begna, B., Fufa, F., Alemu, T. and Alemu, D. 2013. Sources of
technical inefficiency of smallholder wheat farmers in selected water-logged areas of
Ethiopia: A translog production function approach. Africa Jornal of Agricultural