On the Energy-Proportionality
of Data Center Networks
Pietro Ruiu, Claudio Fiandrino,
Student Member, IEEE,
Paolo Giaccone,
Senior Member, IEEE,
Andrea Bianco,
Senior Member, IEEE,
Dzmitry Kliazovich,
Senior Member, IEEE,
and Pascal Bouvry,
Member, IEEE
Abstract—Data centers provision industry and end users with the necessary computing and communication resources to access the vast majority of services online and on a pay-as-you-go basis. In this paper, we study the problem of energy proportionality in data center networks (DCNs). Devices are energy proportional when any increase of the load corresponds to a proportional increase of energy consumption. In data centers, energy consumption is concern as it considerably impacts on the operational expenses (OPEX) of the operators. In our analysis, we investigate the impact of three different allocation policies on the energy proportionality of computing and networking equipment for different DCNs, including 2-Tier, 3-Tier and Jupiter topologies. For evaluation, the size of the DCNs varies to accommodate up to several thousands of computing servers. Validation of the analysis is conducted through simulations. We propose new metrics with the objective to characterize in a holistic manner the energy proportionality in data centers. The experiments unveil that, when consolidation policies are in place and regardless of the type of architecture, the size of the DCN plays a key role, i.e., larger DCNs containing thousands of servers are more energy proportional than small DCNs.
Index Terms—Energy-efficiency, energy-proportionality, data center networking.
F
1
I
NTRODUCTIONC
LOUD computing has become fundamental for IT op-erations worldwide. Industry and end users can now access the vast majority of services online without having to invest into acquiring a proper IT infrastructure. Data centers provision industry and end users with the necessary IT infrastructure, including computing and networking resources, which are consumed on a pay-as-you-go basis.Data Center Networks (DCNs) are the topologies inter-connecting computing and communication nodes within the data centers and provide connectivity among the servers and towards the end users. DCNs have an important role on the performance perceived at application level, such as requested throughput and response latency.
To provision the services, data centers consume a tremen-dous amount of energy that is contributing to increase concerns for the environment [1]. Computing devices are more energy-hungry than network devices, but since servers are becoming more energy efficient, the network contribution cannot be ignored. According to Abts et al. [2], if a data center is used at 15% load and servers are fully energy proportional, the network contribution is close to the 50% of the overall power consumption.
Another important trend in data center industry regards the size of data centers. Smaller data centers are consolidating
• P. Ruiu, P. Giaccone, and A. Bianco are with the Politecnico of Torino, Italy. P. Ruiu is also with Istituto Superiore Mario Boella (ISMB), Torino, Italy. E-mail: ruiu@ismb.it, {bianco,giaccone}@polito.it.
• C. Fiandrino is now with IMDEA Networks Institute, Madrid, Spain. E-mail: claudio.fiandrino@imdea.org. Claudio developed the current work as PhD student at the University of Luxembourg.
• D. Kliazovich is now with ExaMotive, Luxembourg. E-mail: kliazovich@ieee.org.
• P. Bouvry is with the University of Luxembourg, Luxembourg. E-mail: pascal.bouvry@uni.lu.
in bigger ones, composed by several thousands of computing servers, the so calledmega data centers. Mega data centers, leveraging on the economy of scale, allow operators to offer more competitive services to the end users reducing some of the operational costs of the facility. By 2018 the number of mega data centers is expected to be 70% of the total amount of worldwide facilities [3]. Typically, the operators do not reveal the number of servers contained in each facility. However, according to data center analysts, large data centers can host up to 50,000-100,000 servers [4]. The number of servers in any facility can be estimated exploiting the data center design requirements [5]. For a cloud data centers,12kW is the typical average power per cabinet design target. The QTS data center located in Chicago is large133,000square feet and provides24MW of power capacity [6]. Considering that each cabinet can host up to40servers and consumes12kW, then the data center is estimated to contain up to80,000
servers. The Ashburn VA2 data center, located in Northern Virginia [7], measures 140,000 square feet and consumes
14 MW of high density critical IT power. Using the same reasoning, this facility can host about50,000servers.
been spent to investigate the implication of this growing sizes on the consumption of the data centers.
1.1 Our Contribution
In our work1we provide an asymptotic analysis of how the
power consumption grows with the size of data centers. Our results can help to understand the impact of the adoption of these trends on the OPerational EXpenditure (OPEX) of the operators. We compare the energy performance of different DCNs, varying the layout of the adopted topology and the size. We focus on the energy proportionality, a concept that was first introduced by Barroso et al. as a fundamental prop-erty to assess energy efficiency [13]. A device, or a system, is definedenergy proportionalif consumes energy proportionally to the amount of work performed. An energy proportional device is efficient at various utilization levels: in idle mode, it does not consume power at all and at each increase of the workload, the power consumption increases gradually.2
Energy proportionality can be measured locally, considering the consumption of a single device (server or switch), or at global level observing the cumulative consumption of all the components of the data center. We will focus on the latter contribution, since for data center operators, assessing global energy proportionality is of paramount importance to predict the variation of energy consumption with increasing workloads, and thus to evaluate the revenues.
To study the energy proportionality problem, we define three different allocation policies that characterize the assign-ment of Virtual Machines (VMs) to the computing servers. Specifically, we consider bothconsolidating policiesthat aim at concentrating the load in the minimum number of servers andload balancing policiesthat distribute the load across all the servers. The impact of the different allocation policies is studied for several DCNs, including 2-Tier, 3-Tier layouts and Jupiter, which is the reference DCN for Google [14]. Throughout simulations, we evaluate the energy efficiency in a holistic manner considering several performance metrics: the energy proportionality of both computing and communi-cation equipment (Energy Proportionality Error), the energy cost spent to allocate incoming VMs at various utilization levels of the data center (Power Per Virtual Machine) and the efficiency of the network expressed in terms of energy consumption per bit of information delivered (Network Power Efficiency).
The main contributions of this work are as follows:
• An asymptotic analysis of data center power consump-tion for different size and typology of DCN with the objective to investigate the contribution of different allocation policies to the energy proportionality.
• New metrics to assess energy proportionality of com-puting and communication equipment and network efficiency.
• A simulator of data center where communications are modeled at flow level. The simulator is designed to be configured with different DCNs and allocation policies, and permits to assess power consumption at fine-grained level, by calculating the contribution to the
1.A preliminary version of our work was presented in [12].
2. Similarly to [1], in the rest of the paper we use power and energy interchangeably as data centers are typically required to be always on.
consumption on network and computing resources due to each single VM allocation.
1.2 Main Findings
Our main findings are the following. The size of the data center impacts on the global energy consumption more than the considered layout. Thus considering two DCNs with similar size and performance (latency, bisection bandwidth, etc.), the way in which servers and switches are inter-connected does not impact consumption. Moreover, when consolidation policies are employed, the larger is the size of a data center, the more the energy proportionality becomes independent of the layout of the DCN. At any operational load, larger data centers containing thousands of servers are more efficient than data centers with few hundreds of servers. This consideration is true for any DCN, but on the condition that the load on the servers is consolidated and not distributed. As the demands for cloud services are continuing increasing and force the building of mega data centers, the adoption of consolidation policies will boost efficient use of energy.
The paper is organized as follows. Section 2 illustrates the DCNs used for the analysis and presents the methodology adopted to profile energy proportionality in data centers, including the new proposed performance metrics. Section 3 describes the computing and communication model the simulator implements, including the VM arrival process and the resource allocation policies. Section 4 illustrates per-formance evaluation and Section 5 discusses and elaborates on the results obtained. Section 6 reviews related works and Section 7 draws conclusions outlining future research directions.
2
P
ROFILINGE
NERGYP
ROPORTIONALITY OFD
ATAC
ENTERSWe investigate the data center energy efficiency in function to the offered load and the size of the data center. We consider the contributions of both servers and switches. A DCN not only determines the topology of the network and the number of its components, but also defines the number of servers that can be supported. Therefore, as the size of a data center grows the power spent to operate the IT equipment increases. However, the increase of power consumption due to a large number of available resources is different for each DCN. As mega data centers support several thousands of servers and are designed to be scalable, the choice of a proper DCN that satisfies energy proportionality criteria can lead to significant energy savings and reduction of facility management costs.
2.1 Analysis of Data Center Networks
are small, low power Ethernet switches with a fixed number of ports. They are typically used to connect servers to the backbone of the data center. The name ToR derives from the fact that these switches are typically placed at the top of the rack and connect a group of servers. EoR switches, are large, modular switches composed by a variety of line cards, with different layer-2 interfaces and different combinations of switching fabrics and network processors. These switches have many more ports than ToRs. Since their dimension vary depending on the number of line cards used, typically they fill an entire rack. These kinds of switches can be identified with different terminology when placed inside the data center. For example in a 3-tier data center the switches connecting servers to other switches can be calledToR,edge,leaf oraccess
switches. In the intermediate layer switches can be called
spine,aggregationordistribution. In the majority of cases at the upper layer switches are indicate ascore. In the rest of the paper we will refer to these switches respectively as ToR, aggregation and core switches.
The interconnection links between computing servers and ToR are typically 1 Gbps while aggregation and core switches have 40 Gbps Ethernet ports, which can be split in four 10 Gbps ports with the use of breakout cables. The demand for these high bandwidth switches is growing fueled by cloud application and by the decrease in the price of 10-Gbps network interfaces of servers [16]. Since DCNs networks are typically not used to their full capacity, operators choose to unbalance the input/output ratio at ToR level, to lower the design costs of the data center. This technique is called oversubscription and is defined as the ratio of the worst-case achievable aggregate bandwidth among the end hosts to the total bisection bandwidth of a particular communication topology [11]. For an-ports switch and a server oversubscription of factork,n/(k+ 1)ports of a ToR are connected to the core switches and the remaining nk/(k+ 1)ports to the servers (as realistic example,k= 3
according to [14]). This implies thatn/k core switches are present and connected tonToR switches.
For the purpose of this paper, the analysis focuses on intra data center traffic of Clos-based DCNs [17]. Clos networks permit to build large-scale communication networks using few switches, with the same number of ports on all stages. Conversely, conventional DCNs [18] are built with fewer, more expensive and energy-hungry switches with a higher number of ports at each stage of the interconnection layout. Intra data center traffic, also known as east-west traffic, is the primary component in data centers as opposite to inter data center (north-south) traffic that corresponds to information exchange towards the wide Internet. Moreover, the vast majority of real-life workloads produce traffic that remains inside the data center. Since we consider that the two kinds of traffic generate the same effects on power consumption of the data center, for the sake of simplicity it has been decided to focus on intra data center traffic only. See Section 3.4 for further details on our communication model.
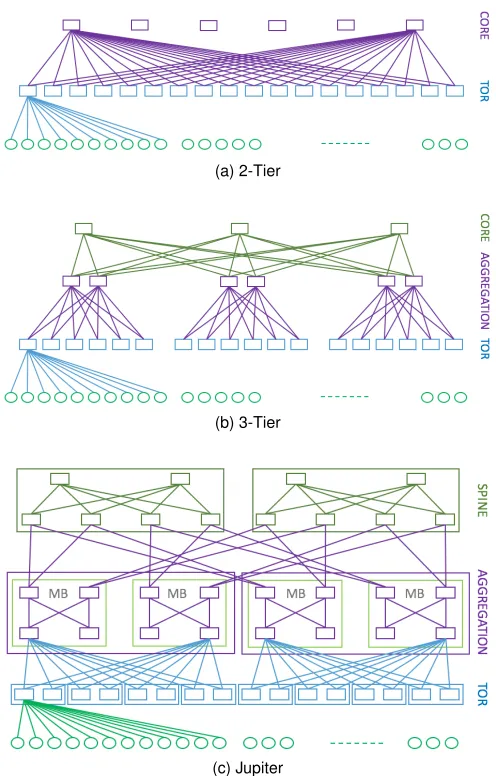
Fig. 1 illustrates the DCNs considered for the analysis, including 2-Tier and 3-Tier layouts [11] and Jupiter [14], which is the DCN adopted by Google in its data centers. The following paragraphs discuss and present the main properties of each architecture.
(a) 2-Tier
(b) 3-Tier
(c) Jupiter
Fig. 1. Data center architectures used for the analysis
2-Tier:Fig. 1a illustrates a 2-tier DCN, which is based on a classical 3-stage Clos switching network and is commonly implemented in small data centers. Since the switches at the two levels are fully connected, its scalability is affected by the number of ports in the switches, which determine the number of core switches. As a consequence, large networks can be designed only with switches with high number of ports, which is not always possible. Letkbe the oversubscription factor. Then, the 2-Tier design can support a maximum of n2k/(k+ 1)
computing servers.
3-Tier:Currently, the vast majority of data centers imple-ments a 3-Tier architecture, which is based on a classical 5-stage Clos network (see Fig. 1b). This DCN consists of three levels of switches, ToR, aggregation and core. Havingn-port switches for all levels andkas oversubscription factor, a 3-tier architecture supports a maximum number ofn3k/(2(k+ 1)) servers interconnected withn2/2ToR switches,n2/(k+ 1) aggregation switches andn2/(2(k+ 1))core switches. This is one of the most adopted reference layout, since it supports a large number of servers.
of Jupiter, which exploits heterogeneous building blocks and is constructed in a recursive manner. The smallest unit is composed by a 16-port switch with 40 Gbps link rate, used for building the blocks of each layer and implemented with commodity switch chipsets. Each ToR are composed by 4 unit switches and is connected to 64 other devices. Aggregation blocks are splitted in sub-groups (calledMiddle Blocks (MB)), also composed by ToR switches placed on two levels. The upper layer is composed by 256 Spine blocks connected to 64 Aggregation blocks. As a result, Jupiter achieves high modularity, which permits to interconnect around400,000
servers using10Gbps interconnection links for a bisection bandwidth of 1.3 Pbps, coherently with a value of 3 of oversubscription ratio.
2.2 Comparison Methodology
Comparing different types of the DCNs is challenging as several non-independent criteria can be employed as a base reference, like equal number of nodes (servers, or switches plus servers), equal bisection bandwidth, equal cost of the devices or equal power consumption. Being the criteria non-independent, fixing one has consequences on the others. For example, comparing DCNs with equal bisection bandwidth implies having by design a different number of nodes and consequently a different energy consumption. In this paper, we compare DCNs by fixing the number of computing servers.
The objective of the comparison is to assess the power consumption in function of the load. The consumption of the data center primarily depends on the power profile of the nodes, servers and switches and on the actual load on each node. The latter is driven by the adopted allocation policy.
Consider for example a simple scenario of a 2-Tier layout with 2 core switches, 4 ToRs, 2 servers for each ToR and a fixed power consumption for all devices, independently from their load. Suppose now that one VM is already allocated and a second one needs to be deployed. The two VMs need to communicate one with each other as a requirement. To accommodate the incoming VM into a server, there exist different allocation policies:
1) intra-serverallocation, according to which the new VM is deployed in the same server of the first VM. This policy consolidates the computing and communication loads to minimize the number of devices in use;
2) intra-rackallocation, according to which the new VM is deployed in the same rack of the already allocated VM, but in a different server. This policy minimizes the impact on the network as the interconnection between the two servers is guaranteed by one ToR switch. Moreover, the policy balance the computing load among the racks.
3) inter-rackallocation, according to which the new VM is allocated in a different rack of the already allocated VM. This policy aims at balancing both computing and communication loads.
The three aforementioned policies impact on the utiliza-tion load of computing and communicautiliza-tion devices and in turns on the overall power consumption of the data center. Performing an integrated analysis ofcomputingand
communicationresources is therefore essential as lowering
the loads of one of the two components influence the loads of the other with a different global consumption of the data center. For this reason, we adopt an integrated methodology to assess the power consumption of the data center considering at the same time the consumption of the two kinds of resources. This is an important point of novelty with respect to previous works, which have been focusing on just one component at a time. In our work, the comparison is performed analyzing either the global consumption of the data center as well as the distinct contribution of the two components. The analysis of the separated contribution permits to understand how the allocation impacts on the consumption of the two components.
2.3 Performance Metrics
A number of metrics is currently used by industry and academia to assess efficiency of data centers. The most well known metrics are the Power Usage Effectiveness (PUE) [19] and the Performance per Watt (PPW) [20]. The PUE is computed as the ratio between the total energy consumed by the facility and the energy consumed by the IT equipment. Unfortunately, the insights given by the PUE strongly depends on a number of external factors and consequently this metric is not precise enough for the purpose of this paper. For example, the values of the PUE are affected by the season and weather conditions as these elements impacts significantly on the usage of the cooling system. Indeed, when the cooling system is used extensively, the fraction of overall power attributed to the IT equipment with respect to the overall power consumption reduces. As a result, the PUE assumes higher values and the data center appears to be less efficient. In addition to this issue, the energy consumed by the IT equipment is usually determined not accounting for a number of components that indirectly contribute to computing or communications purposes like fans and power suppliers. Performance metrics such as PPW, although applicable for the scope of this paper, take into account the performance of the hardware expressed in Millions of Instructions Per Second (MIPS) or Floating Point Operations Per Second (FLOPS). As a consequence, they depend on the efficiency of the adopted hardware, whereas in our paper, to assess the asymptotic behavior of different DCNs for different allocation policies, we assume that the smallest unit of computing and communication load corresponds to the one generated by a single VM.
In this work, we evaluate the total power consumption
obtained by summing the contribution of the servers and of the network devices, and thenetwork power consumption, obtained by considering only the contribution of the network devices. To fairly compare the performance of different DCNs, we rely on the averagePower-per-VM(PPVM), defined as the ratio between the total power consumption and the effective load in term of VMs.
PPVM=Total power consumption of the DCN
Number of allocated VMs . (1)
terms, in current cloud business models, the revenues for the operators are related to the number of VMs running successfully.
In the literature, the energy proportional behavior of the devices has received considerable attention and a number of metrics such as the Energy Proportionality Coefficient (EPC) [21] have been proposed. More details on this are provided in Section 6. By construction, the EPC metric is not applicable to discontinuous power consumption profiles like step functions, which are typical in communication devices. To overcome this issue, we define a new metric, denoted as Energy Proportionality Error (EPE). The EPE index evaluates the deviation of a power consumption profile from the ideal curve as the sum of the absolute values of the difference of the areas in each step of the load. Specifically, the EPE index is defined as follows:
EPE=
Z 1
0
|f(x)−x|dx, (2)
wheref(x)is the normalized power consumption as func-tion of the normalized offered load x of the data center. The subtracted functionxcorresponds to an ideal energy proportional curve like the FEP curve shown in Fig. 2. By construction, EPE∈ [0,0.5]. EPE is null wheneverf(x)is ideal energy proportional (i.e. equal tox), whereas EPE is
0.5whenf(x) = 1for anyx, i.e. completely constant. For an in-depth analysis of the effect of communications on the overall power consumption, it is important to analyze the amount of power spent to transmit data. TheNetwork Power Efficiency(NPE) index is defined as the ratio between the network power contribution and the effective network load generated by the VMs. The NPE index is expressed in W/Gbps and is formally defined as follows:
NPE= Total network power
Effective network traffic. (3) The effective network traffic is determined by monitoring the traffic on ToR switches and excluding signaling traffic necessary to manage and operate the network like routing. Thus, EPE does nor consider the traffic exchanged between VMs located in the same server. Note that monitoring the intra-server traffic among VMs is possible through cloud managers like Neutron, which has the ability of accounting for traffic generated in virtualized environments at fine-grained level, but such information does not affect the energy proportionality of the DCN.
3
C
OMPUTING ANDC
OMMUNICATIONM
ODELWe developed an ah-hoc event-driven simulator in C++ that models the whole data center, in terms of servers, interconnection network and VMs arrival and VMs allocation. The communication between servers is simulated at flow level, thus by allocating the requested bandwidth on the path connecting the source and destination VMs present in the servers. We argue that the simulation of the traffic at flow level is the only viable approach to investigate large data center networks, without loosing accuracy in assessing power performance with respect to packet-level simulators, whose scalability is instead very limited. Additional details on the implemented simulation model is reported in [12].
More in details, the normalized load on server s is characterized by three values:ρCP U
s ∈ [0,1]for the CPU,
ρRAM
s ∈[0,1]for the internal volatile memory (e.g., RAM)
andρHD
s ∈[0,1]for the non-volatile memory (e.g., hard-disk
storage). All these values are normalized to the maximum capability available at the server. We assume heterogeneous resources across all the servers, thus we can directly sum all the normalized load to get theoverall average data center load, defined as follows:
ρtot= max
1
S
( S X
s=1 ρCP U
s , S
X
s=1 ρRAM
s , S
X
s=1 ρHD
s
)
, (4)
i.e. the maximum average load across the three kinds of resources. Whenever a VM is generated, it is associated with a random triple describing the CPU, RAM and storage requirement, and with a destination VM, chosen at random among the ones already allocated, with which the VM exchanges traffic.
3.1 Resource Allocation Policies
To allocate a sequence of incoming VMs, we consider the following three on-line VM allocation schemes:
• Simple Server Consolidation (SSC)scans the servers according to a given order and chooses the first one that can host the new VM. Thus, SSC is representative of a consolidation policy oblivious of the network state.
• Random Server Selection (RSS)chooses at random one server to allocate the new VM. Thus RSS is representa-tive of a distribution policy that tries to load evenly the servers.
• Min-Network Power (MNP)chooses the server with minimumnetworkpower cost for the VM to communi-cate with its destination VMs that have been already allocated. Due to the power cost to communicate among servers, MNP is also a consolidation policy, but now network aware.
The pseudocode in Algorithm 1 shows the details the operational workflow of the three policies. For the sake of clarity and simplicity, the code is different from the one implemented in our simulations, even if they are functionally equivalent. Indeed, our implementation has been designed to minimize the computational complexity and thus extending the scalability of the approach for large data centers.
Referring to the pseudocode, all the policies receive as input the new VM v to allocate (ln. 1), with the set of destination VMs to communicate with and the corresponding bandwidth requests. Based on those, the corresponding set of servers where the destination VMs have been previously allocated and the required bandwidth requests are evaluated (ln. 2-3).
Algorithm 1VM allocation policies
1:procedureFIND-SERVER-FOR-VM(v)
2: Ω←list of all the destination servers of VMv
3: B←list of all bandwidth requests of VMvfor all the destination servers
inΩ
4: π ←SORT-SERVER-RSS( ) orπ ←SORT-SERVER-SSC( ) orπ ←SORT -SERVER-MNP(Ω,B) .Specific order for each policy
5: fori= 1. . . Sdo .Loop on all the possible candidate servers
6: s=πi .Pick next server
7: ifservershas enough local resources for VMthen
8: ifservershas enough bandwidth towards all servers inΩthen
9: allocate VM on servers
10: reserve the bandwidth fromsto all servers inΩ
11: returns .End of search: VMvis allocated in servers
12: end if
13: end if
14: end for
15: returnBLOCKING-EVENT .VM cannot be allocated due to lack of
resources
16:end procedure
17:functionSORT-SERVER-RSS( )
18: returnrandom permutation ofSservers
19:end function
20:functionSORT-SERVER-SSC( )
21: returnpermutation ofSservers in decreasing server powerδs
22:end function
23:functionSORT-SERVER-MNP(Ω, B)
24: fors= 1→Sdo .Search across all the servers
25: δs←0 .Init incremental power to reach candidate servers
26: foranyd∈Ωdo .Consider all possible destinations fors
27: P ←path with minimum power cost fromstod
28: δs←δs+additional network power due toBdtraffic onPpath
29: end for
30: end for
31: returnpermutation ofSservers with increasing network powerδs
32:end function
to all the destination servers (ln. 26-29). Finally, the list of candidate servers is returned sorted in increasing network power.
For both policies, the main loop (ln. 5-14) considers each candidate server sequentially, and checks whether the server has enough local resources (ln. 7) and whether the network provides enough bandwidth (ln. 8) to satisfy the bandwidth requests from the VM to its destination VMs/servers. If both condition are met, the candidate server is selected, otherwise the next candidate is considered. In the case the search is not successful, the VM allocation is blocked (ln. 15) since either no enough resources are available in the servers or no enough bandwidth is available in the network to satisfy its communication demand.
When comparing the different approaches, RSS distribute the VMs across all the servers in the data center, thus distributing the traffic in the whole network. Instead, MNP and SSC consolidates the VMs in the available servers, minimizing the network communications and thus the network power consumption.
3.2 VM Generation Process
Typically, the data center load is defined as the cumulative amount of resources (CPU, storage, memory, communication bandwidth) requested by the VMs that are effectively allo-cated in the data center. We define the load based on most constrained resources for both communication and comput-ing. For the communications, the switch load depends on the allocated bandwidth and, without loss of generality, for the computing the servers are loaded considering just the
CPU, to simplify the definition according to (4). In this way the single request of the VM consumes a fraction of the total capacity of the available resources.
For a simple, fair and repeatable comparison, we have defined a benchmark generation process of VMs with the following assumptions: VMs are generated sequentially, cannot migrate and never expires. The effect of migration in our findings will be later discussed in Sec. 5.1.
Each VM may be associated to a set of other preexisting VMs, denoted as destination VMs, that have been already allocated in the data center and with which the new VM must communicate. A bandwidth request is associated for each destination VM. Note that a newly allocated VM may become destination for other future VMs, and this enables the communication with multiple VMs at the same time; this makes our VM model quite general. Indeed, it captures different possible cases, being compatible with the scenario of isolated VMs (i.e. without any communication requirement) and also with the scenario of small or large clusters of VMs that communicates each other. This model can be applicable to different real scenarios with high intra-data center traffic such as indexing applications, distributed storage systems, MapReduce workloads. See Section 3.4 for further details.
Let the offered load (Lo) be the load given by the
ar-rived VMs, normalized with respect to the data center resources. Note that, according to [22], the average offered load for operational data centers running several types of workloads, including online services, is around [0.2,0.5]. Since the available resources in terms of computing and communication are finite, a request for a new VM (typically at high offered load) may not be accommodated: this is defined as “blocking event”. Thus, the effective load (Le)
is defined as the normalized load of the VMs that have been successfully allocated. We define theblocking load as the minimum load when the first blocking event occurs. Intuitively, the blocking load is the effective load capacity of the data center, i.e. its saturation point. To fairly compare different scenarios, the EPE index is always computed for load values lower than the blocking load. Allocations after this point are often unsuccessful and depend on the residual capacity of resources and size of the VM to be allocated. Thus, we avoided to show results above the blocking load.
The adopted simulation methodology with arrived VMs brings two major advantages. First, it is possible to test the allocation policies for different values of loads with just one simulation run. Multiple runs are only repeated to obtain con-fidence intervals for the desired results. Second, it is possible to keep feeding the data center until it completely saturates either in terms of computing or networking resources, which permits to assess the performance under a worst-case load scenario.
3.3 Power Consumption Profiles
In the scientific literature, a number of energy models for data centers is available [23]. In this work, we model both computing and communication equipment.
Fig. 2 illustrates the profiles modeling the power con-sumption of IT equipment. The power concon-sumption profile of a real device is typically described by a generic function where at the loadsl= 0andl=lmaxcorrespondPidleand
0 lmax
0
Ppeak
Pidle
Loadl
Po
wer
P
CONST FEP REAL
Fig. 2. Power consumption profiles for the IT equipment
The power profile of an ideal device does not consume any power under zero load and it increases linearly with the load, reaching Ppeak under the maximum load lmax.
We denote this profile as Full Energy-Proportional (FEP). Although being ideal and therefore not available in current devices, the FEP profile can be considered as a benchmark for comparing other profiles especially at low loads.
On the other side, the constant power consumption profile (CONST) models a device completely insensitive to the load, for which the power spent remains always constant toPpeak. This profile provides very bad performance,
especially for low levels of load, and can be considered as a worst case profile.
To estimate the actual value to be used asPpeakin CONST
profile, we performed an analysis of data from real devices. For the servers, we analyzed the performance metrics from different vendors and equipped with different CPU models3,
and we computed 750W as the mean of peak values over a sample with more than 500 servers. For the switches, we computed the average values based on the datasheets of major vendors4, with optical fiber interfaces and compatible with OpenFlow protocol. For this analysis, we obtained 300W as peak value calculated from a sample of 30 switches.
3.4 Communication Model
A typical data center traffic can be categorized in two types: (a) traffic flowing between external systems and the data center, and (b) traffic exchanged internally to the data center. Even if a generic applications can generate both types of traffic, in the most common data centers usually one of the two traffic types is dominant.
For the scope of this paper, we consider applications with dominant intra data center traffic. The assumption is consistent as many real data center applications generate throughput-oriented workloads, which require bandwidth-intensive communications between the servers. Examples are data mining and MapReduce applications. In particular our VM model is compatible with offline batch processing, in which VMs are not directly involved in serving end-user requests. As a result, the vast majority of the traffic produced remains inside the data center. According to [9] the 99.8% of traffic generated by this kind of applications remains confined within the data center. Interestingly, nearly75% of the traffic is destined to servers in the same rack.
3. https://www.spec.org/power_ssj2008/results/power_ssj2008. html
4. https://www.opennetworking.org/sdn-openflow-products? start=50l
Algorithm 2Random generation ofV VMs with attachment probabilityp
1:procedureGENERATE-VMS(V,p)
2: forv= 1. . . Vdo .For each new VM
3: fork=v−1. . .1do .Try to connect to previous VMs
4: if rand()< pthen .Bernoulli trials with probabilityp
5: Connect VMvwithkwith a random bandwidth requirement
6: break .Consider now another VM
7: end if
8: end for . vis not connected to any previous VM
9: FIND-SERVER-FOR-VM(v)
10: end for
11:end procedure
Commonly intra data center communication patterns can be categorized as (i)one-to-oneone VM communicates directly to another VM; (ii)one-to-severalone VM commu-nicates with several other VMs; (iii)all-to-allall the VMs communicate together. We consider a VM generation process modeling a mix of the (i) and (ii) patterns. The traffic between any pair of VMs is assumed to be bidirectional and the required bandwidth is chosen at random. If we define the degree of a VM as the total number of VMs with whom it is communicating, our VM generation process permits to obtain VMs with random degree.
We adopt the incremental approach shown in Algorithm 2 to generateV VMs and the corresponding traffic exhanged among VMs. We use an “attachment” probabilitypthat each new VM is connected to one of the most recently generated VMs. In more details, we use geometric trials to find a single destination VM to which the new VM is connected. Note that, since any generated VM can be chosen later as destination for a newly generated VM, the degree of any VM can be larger than one, even if the average degree is always one. This allows us to distribute fairly the communications among all the VMs. Actually, the value ofpgives the level of variance on the VMs degree. Whenpis close to1, a chain of VMs is generated, each with a maximum degree close to one. Whereas, whenpis small, the VMs are interconnected randomly, and the maximum degree is larger than one. In the case a new generated VM is not connected to a previous VMs (i.e. the loop in lines 3-8 is not interrupted by the break), the new VM is isolated with respect to the previous VMs and it starts a new group of VMs.
The advantages of our model are its semplicity, since it depends on a single parameterp, and its flexibility, since it allows to model also groups of VMs. Finally, a server is selected for each newly generated VM based on the code of Algorithm 1.
4
P
ERFORMANCEE
VALUATION 4.1 Simulation SetupTABLE 1
Definition of the scenarios based on a 3-Tier architecture
SCENARIO SERVERS SWITCHES
SIZE TOR AGGREGATION CORE
micro 96 4 ports 8 4 2
small 384 8 ports 16 8 4
medium 1536 16 ports 32 16 64
large 6144 32 ports 64 32 16
xlarge 13824 48 ports 96 48 24
4.2 Results
We assess the property of energy proportionality of a data center in function of the load, the size and the layout of the DCN. We assume a CONST power function for all the nodes (servers and switches), since it provides a worst-case scenario to evaluate the energy proportionality of the overall data center. Indeed, in the case of FEP and REAL power profiles, the level of energy proportionality cannot be worse than the one provided by CONST.
4.2.1 Performance for a 3-Tier architecture
We start by considering specifically a 3-Tier architecture. Later, in Sec. 4.2.2, we will show that all the qualitative results obtained in this preliminary investigation hold also for 2-Tier and Jupiter DCNs. We consider specifically five different data center sizes, ranging from96servers to nearly
14 000servers, built according to the specifications given in Tab. 1.
We investigate the three allocation policies RSS, SSC and MNP described in Sec. 3.1. Fig. 3a shows the impact of the policy on the power consumption in a small data center. The consolidation policies (MNP and SSC) appear to behave similarly and in an energy-proportional way, since they approximate well a FEP power profile. Conversely, the RSS policy, which aims at achieving load balancing, performs worse than the consolidation policies. This is due to the fact that distributing the VM workload across the servers activates a large number of servers regardless of their current load. As a consequence, servers with high or low loads share equal possibilities to become destination of an incoming VM. Fig. 3b focuses on the network power consumption. The results obtained are similar to the the previous case: consolidation policies (MNP and SSC) make the network power consumption more energy proportional than the policy aiming at balancing the load (RSS). In particular, the graph clearly show that the difference between power con-sumption of network-aware (MNP) and network-oblivious (SSC) consolidation policies is minimal.
To understand the specific contribution of computing and networking equipment on the total power, Fig. 4 shows the total power, the power due to the servers and the power due to the switches, in function of the load. All the curves appear to approximate well an ideal energy proportional curve, regardless of the data center size. Only the network power for the smaller networks shows a more discontinuous curve, due to the small number of involved networking devices. This behavior is exacerbated by the CONST power profile considered in our simulations.
Figs. 5-7 show the PPVM index under different loads, different data center sizes and different allocation policies
TABLE 2
EPE index for a 3-Tier data center
POLICY SCENARIO
micro small medium large extra-large
MNP 0.0073 0.0025 0.00082 0.00056 0.00020 SSC 0.0086 0.0035 0.00079 0.00038 0.00037
RSS 0.31 0.28 0.27 0.24 0.23
respectively. The main message in Fig. 5 is that all the curves converge to the same value, which means that the operational costs due to power become constantindependentlyfrom the size of the data center. Only when the load is very small, the PPVM shows slightly different behaviors. Fig. 6 shows the effect of the data center size and shows that the PPVM is almost independent from the switch size, and only for low loads and small data centers the value of the PPVM index is higher. When comparing the effect of the allocation policy, Fig. 7 shows that all the policies show a constant value independently from the size of the data center, and RSS achieves a PPVM equal to270W per VM, i.e. about7
times larger than consolidation policies.
We evaluate also the blocking load and observe that it slightly increases with the data center size, varying between
0.92in a micro data center and0.94for the xlarge one. This increase is due to the higher number of resources available in the latter scenario, but no meaningful difference was observed in all the other scenarios.
To assess quantitatively the effect of the data center size on the energy proportionality, we compute the EPE index on the total power. Fig. 4(a) shows the corresponding results for a load in the interval[0,0.90], i.e., smaller than the blocking load. Tab. 2 shows EPE for different sizes and for different allocation policies. Based on these results, we can claim that larger data centers are more energy proportional, indepen-dently from the adopted policy and layout. This is due to the larger number of computing and communication resources, which permits a more gradual resource commitment in function of the load. As observed before, when comparing the policies, the ones that consolidate the workload (i.e. MNP, SSC) achieve better energy proportionality than the ones that distributed the workload (RSS). Furthermore, MNP and SSC behave very similarly, and none of them is outperforming the other.
Finally, we compare the power efficiency of the network by computing the NPE index. The results in Fig. 8 show that the power efficiency is strongly influenced by the policy and the size of the data center. When increasing the data center size from micro to xlarge, the NPE decreases by a factor 10. RSS is around5×less efficient than the consolidation policies. The MNP policy slightly outperforms SSC since it minimizes the network consumption by construction. Nevertheless, the gain of MNP with respect to SSC is small. Therefore, both consolidation policies are very robust in terms of power efficiency.
4.2.2 Comparison between different DCN
2377-3782 (c) 2016 IEEE. Personal use is permitted, but republication/redistribution requires IEEE permission. See http://www.ieee.org/publications_standards/publications/rights/index.html for more information.
0 0.1 0.2 0.3 0.4 0.5 0.6 0.7 0.8 0.9 1 0
0.2 0.4
0.6 0.8 1
Data Center Load
Normalized
Po
wer
MNP SSC RSS
(a) Total Data Center Power
0 0.1 0.2 0.3 0.4 0.5 0.6 0.7 0.8 0.9 1 0
0.2 0.4
0.6 0.8 1
Data Center Load
Normalized
Po
wer
MNP SSC RSS
(b) Networking Equipment Power
Fig. 3. Normalized Power consumption of different allocation policies aiming at consolidation (MNP, SSC) and load balancing (RSS)
0 0.2 0.4 0.6 0.8 1
0 0.2 0.4 0.6 0.8 1
Data Center Load
Total
DC
Po
wer
micro small medium
large xlarge
0
0
.
2
0
.
4
0
.
6
0
.
8
1
0
0
.
2
0
.
4
0
.
6
0
.
8
1
Data Center Load
Total
DC
Po
wer
micro
small
medium
large
xlarge
(a) Total Power
0 0.2 0.4 0.6 0.8 1 0
0.2 0.4 0.6 0.8
1
Data Center Load
Computing
Po
wer
micro small medium large xlarge
0
0
.
2
0
.
4
0
.
6
0
.
8
1
0
0
.
2
0
.
4
0
.
6
0
.
8
1
Data Center Load
Computing
Po
wer
micro
small
medium
large
xlarge
(b) Servers Power
0 0.2 0.4 0.6 0.8 1 0
0.2 0.4 0.6 0.8
1
Data Center Load
Netw
orking
Po
wer
micro small medium large xlarge
(c) Switches Power
Fig. 4. Power consumption for different size of a 3-Tier DCN under a MNP policy
0 0.1 0.2 0.3 0.4 0.5 0.6 0.7 0.8 0.9 1 0
100 200 300 400
Data Center Load
PPVM
(W)
micro small medium large xlarge
0
0
.
1 0
.
2 0
.
3 0
.
4 0
.
5 0
.
6 0
.
7 0
.
8 0
.
9
1
0
100
200
300
400
Data Center Load
PPVM
(W)
micro
small
medium
large
xlarge
Fig. 5. PPVM for a 3-Tier DCN, under MNP policy and for different data center sizes
TABLE 3 Data Center Networks
ARCHITECTURE EQUIPMENT
SERVERS SWITCHES PORTS
2-Tier 5 808 55 2 420
3-Tier 6 144 112 3 584
Jupiter 6 144 256 4 096
consolidation policy. The settings for the considered scenario are reported in Tab. 3, according to which we approximately fix the size of the data center to host around6,000servers, which corresponds to a large data center. The actual number
micro small medium large extra-large 0
10 20 30 40 50 60 70
Data Center Size
PPVM
(W)
Load=5% Load=20% Load=50% Load=90%
Fig. 6. PPVM for a 3-Tier DCN, under MNP policy and for different data center loads
of nodes (server and switches) has been chosen based on the peculiarity of the considered DCN.
Fig. 9 compares the PPVM index for different loads and different DCNs. Interestingly, all the DCNs shows thesame
PPVM, independently from the load. Thus, we can claim that the operation cost due to power is equivalent among the different DCNs, and thus simple to estimate experimentally. Notably, for the specific (but realistic) power model we considered in our simulations, PPVM is around 40 W per VM, the same value observed in all the scenarios considered for 3-Tier layout in the previous Section 4.2.1.
the level of energy proportionality. The numerical results show that the three DCNs behave almost as ideally energy proportional: the 2-Tier scores 0.00038, the 3-Tier 0.00057, and Jupiter 0.00055. As a conclusion, we can claim that all the three DCNs perform almost ideally in terms of energy proportionality, independently from the size and load, given that a consolidation policy is adopted.
5
D
ISCUSSIONThe methodology illustrated in this paper is positioned to become an essential tool for data center operators to optimize management of existing facilities, to plan capacity extensions and to design future data centers. To illustrate, the operators willing to expand the capacity of existing facilities can easily assess the scale of the extension. Having determined the grade of energy proportionality in the facility, the forecasted loads to be supported and the implemented resource allocation policy, it becomes straightforward to decide the amount of resources that are required to upgrade the facility satisfying the tradeoff cost/revenues, expressed in terms of the number of VM it is possible to accommodate and the required power to provision the service. It is worth to highlight that the model takes into account VMs with heterogeneous requirements in terms of CPU, memory, storage and communication.
During the design phase of a new data center facility, the presented methodology could provide the operator the necessary information to decide the configuration of the DCN, including the number of its components to satisfy a given level of energy proportionality. For example, Table 4 illustrates the set of indexes EPE, PPVM and NPE measured when the MNP allocation policy is employed and under an offered load of 50%. The comparison analyzes different sizes of the planned DCN and the values obtained are a summary of the results presented in Section 4. We would like to recall that, the higher is the energy proportional profile of the data center, the easier is the prediction of the sustained energy costs.
5.1 Migration of VMs
All the considered policies, including RSS, SSC and MNP, operate in an incremental way, by allocating one VM at the time and never back-tracking on past decisions. Clearly, this
micro small medium large extra-large 0
50 100 150 200 250 300
Data Center Size
PPVM
(W)
RSS SSC MNP
Fig. 7. PPVM for a 3-Tier DCN and data center load equal to15%, under different allocation policies
micro small medium large extra-large 100
101
Data Center Size
NPE
(W/Gbps)
RSS SSC MNP
Fig. 8. NPE for a 3-Tier DCN and for different allocation policies.
2-Tier 3-Tier Jupiter
0 10 20 30 40
PPVM
(W)
Load=5% Load=20% Load=50% Load=90%
Fig. 9. PPVM for large data centers, under MNP policy
may lead to suboptimal solutions with respect to the results achievable when migration is allowed for already allocated VMs [24]. Nevertheless, the spirit of our contribution is to investigate the asymptotic behavior of very large data centers, and we claim that in such a scenario the effect of migration is practically negligible.
Indeed, assume for the sake of simplicity that VMs allocation is performed on the sole basis of their demand for CPU resources. Assume now that the servers support a maximum CPU capacitycmaxand that, at timeta VM arrives with a normalized CPU requirement equal toα. Specifically, α= 1when the VM demands forcmaxCPU resources, while the minimum demand for CPU resources is denoted asαmin. Consequently, α∈[αmin,1].
LetSno-migration(t)be the number ofactive serversat time
twhen migration is not allowed. Active servers are those serving at least one VM. LetSmigration(t)be the number of
active servers at timetwhen migration is allowed. Assume wtot(t)to be the total workload in terms of requested CPUs
for all the VMs arrived up to timet.
TABLE 4
Performance of 3-Tier data center for MNP allocation policy
SIZE TOTAL NODES PERFORMANCEMETRICS EPE PPVM (W) NPE (W/Gbps)
micro 110 0.00732 43.2 4.150
small 412 0.00253 41.5 1.707
medium 1 592 0.00082 40.7 0.772
large 6 256 0.00056 40.2 0.358
We consider now a consolidation scheme that tries to pack all the new arriving VMs into the minimum number of servers (as the SSC policy). When migration is not allowed, for sufficiently large values oft, most of the servers will be singularly loaded for more than cmax(1−αmin). Indeed, VMs demanding small amounts of CPU resources have high probability to arrive and occupying the unused CPU resources of active servers. The bound can be expressed as follows:
Sno-migration(t)<
wtot(t)
cmax(1−αmin). (5)
Instead, when migration is allowed, all the VMs can be reorganized at any time and exploit the unused CPU resources of active servers. As a result, all the active servers will be fully loaded in the optimal case. Thus,
Smigration(t)≥
wtot(t)
cmax . (6)
Comparing the number of active servers in the two scenarios: Sno-migration(t)
Smigration(t)
< 1
1−αmin ≈1 +αmin, (7)
where the last approximation holds since αmin is usually much smaller than1. Indeed, the minimum CPU request is very small (e.g.1CPU) with respect to the available CPUs (e.g.32-40CPUs) available in data center servers.
According to (7), the expected effect of allowing migration is to decrease the power consumption of a factor1 +αmin, which is quite small in practical cases and thus can be neglected. Note that the current analysis on the effect of migration relies on two fundamental assumptions: (i) our work provides an asymptotical analysis on energy proportionality for large data centers and for sufficiently large amounts of time (which guarantee to fill almost all the servers), (ii) the CPU requirement of a VM is fixed and does not vary during runtime. The last assumption is coherent with the standard practices in IaaS cloud computing environments [25]. OpenStack allows the users to specify the configuration of the VM. Specifically, the configurations, also known as “flavors”, are uniquely identified by virtual CPUs, disk and memory of the VM [26]. Amazon EC2, provides a pre-configured pool of VM sizes similarly to OpenStack, called “Instance Types” [27]. Once selected, the configurations cannot be changed during runtime, hence any upgrade of resource demands requires the VM to be first destroyed and then re-created with the new requirements.
6
R
ELATEDW
ORKSThis section reviews the research in the field of DCNs and related works on energy proportionality in data centers.
6.1 Background on Data Center Networks
In literature, DCNs are typically attributed to two different categories:switch-centricandserver-centric[28], [29], [30], [31]. A switch-centric network is composed of communication nodes (i.e. switches and routers), which forward packets, and computing nodes (i.e. servers) which send and receive packets. In a server-centric network, instead, computing nodes are also in charge of packet routing and forwarding,
acting as software routers. Despite in the recent years a number of server-centric DCNs were proposed, including BCube [32], DCell [33], FiConn [34] among the others [29], [30], practically they are not implemented. The main reason is the high cabling complexity and the large management costs [14]. Recentlydual-centricDCNs have been proposed in [35]. These DCNs provide flexible choices in designing layouts and promise to achieve various trade-offs between performance and power consumption, placing routing intel-ligence on both switches and servers.
Although dual and server-centric are very promising designing layouts their adoption in real data center is still quite low, thus our analysis focuses on widely-adopted switch-centric networks, derived by traditional 3-stage Clos networks. A Clos network [36] is a modular multistage switching network, based on the interconnection of small-size switches, providing full bisection bandwidth. Notably, the bisection bandwidth is proportional to the number of active core switching modules, thus in case of failures the overall performance degrades smoothly.
Unlike the majority of the works in the literature, one of the strengths of our methodology is in the integrated analysis of the power consumption of the two components of a data center: the computing equipment (servers) and the communication equipment (switches). This choice stems out from a fundamental consideration. Cloud applications are composed by highly distributed components, generat-ing both traffic and computgenerat-ing requests that impact on communication and computing consumption of the data center [37]. Therefore, it becomes essential to consider the effect of different allocation policies, which define the rules of assignment of a VM to a computing server. Indeed, allocation directly influence power consumption. Fig. 3b shows that two different allocation policies, both oblivious of the network (SSC and RSS), have different impact on the network consumption: the first is more energy proportional than the latter. In literature many research works aimed at optimizing performance and energy efficiency of allocation policies in DCNs [38], [39], [40]. However, at the best of our knowledge, none of them has analyzed the impact of allocation policies on the joint consumption of computing and communication, and how they affect each other for different DCNs. Moreover a study on the relation between scalability and energy consumption is still missing, and in this paper we aim at filling this gap.
6.2 Research on energy proportionality
maximum load, as described in Sec.3.3 about FEP profile. However, scientific community widely investigates solutions to make more energy proportional the network [2], [41], [42], [43], [44], [45]. While in the majority of the cases energy proportionality has been investigated to understand the energy profile of each single device, in our work the energy proportionality has been used as a metric to assess energy efficiency of whole DCNs, comparing different layouts, sizes and allocation policies.
Almost all the works found in literature investigate energy proportionality analyzing network consumption independently from the consumption of the computing components [2], [41], [42], [43]. But, as we demonstrate, the VM allocation policy onto servers has an impact on the network consumption, and thus energy proportionality analysis cannot be done independently (see Fig. 3b).
In [2] the energy proportionality of a network was analyzed through a theoretical comparison of two highly scalable networks: a flattened butterfly and a folded-Clos. The authors did not evaluate the consumption in function of the load, but compared the two networks based on a fixed value of the bisection bandwidth. This is a remarkable difference with respect to our work since we argue that the consumption is influenced by the allocation policy used to load the data center, as explained in Sec. 2.2.
In [41] the use of energy-proportional routers was pro-posed to connect different data centers. A green energy-aware routing algorithm was simulated, achieving a 10×
improvement in energy efficiency respect to traditional solutions. Thus, that work focused on increasing the energy efficiency of a backbone network while our interest is to investigate energy proportionality in DCNs.
The work in [46] proposed to replace high-radix switches with many tiny low port-count switches called NoTS (Net-work of Tiny Switches). Indeed, switches with lower for-warding rates achieves higher levels or power efficiency (in terms of W/Gbps) and are more energy proportional. The paper shows that deploying a large number of tiny switches enables devices to be turned off with finer granularity, thereby allowing the entire network to be more power proportional. ElasticTree [42] proposed an advanced power management, which dynamically adjusts the set of links and switches to satisfy changing in loads, minimizing energy consumption. It continuously monitors the traffic of the data center and chooses the set of network elements to activate to meet performance and fault tolerance requirements. Then it powers down as many unneeded links and switches as possible. Both [46] and [42] neglected to consider the effect of the size of data centers and of the DCN layout.
In [43] a new approach was proposed to design a DCN, based on choosing the optimal switch size that can potentially save the most power during the expected operation of the network. The scope of the work was limited to Fat-Tree topologies, with different tiers by same number of supported servers.
The work in [44] studied different techniques to reduce the operational network energy in data centers and enterprise networks. It considered specifically consolidation techniques operating directly on switches (e.g. sleep mode, rate-port adaptation) and on servers (e.g. wake-up on line, keep-alive proxy). A combination of the two techniques was
shown to lead to a 74% of energy savings, but at the cost of availability and reliability. However the proposed solution requires an oracle knowing in advance the traffic pattern. Furthermore only a small data center composed by 300 server was considered.
The Energy Proportionality Coefficient (EPC) was pro-posed to assess quantitatively the degree of energy propor-tionality of a device or a system in [21]. The EPC index is defined in the interval [0,1] and it is based on the deviation of the normalized power curvef(x)in function of the normalized load x with respect to the ideal case, corresponding to a straight line with constant slope. Beingα the angle of the the tangent in a point of the observed curve, the EPC can be calculated as follows:
EPC=
Z 1
0
sin 2α(x) dx,
where tanα(x) = df(x)/dx. By construction, a perfect energy-proportional system shows EPC= 1. However, this index cannot be used for discontinuous functions, which describe the power consumption of the data center analyzed in this works. For this reason, in the current paper we propose a new index, called EPE and defined in Sec. 2.2.
7
C
ONCLUSIONSProbably in the future, small and medium data centers will be dismissed and workloads consolidated on single data centers, to benefit from economies of scale. Moreover the bursting nature of the cloud workloads force operators to over-provision data centers to support sporadic spikes of demand. Therefore, mega data centers containing hun-dreds of thousand of servers and switches are becoming essential. They have a potential to increase the performance dramatically at the cost of power consumption. Consequently, consistent research efforts in DCN domain are undergoing. New DCNs should be scalable to support huge number of servers and energy efficient to contain costs.
In this paper, we focus on the concept of energy propor-tionality applied to the whole DCN. Energy proporpropor-tionality is a property defining the degree of proportionality between load and the energy spent to support such load. A peculiar feature of our analysis is in the consideration of the whole data center, i.e., both computing and communication devices are taken into account. Our methodology consists of an asymptotic analysis of data center consumption, whenever its size (in terms of servers) become very large. We com-pared the energy performance of different DCNs under different scenarios, varying the size (from 96 to almost
In our results we showed that the specific layout of the data center does not impact the energy proportionality, since all the DCNs achieves the same EPE under different loads. Considering the scalability of data centers, we showed that large data centers are more energy proportional. Thus we can claim that the energy proportionality is mainly driven by the number of elements of the data centers, and it is agnostic respect the layout and the adopted allocation policy. Moreover, the size and the layout of the data center do not impact on the PPVM which converge to the same value of 40W per VM. The efficiency of the network (NPE) instead, is strongly influenced by the size and the adopted allocation policy. Our results showed that the NPE decreases by a factor of 10 when the size of the data center increases.
Future directions envision the extension of the compar-ison with server-centric DCNs, which are gaining interest in the data center field. Further extension can include the comparison with more DCNs and the implementation of more realistic communication models with the possibility to move the workload of the server throughout the migration of VMs.
A
CKNOWLEDGMENTSProf. Pascal Bouvry, Dr. Dzmitry Kliazovich and Dr. Claudio Fiandrino would like to acknowledge the funding from National Research Fund, Luxembourg in the framework of ECO-CLOUD and iShOP projects.
R
EFERENCES[1] K. Zheng, X. Wang, L. Li, and X. Wang, “Joint power optimization of data center network and servers with correlation analysis,” in
IEEE Conference on Computer Communications (INFOCOM), April 2014, pp. 2598–2606.
[2] D. Abts, M. Marty, P. Wells, P. Klausler, and H. Liu, “Energy proportional datacenter networks,” inInternational Symposium on Computer Architecture (ISCA). ACM, June 2010, pp. 338–347. [3] “Clicking Clean: A Guide to Building the
Green Internet,” 2015, White Paper. [Online]. Avail-able: http://www.greenpeace.org/usa/wp-content/uploads/ legacy/Global/usa/planet3/PDFs/2015ClickingClean.pdf [4] ServerCentral, “The brain of the Internet infographic.” [Online].
Available: http://blog.servercentral.com/data-center-infographic [5] N. Rasmussen, “Calculating space and power density requirements for data centers.” [Online]. Available: http://www.apc.com/ salestools/NRAN-8FL6LW/NRAN-8FL6LW_R0_EN.pdf [6] “CH1 - Elk Grove Village, IL,” 2016. [Online]. Available:
https://www.dft.com/data-center/ch1
[7] “Ashburn, Virginia wholesale data center campus,” 2016. [Online]. Available: http://www.ragingwire.com/wholesale/ wholesale-data-center-ashburn-virginia-va2
[8] “Data center locations,” 2016, web site. [Online]. Available: https://www.google.com/about/datacenters/inside/ locations/index.html
[9] A. Roy, H. Zeng, J. Bagga, G. Porter, and A. C. Snoeren, “Inside the social network’s (datacenter) network,” inACM SIGCOMM Conference on Data Communication, 2015, pp. 123–137.
[10] L. Huang and J. Walrand, “A Benes packet network,” inIEEE International Conference on Computer Communications (INFOCOM), 2013, pp. 1204–1212.
[11] M. Al-Fares, A. Loukissas, and A. Vahdat, “A scalable, commodity data center network architecture,” inACM SIGCOMM Conference on Data Communication, 2008, pp. 63–74.
[12] P. Ruiu, A. Bianco, C. Fiandrino, P. Giaccone, and D. Kliazovich, “Power comparison of cloud data center architectures,” inIEEE ICC,
May 2016, pp. 1–6.
[13] L. Barroso and U. Holzle, “The case for energy-proportional computing,”IEEE Computer, vol. 40, no. 12, pp. 33–37, 2007.
[14] A. Singh, J. Ong, A. Agarwal, G. Anderson, A. Armistead, R. Ban-non, S. Boving, G. Desai, B. Felderman, P. Germano, A. Kanagala, J. Provost, J. Simmons, E. Tanda, J. Wanderer, U. Hölzle, S. Stuart, and A. Vahdat, “Jupiter rising: A decade of Clos topologies and centralized control in Google’s datacenter network,” in ACM SIGCOMM Conference on Data Communication, 2015, pp. 183–197. [15] N. Farrington, E. Rubow, and A. Vahdat, “Data center switch
architecture in the age of merchant silicon,” in17th IEEE Symposium on High Performance Interconnects. IEEE, 2009, pp. 93–102. [16] “Cisco Nexus 5600 platform 40-Gbps switches
data sheet,” 2016, Data Sheet. [Online]. Avail-able: http://www.cisco.com/c/en/us/products/collateral/ switches/nexus-5624q-switch/datasheet-c78-733100.html [17] C. Clos, “A study of non-blocking switching networks,”Bell System
Technical Journal, vol. 32, no. 2, pp. 406–424, 1953.
[18] Cisco Systems Inc., “Data center architec-ture overview,” 2008, Technical Report. [Online]. Available: http://www.cisco.com/c/en/us/td/docs/solutions/ Enterprise/Data_Center/DC_Infra2_5/DCInfra_1.html
[19] C. Belady, A. Rawson, J. Pfleuger, and T. Cader, “Green grid data center power efficiency metrics: PUE and DCiE,” The Green Grid Consortium, Tech. Rep., 2008.
[20] A. Jain, M. Mishra, S. K. Peddoju, and N. Jain, “Energy efficient computing-green cloud computing,” inInternational Conference on Energy Efficient Technologies for Sustainability (ICEETS). IEEE, 2013, pp. 978–982.
[21] C. Fiandrino, D. Kliazovich, P. Bouvry, and A. Zomaya, “Perfor-mance and energy efficiency metrics for communication systems of cloud computing data centers,” IEEE Transactions on Cloud Computing, 2015.
[22] L. A. Barroso, J. Clidaras, and U. Hölzle, “The datacenter as a computer: An introduction to the design of warehouse-scale machines,”Synthesis lectures on computer architecture, vol. 8, no. 3, pp. 1–154, 2013.
[23] M. Dayarathna, Y. Wen, and R. Fan, “Data center energy consump-tion modeling: A survey,”IEEE Communications Surveys Tutorials, vol. 18, no. 1, pp. 732–794, First quarter 2016.
[24] S. Ricciardi, D. Careglio, J. Sole-Pareta, U. Fiore, F. Palmieriet al., “Saving energy in data center infrastructures,” inData Compres-sion, Communications and Processing (CCP), 2011 First International Conference on. IEEE, 2011, pp. 265–270.
[25] Z. Liu and S. Cho, “Characterizing machines and workloads on a google cluster,” inParallel Processing Workshops (ICPPW), 2012 41st International Conference on. IEEE, 2012, pp. 397–403.
[26] “OpenStack documentation flavors,” 2017. [Online]. Available: https://docs.openstack.org/admin-guide/compute-flavors.html [27] “AWS EC2 instace types,” 2017. [Online]. Available: https:
//aws.amazon.com/ec2/instance-types/
[28] D. Li, J. Wu, Z. Liu, and F. Zhang, “Towards the tradeoffs in designing data center network architectures,”IEEE Transactions on Parallel and Distributed Systems, vol. 28, no. 1, pp. 260–273, Jan 2017. [29] J. Shuja, K. Bilal, S. A. Madani, M. Othman, R. Ranjan, P. Balaji, and S. U. Khan, “Survey of techniques and architectures for designing energy-efficient data centers,”IEEE Systems Journal, vol. 10, no. 2, pp. 507–519, June 2016.
[30] A. Hammadi and L. Mhamdi, “A survey on architectures and en-ergy efficiency in data center networks,”Computer Communications, vol. 40, pp. 1–21, 2014.
[31] W. Xia, P. Zhao, Y. Wen, and H. Xie, “A survey on data center networking (DCN): Infrastructure and operations,”IEEE Communi-cations Surveys Tutorials, 2016.
[32] C. Guo, G. Lu, D. Li, H. Wu, X. Zhang, Y. Shi, C. Tian, Y. Zhang, and S. Lu, “BCube: A high performance, server-centric network ar-chitecture for modular data centers,” inACM SIGCOMM Conference on Data Communication, 2009, pp. 63–74.
[33] C. Guo, H. Wu, K. Tan, L. Shi, Y. Zhang, and S. Lu, “DCell: A scalable and fault-tolerant network structure for data centers,” in
ACM SIGCOMM Conference on Data Communication, 2008, pp. 75–86. [34] D. Li, C. Guo, H. Wu, K. Tan, Y. Zhang, and S. Lu, “FiConn: Using backup port for server interconnection in data centers,” inIEEE International Conference on Computer Communications (INFOCOM), April 2009, pp. 2276–2285.
[36] W. Dally and B. Towles,Principles and Practices of Interconnection Networks. San Francisco, CA, USA: Morgan Kaufmann Publishers Inc., 2003.
[37] D. Lo, L. Cheng, R. Govindaraju, L. A. Barroso, and C. Kozyrakis, “Towards energy proportionality for large-scale latency-critical workloads,” inACM SIGARCH Computer Architecture News, vol. 42, no. 3, 2014, pp. 301–312.
[38] R. A. C. da Silva and N. L. S. d. Fonseca, “Algorithm for the placement of groups of virtual machines in data centers,” inIEEE International Conference on Communications (ICC), June 2015, pp. 6080–6085.
[39] D. Kliazovich, P. Bouvry, and S. U. Khan, “DENS: Data center energy-efficient network-aware scheduling,” inIEEE/ACM Int’l Conference on Int’l Conference on Cyber, Physical and Social Computing (CPSCom): Green Computing and Communications (GreenCom), Dec 2010, pp. 69–75.
[40] A. Beloglazov, J. Abawajy, and R. Buyya, “Energy-aware resource allocation heuristics for efficient management of data centers for cloud computing,”Future Generation Computer Systems, vol. 28, no. 5, pp. 755 – 768, 2012, Special Section: Energy efficiency in large-scale distributed systems.
[41] B. Aksanli, T. S. Rosing, and I. Monga, “Benefits of green energy and proportionality in high speed wide area networks connecting data centers,” inConference on Design, Automation and Test in Europe (DATE). EDA Consortium, 2012, pp. 175–180.
[42] B. Heller, S. Seetharaman, P. Mahadevan, Y. Yiakoumis, P. Sharma, S. Banerjee, and N. McKeown, “ElasticTree: Saving energy in data center networks.” inNSDI, vol. 10, 2010, pp. 249–264.
[43] I. Widjaja, A. Walid, Y. Luo, Y. Xu, and H. J. Chao, “Small versus large: Switch sizing in topology design of energy-efficient data centers,” inIEEE/ACM 21st International Symposium on Quality of Service (IWQoS), 2013, pp. 1–6.
[44] P. Mahadevan, S. Banerjee, P. Sharma, A. Shah, and P. Ranganathan, “On energy efficiency for enterprise and data center networks,”
IEEE Communications Magazine, vol. 49, no. 8, pp. 94–100, 2011. [45] S. Ricciardi, D. Careglio, U. Fiore, F. Palmieri, G. Santos-Boada,
and J. Solé-Pareta, “Analyzing local strategies for energy-efficient networking,” inInternational Conference on Research in Networking. Springer, 2011, pp. 291–300.
[46] J. Chabarek, S. Banerjee, P. Sharma, J. Mudigonda, and P. Barford, “Networks of tiny switches (NoTS): In search of network power efficiency and proportionality,”5th Workshop on Energy-Efficient Design, 2013.
Pietro Ruiuobtained Master Degree in Telecom-munications Engineering from the Polytechnic of Turin in 2006. He is currently a PhD student at the Dipartimento di Elettronica e Telecomunicazioni of Politecnico di Torino, with primary interest on energy efficiency of data center networks. Since 2007 he is working as Researcher at Istituto Superiore Mario Boella (ISMB), in the field of computing infrastructure, studying technologies such as Cloud Computing, Grid Computing, High performance computing (HPC) and virtualization. Since 2013 he has the role of head of the Infrastructures and Sys