538 |
P a g e
DETECTION OF FLAWS IN CONCRETE
STRUCTURES USING IMPACT ECHO METHOD
Gaurav. P. Pawar
1, Prof. Pradip. S. Lande
21
Research Scholar, Department of Applied Mechanics,
Government College of Engineering Amravati, (India)
2
Professor, Department of Applied Mechanics, Government College of Engineering Amravati, (India)
ABSTRACT
Determining the flaws in concrete elements can be a difficult job. One way to determine the flaws by Non destructive Testing is impact echo method. Three types of flaws are discussed and detected in this paper, viz, debonding of steel and concrete; corrosion of steel; honeycombing of concrete The output of this technique is in the form of graph of amplitude vs frequency. Comparison of these graphs for different types of flaws is carried out in this paper
Keywords : Impact-Echo (IE) Test, NDT-Non-Destructive Technique
I INTRODUCTION
1.1 Necessity
There have been numerous examples in the recent past of structural failures, such as the failure of the Kolkata
flyover collapse or the most recent Mahad Bridge failure in Maharashtra. There has been a growing concern
about the maintenance and inspection of the deterioration of concrete structures. The traditional test methods
used on concrete structures are destructive methods, where coring is most widely used. Obtaining cores and
determining the properties from that sample is a very reliable method for investigating the concrete at a
particular location, but it is expensive and time consuming. As an outcome of this, very few cores are taken
from the structure and so they represent only a small and unrepresentative portion of the whole structure. Also,
destructive methods, as the name implies, damage the structure investigated and the defects they leave behind
are usually focal points for further deterioration.
Condition assessment of building materials is critical when reassessing existing structures, since material ageing
can result in performance loss, degradation of safety and maintenance costs. In contrast to NDT, other tests are
destructive in nature for example, concrete core test, pull-out test and pull-off test. The use of these tests ends up
damaging the structure and the surface has to repaired after the testing. For these reasons, the use of
non-destructive testing has become more common to assess the condition of existing reinforced concrete structures.
Over the past several decades, several types of non-destructive methods have been developed for concrete to
539 |
P a g e
1.2 Non Destructive Testing
Non destructive testing (NDT) is the process of inspecting, testing, and evaluating materials, components or
assemblies for discontinuities, or differences in characteristics without destroying the serviceability of system.
In other words, when the inspection or test is completed the part can still be used. Some of the non destructive
tests used widely all over the world are Rebound Hammer Test, Ultrasonic Pulse Velocity Test. In some cases to
detect chemical attack, carbonation test, chloride test and sulphate test are performed.
For concrete structures, ultrasound, radar, thermography, electro-potential-field methods and others are currently
being used to detect voids, cracks, corrosion, etc. – with varying success. Impact echo test is one of the non
destructive methods which is designed to determine the condition and thickness of concrete, wood, stone and
masonry structural members when voids, honeycomb, and/or cracks are suspected.
1.3 Impact Echo Test
Impact-echo is an acoustic method for non destructive evaluation of concrete and masonry, invented at the U.S.
National Bureau of Standards (NBS) in the mid-1980's, and developed at Cornell University, in Ithaca, New
York, from 1987-1997.
Impact-Echo is a method for non destructive evaluation of concrete and masonry, based on the use of
impact-generated stress (sound) waves that propagate through the structure and are reflected by internal flaws and
external surfaces.
II PRINCIPLES OF IMPACT ECHO METHOD
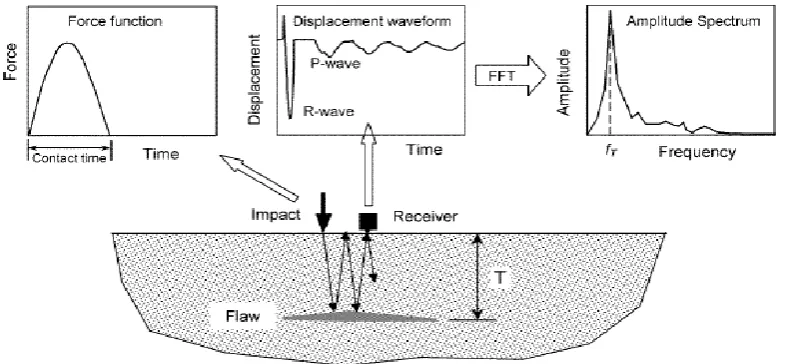
Fig 1. is a schematic of the impact-echo method, which is based on using a short duration mechanical impact to
generate stress waves and a transducer to monitor the surface displacement due to the arrival of direct and
reflected stress waves. The use of mechanical impact provides a versatile method for introducing a much higher
amount of energy than is possible with an electrical transducer. The impact produces a force-time history that
can be approximated as a half-cycle sine curve. The receiver measures displacement normal to the surface, and
the displacement history is recorded and stored as a time-domain waveform.
540 |
P a g e
If a solid is struck at a point, the disturbance propagates away from the impact point as three types of stress
waves. The P-wave and the S-wave propagate into the solid along expanding spherical wavefronts, and the
R-wave travels away from the impact along the "near-surface" region (this is similar to the ripples created when a
pebble is thrown into a pond). The P-wave travels at the fastest speed and is associated with a normal stress.
When the P-wave passes by a given point, a particle vibrates parallel to the direction of propagation, that is,
along the radius drawn from the impact point to the location of the particle (this line is called a ray path by
analogy to a light ray). The S-wave travels at a slower speed and is associated with a shearing stress.[1]
2.1 Reflection at Interface
[2]If a stress wave travelling through material 1 is incident on the interface between a dissimilar material 2, a
portion of the incident wave is reflected. The amplitude of the reflection is a function of the angle of incidence
and is maximum if this angle is 900 (normal incidence). For normal incidence the reflection coefficient, R, is
given by the following
(1)
where
Z2 = specific acoustic impedance of material 2, and
Z1 = specific acoustic imprudence of material 1
The specific acoustic impedance is a material property and is equal to the product of the wave speed and density
of the material.
In summary, impact-echo testing is based on exciting the thickness mode of vibration of a plate. The thickness
frequency (fT) is related to the plate wave speed (Cplate) and plate thickness by the following equation:
(2)
2.2 Fast Fourier Transform
[2]The fast Fourier transform (FFT) is an efficient algorithm for performing the DFT calculations. The program is
designed to work with time-domain records having the number of points equal to 2 raised to an integer. Thus
typical numbers of points in the waveform are: 29 = 512, 210 = 1024, 211 = 2048, or 212 = 4096. The amplitude
spectrum will contain N/2 points. In the impact-echo test, the time-domain waveform represents the surface
motion associated with different resonant frequencies that may be present. Transformation of the waveform into
the frequency domain by using the FFT reveals the predominant frequency components in the response. These
frequency components will appear as peaks in the amplitude spectrum. Figure 2 shows an example of a
541 |
P a g e
Fig 2: Outputs in Volts vs Time and transformation by FFT to Amplitude vs Frequency
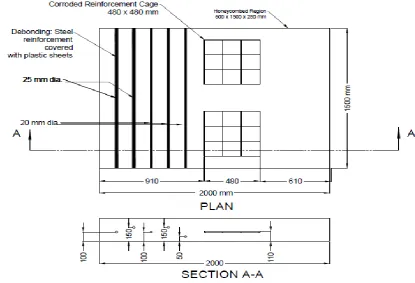
III SLAB MODEL
A slab model of size 2000 mm x 1500 mm x 250mm of grade M25 was casted introduced with debonding,
Corroded reinforcement and Honeycombing. Debonding of steel with concrete was achieved by covering the
steel reinforcement with duct tape. Half of the lengths of the steel bars were covered with duct tape. Total 5 bars
were kept in the slab model for debonding purposes. Two bars of 25mm diameter and three bars of 20mm
diameter. The bars were kept at different depths as shown in figure. Corroded reinforcement cages were
prepared of bars of diameter 8 mm of size 480mm x 480mm. One corroded cage was inserted in a saline
solution to achieve corrosion and the second one was treated with HCl (both for 5 days). To achieve the effect of
honeycombing, the portion was not properly tamped and a sand layer was inserted in the portion to exaggerate
the effect of honeycombing.
542 |
P a g e
ASTM C 1383-15: Standard Test Method for measuring the P-wave speed and the thickness of concrete plates
using Impact Echo Method[4] was referred to interpret the results obtained from Impact Echo apparatus
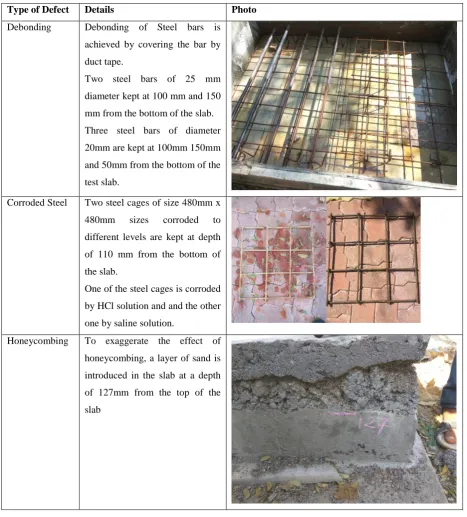
Table 1: Defects introduced in Slab
Type of Defect Details Photo
Debonding Debonding of Steel bars is
achieved by covering the bar by
duct tape.
Two steel bars of 25 mm
diameter kept at 100 mm and 150
mm from the bottom of the slab.
Three steel bars of diameter
20mm are kept at 100mm 150mm
and 50mm from the bottom of the
test slab.
Corroded Steel Two steel cages of size 480mm x
480mm sizes corroded to
different levels are kept at depth
of 110 mm from the bottom of
the slab.
One of the steel cages is corroded
by HCl solution and and the other
one by saline solution.
Honeycombing To exaggerate the effect of
honeycombing, a layer of sand is
introduced in the slab at a depth
of 127mm from the top of the
543 |
P a g e
IV RESULTS
The results show that depth of concrete slab is correctly estimated by the impact echo technique.
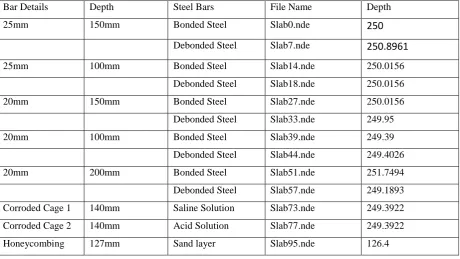
Table 2: Details of defects and depth calculated by IE technique
Bar Details Depth Steel Bars File Name Depth
25mm 150mm Bonded Steel Slab0.nde
250
Debonded Steel Slab7.nde
250.8961
25mm 100mm Bonded Steel Slab14.nde 250.0156
Debonded Steel Slab18.nde 250.0156
20mm 150mm Bonded Steel Slab27.nde 250.0156
Debonded Steel Slab33.nde 249.95
20mm 100mm Bonded Steel Slab39.nde 249.39
Debonded Steel Slab44.nde 249.4026
20mm 200mm Bonded Steel Slab51.nde 251.7494
Debonded Steel Slab57.nde 249.1893
Corroded Cage 1 140mm Saline Solution Slab73.nde 249.3922
Corroded Cage 2 140mm Acid Solution Slab77.nde 249.3922
Honeycombing 127mm Sand layer Slab95.nde 126.4
The results show that the depth of the test slab found out from impact echo technique is equal to that of actual
depth of the test slab. Below are displayed some sample graphs of Amplitude vs Frequency.
Fig 4: Amplitude vs Frequency for bonded steel bars
Amplitude vs Frequency of bonded steel bars depicts only one dominant frequency from which the depth is
calculated as 249.9mm.
544 |
P a g e
Fig 6: Amplitude vs Frequency; second peak at 161.5 mm
Above graphs are at the locations of debonding of steel. The second dominant frequency being 10369Hz denotes
a flaw at a depth of 161.5mm from the top of the beam which is actually 150mm from the top of the beam.
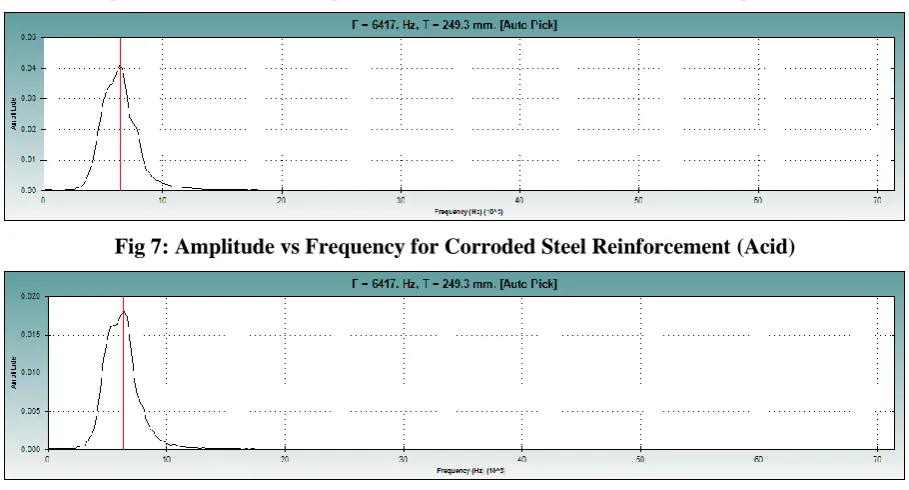
Fig 7: Amplitude vs Frequency for Corroded Steel Reinforcement (Acid)
Fig 8: Amplitude vs Frequency for Corroded Steel Reinforcement (Saline)
Fig 7 & 8 shows that corrosion could not be detected by the impact echo Technique as there is only one
dominant frequency. This could be because the cover formed by the oxidation of steel was removed by wet
concrete and there was no gap between the two surfaces of concrete and steel.
Fig: 9: Amplitude vs Frequency for Honeycombed concrete
Fig 9 clearly depicts the depth of concrete for honeycombed concrete which matches with the actual flaw
545 |
P a g e
V
CONCLUSION
1. The depth of the slab is correctly estimated by the Impact Echo Technique.
2. There is no second dominant frequency in bonded bars, just the primary dominant frequency exists.
3. There exists a second dominant frequency at the depth of the bonded bar in the unbounded steel bars.
4. The corrosion could not be determined in the concrete as the corrosion was introduced in steel at the time of
casting, which was washed out at the time of concreting.
5. Honeycombing was calculated correctly by Impact Echo Technique.
VI ACKNOWLEDGEMENTS
I take this opportunity to express my gratitude and sincere regards to my guide Prof. P. S. Lande, Applied
Mechanics Department, Government College of Engineering, Amravati who is has been a constant source of
guidance and inspiration throughout my Dissertaion Work. A heartly thanks to Ms. Harshada Javeri for her
timely support for this work. I am thankful to Olson Engineering, USA for providing us with all the technical
support relating to Impact Echo Technique.
REFERENCES
1. Impact Echo: The Fundamentals, Nicholas J Carino, International Symposium Non-Destructive Testing
in Civil Engineering, September 15-17, 2015
2. The Impact Echo Method: An Overview, N. J. Carino, Proceedings of the 2001 Structures Congress &
Exposition, May 21-23, 2001, Washington D.C, American Society of Civil Engineers ,Reston, Viginia,
3. Experimental and Numerical Studies on Nondestructive Evaluation of grout Quality in Tendon Dects
using Impact Echo Method; Chunjiang Zou, Zhengzhou Chen, Ping Dong, Changhe Chen, Yi Cheng,
Journal of Bridge Engineering, April, 2015
4. ASTM C1383-15 Standard Test Method for measuring the P wave speed and the thickness of concrete