Nat. Hazards Earth Syst. Sci., 13, 2195–2207, 2013 www.nat-hazards-earth-syst-sci.net/13/2195/2013/ doi:10.5194/nhess-13-2195-2013
© Author(s) 2013. CC Attribution 3.0 License.
EGU Journal Logos (RGB)
Advances in
Geosciences
Open Access
Natural Hazards
and Earth System
Sciences
Open AccessAnnales
Geophysicae
Open AccessNonlinear Processes
in Geophysics
Open AccessAtmospheric
Chemistry
and Physics
Open AccessAtmospheric
Chemistry
and Physics
Open Access DiscussionsAtmospheric
Measurement
Techniques
Open AccessAtmospheric
Measurement
Techniques
Open Access DiscussionsBiogeosciences
Open Access Open Access
Biogeosciences
Discussions
Climate
of the Past
Open Access Open Access
Climate
of the Past
Discussions
Earth System
Dynamics
Open Access Open Access
Earth System
Dynamics
DiscussionsGeoscientific
Instrumentation
Methods and
Data Systems
Open Access
Geoscientific
Instrumentation
Methods and
Data Systems
Open Access DiscussionsGeoscientific
Model Development
Open Access Open Access
Geoscientific
Model Development
DiscussionsHydrology and
Earth System
Sciences
Open AccessHydrology and
Earth System
Sciences
Open Access DiscussionsOcean Science
Open Access Open Access
Ocean Science
DiscussionsSolid Earth
Open Access Open Access
Solid Earth
Discussions
Open Access Open Access
The Cryosphere
Natural Hazards
and Earth System
Sciences
Open Access
Discussions
Risk evolution: how can changes in the built environment influence
the potential loss of natural hazards?
B. Schwendtner, M. Papathoma-K¨ohle, and T. Glade
University of Vienna, Department of Geography and Regional Research, Vienna, Austria Correspondence to: B. Schwendtner (schwendtnerbarbara@gmail.com)
Received: 19 December 2012 – Published in Nat. Hazards Earth Syst. Sci. Discuss.: – Revised: 2 April 2013 – Accepted: 24 May 2013 – Published: 10 September 2013
Abstract. Alpine areas often suffer significant loss and
dam-age due to a range of natural processes such as landslides, debris flows, snow avalanches or floods. Sealing of the soil surface, settling in endangered areas and enhanced human in-tervention in the natural settings, as well as socio-economic changes, increase the risk and susceptibility of built environ-ments to natural hazards and the costs of the consequences in a spatio-temporal context. The present study examines the loss estimation of a particular debris flow event for different points in time. The event occurred in August 1987, affected the municipality Martell in South Tyrol, Italy, and resulted in a total cost of C 25 million. The approach presented in this paper focuses on the changes of the land use and settle-ment expansion in the area since 1954 and attempts to assess the monetary impact of a similar event, which could have happened before (1954, 1985) or following the actual event (1992, 1999, 2006). The method applied is based on the use of a vulnerability curve which was developed for the specific area, based on the documentation of the damage of the 1987 event. Based on this curve, a loss estimation was carried out in order to visualise the risk evolution in a period of 52 yr (1954 to 2006). The results show a significant increase in the extent of the built environment (number, size and value of buildings) which consequently reflect an increase of the po-tential overall loss through the years. The method can be used in order to assess the potential loss for future scenarios based on different spatial patterns of the built environment.
1 Introduction
Floods, snow avalanches, debris flows, landslides and rock falls are only some of the processes that are often respon-sible for significant loss of life and physical damage to any
kind of objects in Alpine regions. Climate change is expected to influence the frequency and magnitude of such events (IPCC, 2012). Moreover, development of the Alpine areas and significant changes to land use and land cover, as well as socio-economic changes (spatial pattern of the built environ-ment, changes in population density, expansion of agricul-tural or settlement areas) over time, are expected to change the pattern of elements at risk of the Alpine communities and their damage potential (Fuchs et al., 2005; Hufschmidt et al., 2005; Keiler, 2004; Keiler et al., 2005). The influence of these changes on possible consequences of future events needs to be taken into account when planning in an Alpine environment. A comprehensive system of risk management and prevention measures is important, in order to reduce the potential losses. Considering that, the evaluation of risk evo-lution and the changes of the potential consequences of nat-ural hazards referring to past events are of great significance (Keiler et al., 2006). Decision makers and other stakehold-ers are in need of tools and methods that will assist them in developing an overview of possible consequences and more specifically monetary losses in order to carry out cost-benefit analysis for possible structural mitigation measures.
The importance of vulnerability analysis for the design of risk reduction strategies has been emphasised in numer-ous studies (Papathoma-K¨ohle et al., 2011, 2012a, b; Fuchs et al., 2005, etc.). Vulnerability curves, wherever these are available, can be used for the estimation of the potential loss as long as the intensity, velocity or pressure, which will af-fect each building, is known. Vulnerability, as a term, is thor-oughly discussed by scientists of various disciplines concern-ing its definition and application. In this study, the focus is on physical vulnerability and, for this reason, vulnerability is defined as the “degree of loss to a given element or a set of elements within the area affected by a hazard. It is
expressed on a scale of 0 (no loss) to 1 (total loss)” (UN-DRO, 1984). There is no standard methodology in assessing physical vulnerability (Papathoma-K¨ohle et al., 2011), how-ever, besides vulnerability matrices and fragility curves (Ei-dsvig, 2009), vulnerability curves are widely used in the field of natural hazards generally and more specifically for debris flows (Akbas, 2009; Fuchs et al., 2007; Quan-Luna et al., 2011; Papathoma-K¨ohle et al., 2012a, b).
Vulnerability curves express the relationship between the degree of loss of a specific element at risk and the sity of the process. In the case of debris flows, the inten-sity of the process is often expressed as the deposition height (Papathoma-K¨ohle et al., 2011; Rickenmann, 2001) but also as impact pressures or kinematic viscosity (Quan Luna et al., 2011) or pressure. The disadvantages of vulnerability curves are that they do not consider any additional characteristic of the analysed buildings, require a significant amount of data to be reliable and that they are not easily transferable to other re-search areas having different structural characteristics. How-ever, vulnerability curves provide an approximation of the way elements at risk resist or fail under the impact of differ-ent forces and are translating loss in monetary terms.
The aim of the present study is to carry out a new approach of loss estimation using existing vulnerability curves to as-sess potential loss of hazardous events in the future consider-ing past changes in the spatial pattern of elements at risk. The study uses a spatio-temporal approach to evaluate the degree of loss in a specific area assuming that a debris flow event, which originally occurred in August 1987, happens again at a different point in time. The research question focuses on esti-mating the potential consequences for the debris flow having an impact on elements at risk in the study area for selected research years (1954, 1985, 1992, 1999 and 2006).
2 Study area and event description
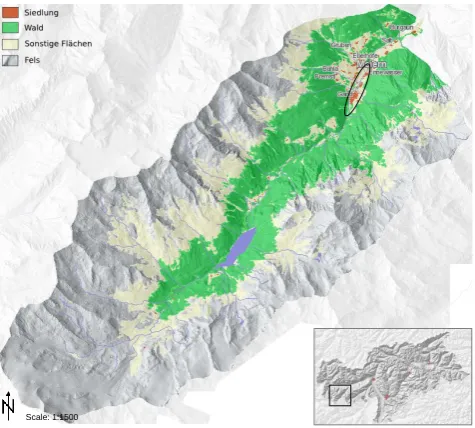
The municipality of Martell is located in the identically named tributary valley of Vinschgau in South Tyrol, Italy (Fig. 1). The altitude ranges from 950 m up to 3700 m a.s.l. to the glacier covered mountains in the southern part of the 27 km long valley (Martell, 2013). Major parts of the val-ley are of high-Alpine character, the tree-line ranges between 2100 to 2300 m a.s.l., whereas the valley bottom is inten-sively used for agriculture. The settlement areas, namely the main village Meiern and several smaller but more densely settled parts (Gand, Ennewasser and Burgaun), are located in the north. In general, the climate in South Tyrol is rather dry and strongly influenced by the surrounding mountain ranges. Locally, heavy precipitation is a common triggering factor for debris flows, landslides and flash floods (Bell et al., 2010). The record of precipitation data shows a significantly high rainfall sum for August 1987, the period when the de-bris flow event occurred (Autonomous Province of Bolzano, 2011b).
22 1
Figure 1. Overview of the location of the research valley in the Autonomous Province of 2
Bolzano (smaller right, 2011a) and the valley of Martell (indicated in the square) and its 3
natural features itself (University of Innsbruck, 2008) . The study areas of the villages Gand 4
and Ennewasser are circled. 5
Legend: red – settlement area, green – forest, light yellow – other areas such as alps, meadows and 6
pasture areas, grey – rocks and high alpine environment. 7
8
Scale: 1:1500
Fig. 1. Overview of the location of the research valley in the Au-tonomous Province of Bolzano/South Tyrol (2011a, overview map), the valley of Martell (indicated in the square) and its natural features itself (larger map, University of Innsbruck, 2008). The study area of the villages Gand and Ennewasser are encircled. Legend: red – set-tlement area, green – forest, light yellow – other areas such as alps, meadows and pasture areas, grey – rocks and high Alpine environ-ment.
In the past, the settlement development was characterised by fluctuating numbers of population and since the late 19th century, Martell has shown a slight decline in population (Perkmann-Stricker, 1985). The main economic sector with the highest net production remains the agriculture, which has experienced a significant intensification since 1970 in form of orchards and the usage of sprinkling systems (Martell, 1998). The valley is embedded in the National Park Stilfer-sjoch and the focus lies on summer tourism. The number of tourist arrivals increased over time (2009 approx. 12 000 per year), whereas the overnight stays (2009: 60 000) stagnated on this level. Referring to the event and the years follow-ing 1987, no decline in touristic figures can be observed, al-though two guesthouses closed. (WIFO, 2010)
23 1
Figure 2. Consequences and extent of the debris flow on the 24th of August, 1987 2
(Municipality Martell, 1987). The arrows indicate the flow direction. 3
4
5
Fig. 2. Extent of the debris flow on 24 August 1987 (Municipality Martell, 1987). The arrows indicate the flow direction.
protected the village from abrupt flooding from the glacial and periglacial environment.
On 24 August 1987, following some days of continuous rainfall, the river Plima transported a significantly higher amount of water than usual. Debris flows were initiated in tributary streams along the valley; the general situation was tensed, awaiting a hazardous event. In the evening, the in-habitants were evacuated, as the water level was still rising. Approximately two hours after the evacuation, a tremendous debris flow went through the valley, leaving behind a scene of destruction. The main reason for the generation of the de-bris flow was an unfortunate concatenation of circumstances. The reservoir lake of the dam was filled to its maximum due to the rainfall. A power cut and the failure of the emer-gency generators led to a release of an excessive amount of water, as the water gates could not be closed automatically (Pfitscher, 1996). The outflow has been estimated to be three-fold of the usual discharge (300 to 350 m3s−1). The debris flow reached the village Gand around 21:00 LT, overflowed the river bed and found its way through the village (Fig. 2). Not only houses were destroyed, but also fields were flooded, the infrastructure was interrupted and an industrial zone in Vinschgau was devastated (Pfitscher, 1996). Fortunately, due to the early warning and evacuations there were no lives lost. The total damage summed up to 45 to 50 billion lire (ap-proximately 23.2 to 25.8 million EUR). The damage for pri-vate households amounted to slightly less than C 8 million. As far as the infrastructure, the construction yard, forestry, agriculture, tourism infrastructure and emergency response are concerned, damages of C 4 million were recorded. Fur-thermore, C 5.6 million needed to be spent to build up the regional road network, the telephone network and for torrent control measures. The indirect costs of the event were not assessed (Pfitscher, 1996).
3 Methodology and uncertainties
The present study focuses on the spatial and temporal com-parison of the variation of the damage potential and the changes regarding the elements at risk (Akbas et al., 2009; Fuchs et al., 2004; Sterlacchini et al., 2007). A spatio-temporal approach attempts to answer the question: if it had happened at another point in time, would the event have had a higher impact? The emphasis is on detecting the changes of the spatial pattern of the built environment in the villages of Gand and Ennewasser using aerial images. The location and size of the buildings in relation to the debris intensities lead to a monetary estimation of the damages for each year. The constant factors are assumed to be the building struc-ture, the hazard intensity, and as previously mentioned the vulnerability curve. For the account of the damage potential only the residential buildings were taken into consideration, whereas the calculation of the occupied built area, all build-ing elements such as car ports or barns are included. Figure 3 presents the four main the steps of the applied method: aerial photos acting as basis information (A), an interpolated inten-sity map (B) based on the depth of the deposits in metres, the digitalisation of the elements at risk (C) and the resulting consequences (D).
3.1 Intensity map
Interpolated reconstruction of the event
Digitalisation of elements at risk Combination of intensity and loss per building Aerial photos 1954 to 2006
A
C
B
D
Fig. 3. Framework of the methodology: (A) The interpolated intensity map is based on the debris flow depths measured for individual buildings. (B) Aerial images serve as digitalisation base to (C) detect the elements at risk for different points in time. (D) By using the vulnerability curve and the information regarding the intensity the degree of loss for each year of research can be calculated.
map can then be overlaid with aerial photos of past (1954, 1985) and more recent years (1992, 1999, 2006) in order to display the spatial pattern of the elements at risk within the intensity classes in different years.
3.2 Data and mapping of the elements at risk
The data used consisted primarily of aerial photos and served as the basis for digitalising the buildings (Fig. 3, point B). Additionally, historical images were used for validation as they indicate the settlement structure at different points in time. The first aerial photo originates from 1954 and – due to the rather poor quality – historical pictures were consulted to allocate the buildings properly. These pictures were included in the historical book from the municipality (Perkmann-Stricker, 1985) and were also collected during a field work. The second aerial photo is from 1985, two years before the event occurrence and shows a comparable spatial pattern of
the built environment before the devastating event. The aerial photo from 1992 gives an excellent overview of the direct changes after the event. The last two research years (1999 and 2006) function as a more recent overview of the changes in the spatial pattern of the built environment and specifically show the increase in living space.
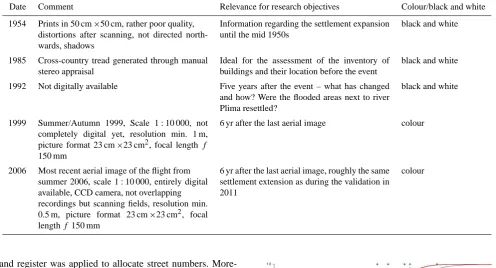
These aerial photographs are each independent recordings and for this reason their recording height, time and method varies (Table 1). The comparability is given by georeferenc-ing, as they lie directly above each other and were rectified for further use.
3.3 Digitalisation
Table 1. Overview of the aerial images and their information (Autonomous Province of Bolzano, 2011c; University of Innsbruck, 2008).
Date Comment Relevance for research objectives Colour/black and white
1954 Prints in 50 cm×50 cm, rather poor quality, distortions after scanning, not directed north-wards, shadows
Information regarding the settlement expansion until the mid 1950s
black and white
1985 Cross-country tread generated through manual stereo appraisal
Ideal for the assessment of the inventory of buildings and their location before the event
black and white
1992 Not digitally available Five years after the event – what has changed and how? Were the flooded areas next to river Plima resettled?
black and white
1999 Summer/Autumn 1999, Scale 1:10 000, not completely digital yet, resolution min. 1 m, picture format 23 cm×23 cm2, focal lengthf 150 mm
6 yr after the last aerial image colour
2006 Most recent aerial image of the flight from summer 2006, scale 1:10 000, entirely digital available, CCD camera, not overlapping recordings but scanning fields, resolution min. 0.5 m, picture format 23 cm×23 cm2, focal lengthf 150 mm
6 yr after the last aerial image, roughly the same settlement extension as during the validation in 2011
colour
land register was applied to allocate street numbers. More-over, the digitalisation scale was set to 1:2000 in order to ensure both a general image of the settlement without ne-glecting structural building features and an equal data and digitalisation quality. As the focus was set on physical vul-nerability, all kinds of houses, such as residential and com-mercial or agricultural buildings, were mapped. However, gardens, forecourts and other surrounding objects were not included. Despite its importance and the fact of being heavily damaged by the event, the infrastructural vulnerability (street network, power lines, pipelines, etc.) was not considered in this study.
Calculating the potential loss of the investigated years, only residential buildings were considered, as they were the only ones included in the vulnerability curve. Using the in-tensity map, the referring deposition heights can be allocated to each element at risk.
3.4 Vulnerability curve
Based on event documentation, the heights of the debris flow deposits were estimated and the monetary damage per build-ing was calculated. Papathoma-K¨ohle et al. (2012a) carried out a building-precise assessment of the debris flow intensi-ties and the monetary loss of most of the affected buildings of the 1987 event. Overall, 69 buildings have been damaged or completely destroyed (Pfitscher, 1996), however, only 53 of these buildings were used for the development of the vul-nerability curve (Fig. 4) as only for this amount of build-ings adequate photographic documentation was available. In more detail, photos from the damage documentation and
Fig. 4. Vulnerability curve (blue) and validation curve (red) devel-oped using the buildings that were affected during the 1987 event in Ennewasser and Gand. The curves express the relationship be-tween the degree of loss (0–1) and the intensity of the debris flow expressed as debris height (m) (Papathoma-K¨ohle et al., 2012).
additionally aerial photos were used to locate the buildings. By using photographic documentation the extent of damage was translated in monetary loss based on standard prices for renovation works. The degree of loss for each building has then been assessed by considering also the building value based on real compensation data and the size of the build-ing (Papathoma-K¨ohle et al., 2012a).
27 1
Figure 5. Traditional residential building in Gand, number 27 (Photo: Schwendtner B., 2011) 2
3 Fig. 5. Traditional residential building in Gand, number 27 (Photo: B. Schwendtner, 2011)
real compensation data from the specific event in 1987 for the calculation of the degree of loss. The visual comparison of the two curves demonstrated the reliability of the devel-oped vulnerability curve.
In the present study, the specific vulnerability curve serves as the basis for assessing the monetary loss. As the intensities for each building are known for each point in time, the degree of loss can be ascertained based on the vulnerability curve (blue curve in Fig. 4). The respective degree of loss indicates the percentage of overall loss for a building (e.g. an element at risk with a degree of loss of 0.5 in 1987 had restoration costs of 50 % of its overall building value).
3.5 Uncertainties
Inevitably, the application of the methodology had to be par-tially based on assumptions (e.g. the building structure re-mains the same throughout the time) which eventually led to a number of uncertainties. Firstly, there are uncertain-ties due to the poor quality of some of the aerial photos, as shadows and resolution vary greatly. Secondly, the buildings were digitised in an aerial perspective, which may be differ-ent to the real floor area of the building. Thus, the overall area may increase from the roof, which protrudes over the building by at least one metre. Moreover, large car ports or other buildings cannot clearly be distinguished from residen-tial buildings. Therefore, during an intense field survey in 2011, the actual building structure, likely being the one from 2006, was recorded. The building types, functions and fea-tures were recorded; the collocation of the buildings to each other was clarified and inaccuracies due to the primary data (aerial images) were eliminated. Furthermore, historical pic-tures functioned as validation for the years before the event. Consequently, a variance coefficient of 36 m2was calculated to allow a range of square metres in the analysis. The vari-ance coefficient has been derived by calculating the average size for each building and therefore the mean for all selected
28 1
Figure 6. Settlement development in Gand and Ennewasser from before 1954 until 2006. 2 Fig. 6. Settlement development in Gand and Ennewasser from
be-fore 1954 until 2006.
points in time. For the loss estimation, a minimum, maximum and average value has been calculated. Further assumptions needed to be made regarding the number of floors. During the field visit, a detailed documentation has made that can be used for the research years after the event (1992, 1999 and 2006). For 1985, the same number of storeys was used as that from the event documentation and for 1954 historical photos were the source of information.
3.6 Loss estimation and values of elements at risk
Fig. 7. Visualisation of the damage potential and the deposition height of the 1987 event.
The following parameters were taken into consideration:
– area in square metres;
– number of floors;
– attic (distinction between attic used as living space or
not);
– car port or other additional buildings;
– cellar.
The prices for living area, cellar and attic were taken from Papathoma-K¨ohle (2012a) and were based on data from Keiler (2004), Keiler et al. (2006) and the Autonomous Province of Bolzano (2010). Using this information, the overall value of each building can be calculated. For a restoration of the building to its original state, the working hours and additional repair work on the electricity, painting, etc., were taken into account (Kaswalder, 2009). The adjust-ment regarding the inflation has been already made in the primary data.
In order to illustrate the loss calculation process, an ex-ample is given. The residential building with the number 27 is located on the southern end of Gand (Fig. 5). The clas-sic Alpine style house had in 2006 two floors and an attic,
which is used as living space. Two additional buildings on both sides of the house were once used as stables or barns. The digitised living space is 268.71 m2. The specification of the ranging value allows an approximation of the real value of 269±36 m2(→305 and 233 m2, respectively). First, the overall value of the house is determined, by calculating the minimum (Eq. 1) and the maximum value (Eq. 2).
Vmin=(A×F×p)+
ai×pi× A
2
+(aj×p× A
2)
+(nb×A×p) (1)
Vmax=Vmin+(nc×pc×A), (2)
whereAis the area in square metre,F the number of floors,
pthe price per square metre in C,ai attic not used as living
space,aj attic used as living space,pi the price of the attic
not used as living space in C,nb the number of additional buildings,pbthe price of additional buildings per square me-tre in C,ncthe number of cellars,pcthe price of a cellar per square metre in C.
Vmin=(268.71×2×1153)+(0×294.03× 268.71
2 )
+(1×1153×268.71
2 )+(1×149×575.91)
=860 367 (3)
Vmax=860 367+(1×575.91×268.71)=1 015 230. (4) In total, this calculation was carried out three times: using the derived surface of the digitalisation and with the variance coefficients of+36 m2 and−36 m2. Thus, a total of three values for the building have been obtained (minimum, maxi-mum and average value). For further use of this data, the av-erage value will be applied, which amounts to the previously discussed example of C 937 743.
Once the overall value of a building has been determined, the damage was calculated based on the event of 1987. For this purpose, the data of the intensity map is necessary be-cause it provides information on the deposit height in a cer-tain area. Using the existing vulnerability curve, the expected monetary loss per building was derived based on the per-centage of the degree of loss. The damage per building was again calculated using the ranging values. For example, for the residential building in Gand 27, the intensity was 1.81 m in 1987, which resulted in an overall loss of 52 %. Conse-quently, the potential damage of this house in 2006 would have been C 487 626 with a variance of±59 437 EUR. By repeating the above presented process for each building in the affected area, the overall loss of the event in each year of research was calculated. Furthermore, the losses were spa-tially visualised, as seen in Fig. 3d.
4 Results
The results show clearly that the research area has under-gone various changes in the past decades. These changes were partially due to the hazardous event but also due to socio-economic changes (better economic situation result-ing in smaller household sizes and less multi-generational houses, bigger houses, higher employment numbers in ter-tiary sector) which may have a significant influence to losses regarding natural hazards.
4.1 Settlement development
An overview of the housing development and the develop-ment period of the buildings is given in Fig. 6 (total number of buildings for each research year in Table 2). The illustra-tion is based on the aerial photo of 1985 (two years before the event) showing the original river regime and some buildings, which were destroyed in 1987 and relocated thereafter. Until 1954, houses were mainly built along the main road. The next generation attached newly constructed homes to the existing older ones. As a result, the settlements in both districts Gand
Table 2. Number of buildings significantly affected (deposit height >0.5 m), less affected (<0.1 or <0.5 m) and the total number of residential buildings from 1954 to 2006 (1987 for comparison, Papathoma-K¨ohle et al., 2012). Note: The number of houses in 1987 is based on the data from the event documentation, where only slightly or significantly damaged buildings were included.
Date Significantly Less Total
affected affected number
>0.5 m <0.5 m <0.1 m
1954 28 9 3 40
1985 34 31 9 74
1992 39 27 13 79
1999 47 28 14 89
2006 49 28 15 92
1987 27 12 14 53
and Ennewasser have consolidated more and more over time. Especially between 1954 and 1985, an intense construction period can be observed, which is clearly visible in the village of Ennewasser.
After the event, two houses and four farm buildings were not rebuilt in the same place. In addition, the riverbed of Plima was regulated. Some of the former building plots were redesignated and kept unobstructed from settlement develop-ment. During the upcoming period between 1985 and 1992 five new buildings were constructed but also building exten-sions were created. The commercial and artisan area between Gand and Ennewasser also began to emerge during that time. Until 1999, three new houses were built around this area, and another seven in Ennewasser and Gand. After the turn of the millennium, three new houses were constructed but, compared to the previous periods, the growth was limited. It can be clearly seen that there was a tendency to consolidate the settlements rather than building houses within a distance from each other.
guest houses were found in this size range. In general, build-ings between 100 and 250 m2represent a percentage of ap-proximately 17 %, which has not changed in the time se-ries. In subsequent periods of seven years (1992, 1999 and 2006), the built-up area first increased by 34 % (from 18 612 to 24 876 m2), then by 14 % (to 28 295 m2), and by 7 % (to 30 311 m2). Thus, the time in between the study years was associated with an increase in the area occupied by build-ings, which started with a considerable expansion and was followed by a lesser increase. Overall, the built-up area has increased by 248 % between 1954 and 2006 (from 8705 to 30 311 m2).
4.2 Deposition heights and spatial distribution of
elements at risk
The spatial distribution of debris deposition for the 1987 event shows that Gand experienced generally higher deposits than Ennewasser, this is why Gand suffered the most se-vere damage and higher costs (Fig. 7, years shown: 1954, 1985 and 2006). Especially affected were the buildings at the southern end of Gand as the river Plima sought its way from the stream bed. The deposition heights reached up to 3 m in this area. In Fig. 7, a broad band of intensities of around 2 m, which traces the transfer area of the debris flow, is clearly vis-ible. In Ennewasser, deposition heights were not as high and a total destruction (degree of loss=1) has not been reported for the event of 1987. Obviously, the river found its way back to the main river course. The difference between Gand and Ennewasser can also be reflected in the difference in the av-erage intensity in Gand (1.2 m) and Ennewasser (<0.5 m).
The temporal analysis regarding the development of the research area shows a clear trend towards constructing more buildings in areas with higher deposition intensity. This would be equal to a vulnerability of about 0.6, based on the ratio between the deposition height and the degree of loss. Additionally, buildings can be considered potentially signifi-cantly affected by debris flows, when the deposition height is higher than 0.5 m as water and debris can intrude the building (Table 2). The term “less affected” (0.1 to 0.5 m) indicates that the building will be damaged mainly on the outside or due to water and material entering the basement. Throughout the years, more than 50 % of the buildings can be found in areas where they would have been significantly affected. In 1954, 28 buildings would be significantly affected; only three buildings would be largely unaffected. The following years of investigation show a change of the distribution. In 1985 and 1992 more than 50 % of the elements at risk are located in areas where the intensity would be less than half a metre. This means that in the last 30 yr a potential occurrence of the same event would have caused half of the existing build-ings to be affected by intensities up to 0.5 m. Nevertheless, a significant number of buildings are not affected and their percentage rose from 8 % in 1954 up to 16 % in 2006.
4.3 The temporal evolution of the loss
The results show a significant increase of the loss values over the years. More importantly, the results are in line with the amount of loss in 1987, as the loss increases in conjunction with the settlement development.
Detailed descriptions of the total potential damage and building values were calculated for each year. Overall, the building values between 1954 and 2006 have increased by 234 %, which corresponds to a tripling in value and is in ac-cordance with the growth of constructed area. From 1954 to 1985, the summed building values have doubled (from C 21.5±4 million to C 43.7±7.7 million). Thereafter, the increase has not been as strong as before, which is due to the shorter time intervals and a decline in construction activities. Nonetheless, between 1985 and 1992 there was still a large increase of 34 %, from 1992 to 1999 17 % and until 2006 the building values changed by 5 % with regard to 1999. The average values are obtained by dividing the number of build-ings included in the analysis, and the total for each year study year. Until 1985, the value remained at C 600 000 per home and increased until 1992 by 26 % to almost C 750 000. The changes thereafter are marginal, as the building expansion only sparsely increased.
The degree of loss gives a better impression of the possible consequences on a monetary basis (Table 3). In 1954, the damage would be less than C 2.4±0.6 million. The total damage, 31 yr later, would have been 2.6-fold, namely C 6.2±1.2 million. As new buildings were con-structed in zones, where the intensity in 1987 was up to three metres, the potential degree of loss in 1992 sums up to C 10.5±1.35 million. Until 1999, a further increase to C 13.2±1.7 million was calculated. At the end of the time series in 2006, a total loss for residential buildings of C 13.9±1.8 million could be expected. Between 1954 and 2006, the amount would have increased by 5.8 times. The average loss value per building would increase by 152 %. Thus, in 1954, the average loss per building can be set to C 59 852±15 000. In 1985, the average loss per household is C 84 110±16 146, in 1992 C 133 218±17,138 and in 2006 C 151 043±19 376. The resulting values vary from more than C 2.4 million in 1954 to C 13.9 million in 2006, imply-ing a potential six fold increase.
Table 3. Building values and the resulting potential loss in Euro including variance coefficient and mean value between 1954 and 2006.
Date Value ± Loss ± Median
1954 21 545 702 4 092 873 2 394 082 603 719 11 239 1985 43 752 145 7 690 671 6 224 105 1 194 821 5850 1992 58 799 349 8 299 000 10 524 226 1 353 878 10 727 1999 68 827 853 9 580 196 13 163 381 1 721 678 19 507 2006 72 062 354 9 866 506 13 895 925 1 782 553 18 362
1987 16 141 108 1 534 512 7 979 257 – 19 868
is C 5850. In 1992, almost the level of 1954 ( C 10 727) is reached and in 1999 the median rises up to slightly under C 20 000. In 2006, the median declines again to C 18 362.
Furthermore, there are clear differences between Gand and Ennewasser. Especially the southern part of Gand is af-fected, as the debris flow hit those buildings first. In 1954, the damage would have accounted C 2.2±0.57 million in Gand, while Ennewasser only would have compensated one-sixteenth of the total spend in Gand. A similar re-sult would have been obtained for 1985, where the total damages in Gand would be C 6±1.16 million, but only C 224 753±36 867 in Ennewasser. In the following years, the degree of loss in Gand is about nine times higher than in Ennewasser. It is especially noteworthy that the overall damage in Ennewasser between 1954 and 1985 has not even doubled. Until the next study in 1992, however, a sharp in-crease of over C 1 million of potential damage can be identi-fied, which is due to the settlement expansion in this period. Moreover, the deposition intensity in 1987 was significantly lower than in Gand, which is why many buildings remained intact and would be less affected by a similar event. Also, the average damage value is much higher in Gand which sums up to C 233 705 compared to only C 42 000 in 2006 for En-newasser. It can be concluded that the lower deposition in-tensities in Ennewasser would clearly result in much lower damage values.
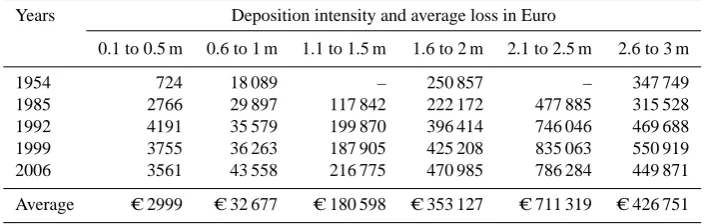
A comparison of the spatial deposition intensities with the overall damage value is shown in Fig. 7. There is an obvi-ous coherence which concludes that the higher the intensities are, the higher the loss will be. Table 4 shows the average loss per building for pre-defined intensity classes. Elements at risks, which were affected by a smaller amount of debris, suffer significantly less damage. As long as buildings are in areas, where the intensities were below 0.1 m, the damage is significantly lower and tends towards zero. Relatively mi-nor damages of less than C 50 000 are mainly found in En-newasser. The average for the lowest intensity class between 0.1 and 0.5 m for all research years lies at C 3000. The fol-lowing intensity class (0.6 to 1 m) indicates a clear increase of the degree of loss between C 50 000 to C 100 000, as the debris flow material can enter buildings. The greatest poten-tial for damage is to be expected for the deposition heights from 2.1 to 2.5 m, particularly since 1992, as the average
damage reaches a sum in excess of C 700 000. The follow-ing intensity classes (larger 2.5 m) show by far a smaller amount of damage, which is due to the smaller amount of residential buildings in those classes and a higher probability of completely destroyed elements at risk. In 1954, five build-ings would have been in the class>2.5 m, in the following research years there were only three. Furthermore, the po-tential loss also depends on the average size of the build-ings, which is in 1954 relatively smaller compared to other research years.
5 Discussion and conclusion
The municipality of Martell is characterized by settlement expansion and increase in building size and value. By re-constructing the deposit heights and developing an intensity map of the event in 1987, the potential loss in different years was identified. The amount of damage increases over time, due to increased settlement development and the construc-tion of new buildings in high intensity areas. The main set-tlement area is the village Gand, which is consequently the most densely settled part in Martell. The highest degrees of loss were determined in the central part of the village, which was due to the accumulation of debris flow material dur-ing the event in 1987. Moreover, significant differences be-tween Gand and Ennewasser can be identified through time, as Gand would have been severely affected during all in-vestigated years in comparison with Ennewasser. However, development trends clearly show that the risk potential in Ennewasser is significantly lower through time and there is a strong trend in increasing building development in Gand where the damages have been significantly higher.
The years after the event were characterized by rebuild-ing destroyed houses at similar locations and followed by a settlement spread. New houses were built in zones where debris flow intensity was higher and would cause equal or even higher damage values if the 1987 event would occur again. Nonetheless, the area right next to the river Plima has been kept clear for any built-up areas as a form of active risk management using spatial planning tools. Consequently, the potential damage is reduced in these areas.
Table 4. Resulting loss values in Euro in comparison with the deposit intensity in metres.
Years Deposition intensity and average loss in Euro
0.1 to 0.5 m 0.6 to 1 m 1.1 to 1.5 m 1.6 to 2 m 2.1 to 2.5 m 2.6 to 3 m
1954 724 18 089 – 250 857 – 347 749
1985 2766 29 897 117 842 222 172 477 885 315 528
1992 4191 35 579 199 870 396 414 746 046 469 688
1999 3755 36 263 187 905 425 208 835 063 550 919
2006 3561 43 558 216 775 470 985 786 284 449 871
Average C 2999 C 32 677 C 180 598 C 353 127 C 711 319 C 426 751
of people employed in agriculture has fallen drastically, caus-ing the majority workcaus-ing in the tertiary sector, mostly com-muting to nearby villages in the Vinschgau. Nonetheless, only a few farms were abandoned and the primary sector is still the largest contributor to the economic value of the community. The municipality has enhanced its knowledge and capacities in various ways, which are expressed by con-cepts and strategies, such as an intensified agricultural use (orchards) or focussing on summer tourism. Notwithstand-ing that population decreased in the study area durNotwithstand-ing the investigated period, the settlement development has indeed increased, which means that some families have remained living in the valley. The amount of elements at risk increased in conjunction with an increment of the living area and a decline in the size of households. The settlement structure has undergone a considerable change from being fairly com-pressed to a more structured arrangement of houses. The results are in accordance with other studies using spatio-temporal approaches to assess loss estimations and changes in physical vulnerability (Fuchs et al., 2012a, b; Keiler et al., 2006; Quan Luna et al., 2011, etc.) and focusing on the de-velopment of Alpine villages (B¨atzing, 2003).
The results of the study can also be seen in the context of global change and the modifications in the valley of Martell in the respective investigated time span of 52 yr. The analysis of the settlement expansion in a long run gives information about possible planning strategies and hazard zone mapping. The agricultural intensification plays an important role in the valley, where potential direct and indirect losses can be ex-pected in case of a natural hazard. The results provide deci-sion makers with an overview of how the settlement devel-opment and consequently the size of the consequences of a potentially hazardous event evolved throughout time. More-over, decision makers are provided with a tool in order to assess the loss that may be expected in the area, should an event similar to the one of 1987 happen again. The repre-sentation of the possible consequences in space and time ap-pear to be very valuable for the identification of endangered areas and areas that need more attention regarding building policies, protection measures, etc. Local authorities can make informed decisions regarding relocation or reinforcement of
buildings and location as well as type and size of structural mitigation measures. The results of the present study can be used for cost benefit analysis for protection measures since information regarding the costs of the “do nothing” option can be compared with the costs of the option of adopting structural measures. In this way, the design of adequate risk-reduction strategies will be enabled and politicians can be easily convinced to fund these strategies. Moreover, the in-formation can also be used for emergency planning since pri-oritisation of efforts can be based on the intensity map, on the spatial pattern of the built environment and the density of the population based on the distribution and use of the buildings. Future land use plans can be acquired by the municipality and can be integrated in the study. In this case the loss of a similar event in the future (e.g. in 20 or 50 yr) can also be estimated. Moreover, more elements at risks can be also con-sidered such as agricultural areas or touristic facilities that also suffer considerable loss when impacted by debris flows. In the present study, only direct costs (building rehabil-itation) and renovation were considered. In future studies more direct costs (e.g. buildings content) or indirect costs (compensation for immediate temporary housing for evac-uees) could also be included. Last but not least, the hazard itself can be further investigated and remodelled. However, the 1987 event was partly a man-made event. Although the hydroelectric plant is still in use, the possibility of a simi-lar event happening again is low. Nevertheless, the area has suffered regularly from debris flow events in the past which are also expected to be more frequent due to climate change (IPCC, 2012). A thorough hazard assessment and mapping of debris flow in the area can provide a new basis for a similar study.
Byron Quan Luna for his insightful help, Margreth Keiler and two anonymous referees for their valuable inputs.
Edited by: L. Bouwer
Reviewed by: M. Keiler and two anonymous referees
References
Akbas, S. O., Blahut, J., and Sterlacchini, S.: Critical assessment of existing physical vulnerability estimation approaches for de-bris flows, in: Proceedings of landslide processes: from geomor-phologic mapping to dynamic modeling, edited by: Malet, J. P., Remaitre, A., and Bogaard, T., Strasburg, 2009.
Autonomous Province of Bolzano: Sch¨atzungsstudie zur Berech-nung des Schadenspotentials bei Hochwasserereignissen durch die Rienz im Abschnitt Bruneck-St. Lorenzen, Department Wasserschutzbauten, Amt f¨ur Wildbach- und Lawinenverbauung Ost, Bozen, South Tyrol, 2009.
Autonomous Province of Bolzano: Richtpreisverzeichnis Hochbauarbeiten 2010. Abteilung Hochbau und technischer Dienst, Ressort Bauen, Bozen, South Tyrol, 2010.
Autonomous Province of Bolzano: Geobrowser, Abteilung Informationstechnik, available at: http://gis2.provinz.bz.it/geobrowser/ (last access: 16 July 2013), 2011a.
Autonomous Province of Bolzano: Climate Data 1921 to 2010, Hy-drographical Department, South Tyrol, 2011b.
Autonomous Province of Bolzano: Aerial images, Department for Spatial Planning, South Tyorl, available at: http://www.provinz. bz.it/informatik/kartografie/landeskartografie-orthofoto.asp (last access: 16 July 2013), 2011c.
B¨atzing, W.: Die Alpen – Geschichte und Zukunft einer eu-rop¨aischen Kulturlandschaft, Verlag C. H. Beck oHG, M¨unchen 1991, M¨unchen, 2003.
Bell, R., Greiving, S., Pohl, J., R¨ohrs, M., Glade, T., Thiebes, B., and Mayer, J.: Untersuchungsgebiete, in: Integrative Fr¨uhwarnsysteme f¨ur gravitative Massenbewegungen (ILEWS), edited by: Bell, R., Mayer, J., Pohl, J., Greiving, S., and Glade, T., Monitoring, Modellierung, Implementierung, Klartext Verlag, Essen, 2010.
Eidsvig, U. M. K.: Vulnerability and Risk Assessment for Geo-hazards, Vulnerability quantification for landslides and tsunamis, ICG Report 2006-2-14, NGI Report 20061032-14, 2009. Fuchs, S., Br¨undl, M., and St¨otter, J.: Development of avalanche
risk between 1950 and 2000 in the Municipality of Davos, Switzerland, Nat. Hazards Earth Syst. Sci., 4, 263–275, doi:10.5194/nhess-4-263-2004, 2004.
Fuchs, S., Keiler, M., Zischg, A., and Br¨undl, M.: The long-term de-velopment of avalanche risk in settlements considering the tem-poral variability of damage potential, Nat. Hazards Earth Syst. Sci., 5, 893–901, doi:10.5194/nhess-5-893-2005, 2005. Fuchs, S., Heiss, K., and H¨ubl, J.: Towards an empirical
vulner-ability function for use in debris flow risk assessment, Nat. Hazards Earth Syst. Sci., 7, 495–506, doi:10.5194/nhess-7-495-2007, 2007.
Fuchs, S., Keiler, M., Sokratov, S., and Shnyparkov, A.: Spa-tiotemporal dynamics: the need for an innovative approach in mountain hazard risk management, Nat. Hazards, 1–25, doi:10.1007/s11069-012-0508-7, 2012a.
Fuchs, S., Ornetsm¨uller, C., and Totschnig, R.: Spatial scan statistics in vulnerability assessment – an application to mountain hazards, Nat. Hazards, 64, 2129–2151, 2012b.
Hufschmidt, G., Crozier, M., and Glade, T.: Evolution of natural risk: research framework and perspectives, Nat. Hazards Earth Syst. Sci., 5, 375–387, doi:10.5194/nhess-5-375-2005, 2005. IPCC: Managing the Risks of Extreme Events and Disasters to
Ad-vance Climate Change Adaptation, in: A special report of Work-ing Groups I and II of the Intergovernmental Panel on Climate Change, edited by: Field, C. B., Barros, V., Stocker, T. F., Qin, D., Dokken, D. J., Ebi, K. L., Mastrandrea, M. D., Mach, K. J., Plattner, G.-K., Allen, S. K., Tignor, M., and Midgley, P. M., Cambridge, UK and New York, NY, USA, Cambridge Univer-sity Press, 2012.
Kaswalder, C.: Sch¨atzungsstudie zur Berechnung des Schadenspo-tentials bei Hochwasserereignissen durch die Rienz im Abschnitt Bruneck – St. Lorenzen, Autonome Provinz Bozen – S¨udtirol, Bozen, South Tyrol, 2009.
Keiler, M.: Development of the damage potential resulting from avalanche risk in the period 1950–2000, case study Galt¨ur, Nat. Hazards Earth Syst. Sci., 4, 249–256, doi:10.5194/nhess-4-249-2004, 2004.
Keiler, M., Zischg, A., Fuchs, S., Hama, M., and St¨otter, J.: Avalanche related damage potential – changes of persons and mobile values since the mid-twentieth century, case study Galt¨ur, Nat. Hazards Earth Syst. Sci., 5, 49–58, doi:10.5194/nhess-5-49-2005, 2005.
Keiler, M., Sailer, R., J¨org, P., Weber, C., Fuchs, S., Zischg, A., and Sauermoser, S.: Avalanche risk assessment – a multi-temporal approach, results from Galt¨ur, Austria, Nat. Hazards Earth Syst. Sci., 6, 637–651, doi:10.5194/nhess-6-637-2006, 2006. Martell: Martelltal Wissenswertes, available at: http:
//www.gemeinde.martell.bz.it/gemeindeamt/html/ MartelltalWissenswertes.pdf, last access: 16 July 2013. Martell: Event Documentation, Municipality Martell, 1987. Martell: Newsletter Martell, available at: http://www.gemeinde.
martell.bz.it/gemeindeamt/download/219782890 1.pdf (last ac-cess: 16 July 2013), 1998.
Papathoma-K¨ohle, M., Kappes, M., Keiler, M., and Glade, T.: Phys-ical vulnerability assessment for alpine hazards: State of the art and future needs, Nat. Hazards, 58, 645–680, 2011.
Papathoma-K¨ohle, M., Keiler, M., Totschnig, R., and Glade, T.: Improvement of vulnerability curves using data from extreme events: a debris flow event in South Tyrol, Nat. Hazards, 64, 2083–2105, 2012a.
Papathoma-K¨ohle, M., Totschnig, R., Keiler, M., and Glade, T.: A new vulnerability function for debris flow-The impor-tance of physical vulnerability assessment in alpine areas, 12th Congress INTERPRAEVENT 2012-Grenoble/France, confer-ence Proceedings, 1033–1043, 2012b.
Perkmann-Stricker, A.: Das Martelltal – eine Chronik, Gemeinde Martell, Martell, 1985.
Pfitscher, A.: Wasserkatastrophen im Martelltal – Der 24./25. Au-gust 1987, Municipality Martell, 1996.
Rickenmann, D.: Murg¨ange in den Alpen und Methoden zur Gefahrenbeurteilung, in: Mitteilungen des Lehrstuhls und Instituts f¨ur Wasserbau und Wasserwirtschaft, Rheinisch-Westf¨alische Technische Hochschule Aachen, 124, 51–77, 2001. Sterlacchini, S., Frigerio, S., Giacomelli, P., and Brambilla, M.: Landslide risk analysis: a multi-disciplinary methodolog-ical approach, Nat. Hazards Earth Syst. Sci., 7, 657–675, doi:10.5194/nhess-7-657-2007, 2007.
UNDRO: Disaster prevention and mitigation – a compendium of current knowledge, Preparedness aspects, Vol. 11, New York, 1984.
University of Innsbruck: Kulturlandschaftswandel S¨udtirol – Der Wandel seit 1950, available at: http://www.uibk.ac.at/ geographie/projects/kls/martell/ueberblick.html (last access: 16 July 2013), 2008.