An Exploratory Study Of The
Effects Of Online Course Efficiency
Perceptions On Student Evaluation Of
Teaching (SET) Measures
Hooman Estelami, Fordham University, USAABSTRACT
One of the fundamental drivers of the growing use of distance learning methods in modern business education has been the efficiency gains associated with this method of educational delivery. Distance methods benefit both students and educational institutions as they facilitate the processing of large volumes of learning material to overcome barriers related to time, geography and physical facility constraints. Nevertheless, existing research has not examined the extent by which these efficiency gains, compared to traditional face-to-face teaching, are recognized by online students. Moreover, the extent by which students’ perceptions of course efficiency affects other key educational measures, such as intent to take online courses in the future, and instructor and course ratings, has not been examined in current research. In this paper, utilizing data from student evaluation of teaching (SET) surveys from multiple sections of three online marketing courses, the effects of perceived course efficiency on various SET measures are examined. The results indicate, that contrary to popular belief, students who view online courses as efficient exhibit lower sentiments towards the course and the instructor, and are also academically weaker than other students. The paper concludes with a discussion of the findings and future directions for research.
Keywords: Online Education; Course Evaluation; Student Satisfaction
INTRODUCTION
ne of the primary underlying motivations for the adoption of distance learning methods is the efficiency gains that are often attributed to distance education. Many of the factors that create physical constraints and infrastructural demands in traditional face-to-face teaching become less relevant in the distance mode of teaching (Allen and Seaman 2014; Dowell and Small 2011; Ponzurick, Russo-France and Logan 2000). For example, distance education has lower demands on the physical facilities of the educational institution while at the same time it provides significantly greater flexibility in terms of the time and environment in which the online students can engage with the learning material. Students can access learning material such as podcasts, lecture captures and other learning resources at a time of convenience to them, and as a result more efficiently use their time (Alharthi 2010; Benbunan-Fich, Lozada, Pirog, Priluck and Wisenblit 2001; Pirluck 2004). Furthermore, the use of automated grading rubrics and assessment software has made it possible for distance educators to process large numbers of online students, resulting in efficiency gains for universities (Childress 2012; Simonson and Smaldino 2014).
online students can experience learning outcomes equal to and in some cases greater than traditional classroom students (Arbaugh, Desai, Rau and Sridhar 2010; Estelami 2012; Russell 1999), student perceptions of such efficiency gains has not been quantified or studied. Furthermore, research has not examined the characteristics of those online students who find the learning efficiency of the online learning process as different from traditional classroom learning. Understanding the characteristics and views of this unique group of students is instrumental to the future of distance education.
To better understand students’ perceptions of the efficiency of online courses, in this study we explore the extent to which online delivery of marketing courses is perceived by students to be more or less efficient compared to face-to-face delivery. This line of inquiry will be carried out in the context of three online marketing courses. We will examine how those students who perceive an online course as more efficient may be different from those students who perceive it as less efficient. Specifically, the impact of efficiency perceptions on critical measures such as instructor ratings and course ratings, as well as students’ intent to take online courses in the future is examined. Surprisingly, the results show that efficiency gains are not positively related to course and instructor ratings. Furthermore, significant differences in the students’ academic profiles can be identified as function of their perceptions of online course efficiency. The paper concludes with a discussion of the implications of the findings on educational administration and distance education research.
EFFICIENCY IN ONLINE EDUCATION
The concept of efficiency is a central defining characteristic of any system. For industrial and mechanical systems, standardized measures of efficiency are defined such that they take into account the relationship between the inputs put into the system versus the outputs gained from it (Muir 2005; Rossiter and Jones 2015). For example, in establishing the efficiency of an automobile, the commonly used technical measure of efficiency is the miles (output) per gallon (input). Similarly for electric home heating and cooling systems, the common measure of efficiency is the Coefficient of Performance which is expressed in terms of the ratio of the amount of cooling or heating achieved divided by the hourly amount of energy applied to the system. While such measures of efficiency are commonly discussed in a range of industries, in educational settings they are less frequently quantified, relied upon or studied (Clark, Nguyen and Sweller 2005; Edirisingha 2008; Rosa and Amaral 2014). This is partially driven by the fact that there is great variability and measurement error associated with both the inputs and the outputs of the educational process, complicating the quantification of educational efficiency (Christensen, Johnson and Horn 2010; Rovai, Ponton and Baker 2008; Russell 1999).
Measures similar to efficiency are also commonly used in the study of social exchange processes, bilateral negotiations, and perceptions of equity in human relationships. For example, Equity Theory (Bolton, Tat Keh and Alba 2010; Young 1995) has been used to study human perceptions of social exchanges in terms of the balance between what an individual invests into a social exchange versus what he/she receives in return. Not surprisingly, situations in which the inputs outweigh the outputs are perceived as less equitable and the exchange is viewed less favorably, compared to situations where the output gains are greater (Agarwall and Larrick 2012; Corfman and Lehmann 1993; Loh, Sting, Huchzermeier and Decker 2012). The human desire for a balance between the inputs and the outputs in exchange processes has been found to be central in a range of consumer social interactions, such as those related to bilateral negotiations involving sales transactions (Oliver and Swan 1989) and service exchanges (Kumar, Scheer and Steenkamp 1995). Where there is an imbalance between the input and the output, dissatisfaction may result.
convenient to them, and can improve their effective use of study time to maximize learning. Further efficiencies have been associated with the standardization of online course content through professional course design processes, automated grading systems, and the use of assessment tools intended to maximize student learning (Dowell and Small 2011; Rosa and Amaral 2014; Simonson and Smaldino 2014).
SOURCES OF EFFICIENCY GAINS FOR ONLINE STUDENTS
Learning Effects
The majority of research studies to date indicate that distance education and traditional face-to-face teaching can yield equivalent learning outcomes (Arbaugh, Desai, Rau and Sidhar 2010; Hansen 2008; Rosa and Amaral 2014). An early study by Leasure, Davis and Theivon (2000) showed that online students have average test scores which are statistically equal to that of students taking identical courses in face-to-face format. In a study of the training outcomes of information technology professionals, Saneaton and Keogh (1999) also found equal learning outcomes between the online and classroom students. In the specific context of business education, Grandzol (2004) examined teaching quality ratings in Business Statistics courses, comparing the measures between online and face-to-face classes, and found no difference in the ratings between the two formats. Hay, Hodgkinson, Peltier and Drago (2004) contrasted the level of student satisfaction between online and traditional MBA programs and found that both the level of student interactivity and the degree student satisfaction can be higher in the online format.
Several studies have focused on learning outcomes, specifically for online marketing courses. In the context of the introductory marketing course in MBA programs, Ponzurick, Russo-France and Logan (2000) studied the performance outcomes of students taking the course in an online format. While they found the students’ performance outcomes in the online format to be lower than that of students in the traditional teaching format, they also found that the online format was favored by the students due to its flexibility and convenience. In contrast to their findings, Priluck (2004) found equal student performance results for the basic introductory marketing course in an MBA program, but lower student satisfaction ratings. Performance equivalency results are also reported by Friday et al. (2006) in the context of an Organizational Management course, whereby equal performance scores for students in the online format and those in the classroom face-to-face format are found. Estelami (2012) has also found that for Marketing Research courses, no differences exist in perceived learning or student satisfaction when comparing pure online courses which have no face meetings with hybrid-online courses with some face-to-face interaction.
Effort Effects
Online courses provide unique benefits to the students. One of the most commonly recognized benefits is the flexibility gained through the online format (Simonson, Smaldino, Albright and Zvacek 2009). In online courses, students are able to more effectively manage their study hours by accessing course content at a time and place that is most convenient to them. This is a sharp contrast to classical face-to-face teaching which requires student presence at specific points in time for class attendance. Therefore, both geographic and time barriers can be overcome through distance learning means. These benefits are further amplified by the fact that due to their focused design, online educational content tends to be more concise and can be presented in highly absorbable formats, bypassing many of the inefficiencies of lecture-style teaching in which classroom time may be sub-optimally allocated to topics and issues other than the learning goals of the class session (Christensen, Jones and Horn 2010; Rosa and Amaral 2014).
NEGATIVE EFFECTS OF EFFICIENCY
While online education may present efficiency gains in the course delivery process, it is not clear how these gains are viewed by online students. This is because in online courses, the bulk of the burden of learning is passed on to the student. For example, in many online courses, students are required to utilize the online content, such as readings and video modules of lectures, on their own (Allen and Seaman 2014; Jung 2008). This places a great deal of responsibility on the student who must now plan out when to gain exposure to the learning material, and to ensure attentive processing of the material in order to complete related assignments and assessments. In contrast, in a face-to-face class instructors carry the bulk of the burden of delivering their lectures to a group of students present in a classroom setting. Therefore, while online classes present specific benefits, not all students may view them the same way. The amount of effort and responsibility passed on to the student may be considered as high by some segments of students who may view online courses as a burdensome and demanding way to learn. However, this perspective may not necessarily be shared by all students, and current research has not explored how students view the efficiency of learning in online courses.
The notion of contrasting views on the efficiency of human exchanges has been widely recognized in studies of social interactions and individual consumption decisions (Adams 1965; Loch, Sting, Huchzenmeier and Decker 2012). Consumer research has shown that increased efficiency, as measured by the ratio of outputs to inputs, does not always result in more positive buyer perceptions. For example, in purchase decisions, segments of consumers may choose to pay great premiums (high input) for the purchase of specific brands, not for their functional benefits (output) but rather for hedonistic reasons (Lehmann and Srinivasan 2014). Evidence also exists on the contrasting views of consumption efficiency in scenarios where consumption outcomes are related to improvements in human performance. In these scenarios, consumers pursue challenges and do not necessarily view lower exertion of effort positively (Deci and Flaste 1996). For example, in consumers’ choice of physical training services, consumers can be segmented into multiple groups, based on their preference for challenge (Afremow 2015; Cockerill, Pyle and Read 1996). While some segments seek more competitive and effortful exertion of training effort, other segments may only superficially relate to the social image associated with this form of training, or avoid highly demanding training regiments altogether (Deci and Flaste 1996; Epstein 2014). Similar patterns of behavior have also been noted in research on Equity Theory (Bolton, Tat Keh and Alba 2010; Young 1995). For example, it has been shown that imbalance in the exchange process may create negative feelings even in the party that benefits from the imbalance (Agarawal and Larrick 2012; Corfman and Lehmann 1993; Oliver and Swan 1989). In other words in bilateral exchanges, receiving too much for too little sacrifice may cause negative perceptions of the fairness in the exchange process by the winning party, with subsequently negative results on constructs such as satisfaction and self-image.
RESEARCH QUESTIONS
While research on efficiency is well-established in many social science fields as well as in the many branches of the physical sciences, the existing volume of research in the specific context of distance education is limited. The human learning process and educational development is unique from many other social and consumption contexts, since effort is an expected part of the process (Cockerill, Pyle and Read 1996; Hodges 2008). While distance learning research has established the benefits and the student sacrifices associated with learning through online means, the combined effects of the two have not yet been examined. As a result of the current gap in research we do not know the extent by which online education may be perceived as more or less efficient, when compared to face-to-face teaching.
(1) Are online courses viewed as more or less efficient when compared to face-to-face courses?
(2) Are key indicators of educational delivery – specifically course ratings, instructor ratings and intentions to take future online courses – affected by a student’s perceptions of online course efficiency?
(3) Are there differences in student characteristics between those who perceive an online course as efficient versus those who perceive the course as inefficient?
DATA
In order to address the above research questions, the end-of-semester student evaluation of teaching (SET) instrument used in online courses at an educational institution located in northeastern United States was used. This SET instrument consists of a battery of questions which gauge various aspects of the instructor and the course, has been adopted in the MBA program for nearly a decade, and has been used in prior published research. Overall course rating is measured by asking students: “Overall, my rating of this course is …") with the responses captured through a 1-to-5 rating scale (1='very poor'; 2='poor'; 3=’neutral’; 4='good'; 5='very good'). The same response scale is also used to measure students’ rating of the instructor, by responding to the question: "Overall, my rating of this instructor is …"
In addition to the course and instructor ratings, several questions in this SET instrument focus on specific aspects of the course, related to the teaching method. These include questions regarding the relevance of the readings and assignments, the extent by which the course increased students' interest levels, and ratings of the instructor in terms of his/her responsiveness, preparedness and accessibility. These measures are obtained using a 5-point response scale, with 1 representing 'strongly disagree' and 5 representing 'strongly agree'. In addition, students’ grade expectations were measured, using an ordinal scale (response scale: A, B ,C ,D, and F).
Additional measures, unique to the online learning environment were also obtained through this SET instrument. These measure are in place to establish the perceived learning outcomes and the amount of students’ exerted effort, compared to face-to-face courses. Perceived learning outcomes are measured by asking: “Compared to other similar courses that are not offered in an online format, would you say the level of learning for this course was ...” Self-reported student effort is measured by asking: “Compared to other similar courses that are not offered in an online format, would you say the level of workload for this course was ...”. For both these questions, a 3-point response scale is used (1=’lower’; 2=’equivalent’; 3=’greater’). The combination of these two questions allows one to quantify for each student the perceived learning efficiency of the course, by subtracting the perceived effort measure from the perceived learning outcome measure. This approach to quantifying course efficiency is consistent with prior studies utilizing self-reports of process efficiency measures (Artino 2007; Hodges 2008). In addition to these two questions, a final question is used to quantify students’ intentions to take similar online courses in the future: “Would you take a similar online course in the future?” with a 5-point response scale (1=’definitely not’; 5=’definitely yes’) and a sixth option for students who are graduating (and therefore have no need for future courses).
ANALYSIS
Across all students, the average instructor and course ratings were 4.67 and 4.43, respectively. Detailed ratings as well as the ratings of the individual items for the three courses are provided in Table 1. As can be seen from Table 1, significant differences among the three courses exist, not only with respect to the overall instructor and course ratings, but also with respect to the various measures that drive SET ratings. Overall, the Marketing Strategy course has higher ratings on all measures when compared to the other two courses. The differences in ratings among the courses are expected, and may be attributed to differences in course content and pedagogy, as well as the variations in student interest levels in the different topic areas.
Table 1. Instructor Ratings and Course Ratings Across Three Online Marketing Courses
Marketing Financial
Services
Marketing
Research Marketing Strategy
ANOVA Significance
Level
Course Rating ("Overall, my rating of this course is ... ") 4.42 4.20 4.80 p<.01 Instructor Rating ("Overall, my rating of this instructor
is ...") 4.69 4.48 4.93 p<.01 Interest Growth ("My interest in the subject has
increased as a consequence of this class") 3.96 3.85 4.39 p<.01 Assignments ("Readings and assignments contributed to
my appreciation and understanding of the subject") 4.31 4.01 4.63 p<.01 Instructor Responsiveness ("The instructor was
responsive to the students' questions and comments") 4.64 4.49 4.91 p<.05 Instructor Preparedness ("The instructor was well
prepared") 4.64 4.57 4.93 p<.05 Instructor Accessibility ("The instructor was accessible
and available to students") 4.59 4.45 4.85 p<.05
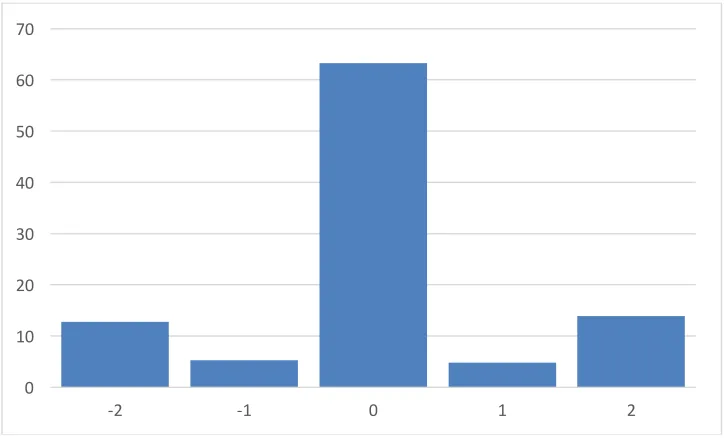
Figure 1. Percent Distribution of Perceived Course Efficiency
For ease of data analysis and interpretation, the two student groups who view online courses as less efficient that face-to-face courses (efficiency scores of -2 and -1) are combined into one group, and also the two student groups who view online courses as more efficient (efficiency scores of +1 and +2) are combined into one group. Nearly 18% of the students perceive the online courses to be less efficient than face-to-face courses, 63% perceive them to be equal in efficiency, and 19% perceive them to be superior in efficiency. Chi-square analysis shows that there are no differences in the distribution of efficiency perceptions across the three courses (p=0.29;ɸ=0.13), suggesting that the three online courses, despite the differences in content and course ratings, are perceived in similar ways with respect to their learning efficiency.
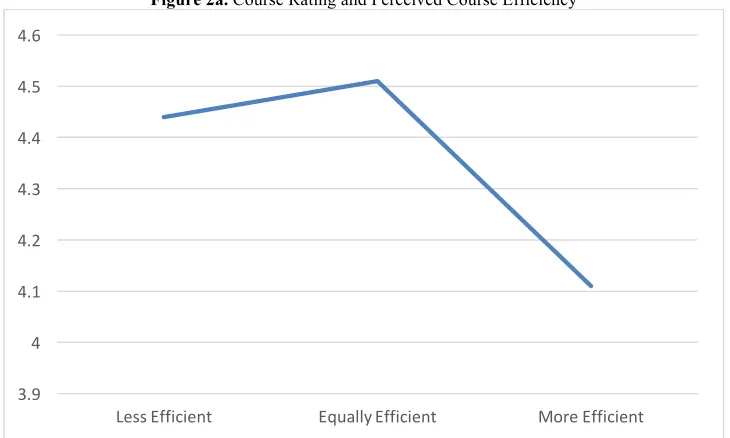
To further understand the mindset of students in each of the three groups, the SET measures were computed for each group, and are shown in Figure 2. On average, students who view online courses to be equally efficient to face-to-face courses report a course rating of 4.51. Students who view online courses as inefficient have a slightly lower average course rating of 4.44. However, there is a notable drop in course ratings for those students who view the online course as more efficient than face-to-face courses – the average course rating for this group is 4.11. The differences in course rating averages among the three groups were tested using ANOVA and are found to be statistically significant (p<.01; F2,277=6.14).
0 10 20 30 40 50 60 70
Figure 2. Student Responses and Perceived Course Efficiency Categories
Figure 2a. Course Rating and Perceived Course Efficiency
Figure 2b. Instructor Rating and Perceived Course Efficiency
3.9 4 4.1 4.2 4.3 4.4 4.5 4.6
Less Efficient Equally Efficient More Efficient
4.1 4.2 4.3 4.4 4.5 4.6 4.7 4.8
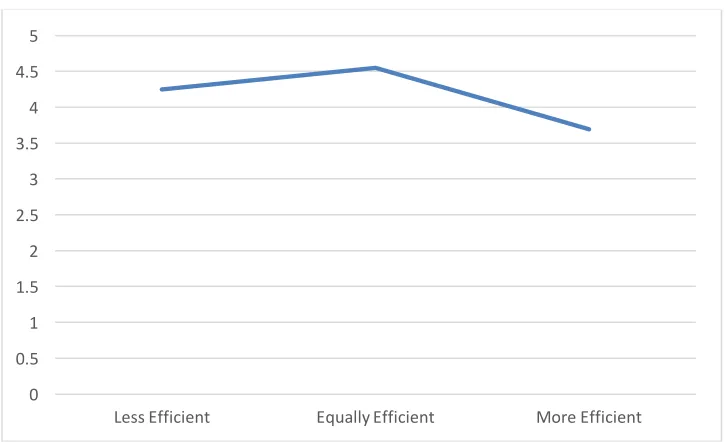
Figure 2c. Intent to Take Similar Online Course in Future and Perceived Course Efficiency
The notable drop in ratings for the group that views online courses as more efficient is also evident with respect to instructor ratings. Students who view online courses to be equally efficient to face-to-face courses report an average instructor rating of 4.77 and those who view online courses as inefficient have a slightly lower average instructor rating of 4.65. Similar to the results observed for course ratings, there is a considerable drop in instructor ratings for those students who view online courses as more efficient, with an average instructor rating of 4.37. These differences, tested through ANOVA are also statistically significant (p<.01; F2,277=8.05) and indicate that students’
perceptions of course efficiency directly influence critical SET measures, such that high levels of perceived course efficiency result in lower (rather than higher) ratings.
To examine if the above pattern of response is also evident in the students’ intent to take similar online courses in the future, average figures for future intentions were computed for each of the three groups. As expected, students who view online courses as more efficient exhibit the lowest intention score (3.69), compared to those who view online courses as less efficient (m=4.25) or those who view them as equally efficient (m=4.55). These differences are also significant (p<.01; F2,277=14.65), and reinforce the interesting and intriguing pattern of a notable drop (rather
than an increase) in student sentiment when an online course is perceived to be more efficient than a face-to-face course. This pattern may be attributed to underlying differences in student characteristics for each of the three groups under study – an issue which will be further explored in the analyses to follow below.
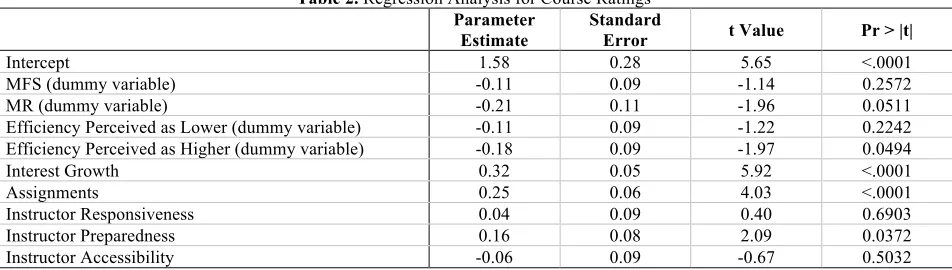
In order to examine the combined effects of student perceptions of course efficiency, as well as the detailed SET measures, on overall course ratings, a regression analysis was conducted. In this regression analysis, the dependent variable was the course rating. The predictors were the detailed SET measures (ratings of instructor’s responsiveness, preparedness, accessibility, as well as the ratings of the usefulness of the assignments and readings, and the ability of the course to increase student interest) as well as dummy variables reflecting student perceptions of course efficiency, and dummy variables for the courses. Since three overall groupings of students based on perceptions of efficiency versus face-to-face courses exist (lower, equal, higher), dummy variable coding was used. A dummy variable was set up to take on the value of 1, when a student perceives course efficiency as lower than a face-to-face class, and zero otherwise. Similarly, a dummy variable was set up to take on the value of 1, when a student perceives course efficiency as greater than a face-to-face class, and zero otherwise. This dummy variable coding allows one to differentiate the relative effects of course efficiency perceptions in comparison to those scenarios where students perceive an online course to have equal efficiency to a face-to-face course, the average effect of which is captured in the intercept term of the regression analysis (Hair, Black, Babin and Anderson 2012). The results of the regression analysis are shown in Table 2.
0 0.5 1 1.5 2 2.5 3 3.5 4 4.5 5
Table 2. Regression Analysis for Course Ratings
Parameter Estimate
Standard
Error t Value Pr > |t|
Intercept 1.58 0.28 5.65 <.0001 MFS (dummy variable) -0.11 0.09 -1.14 0.2572 MR (dummy variable) -0.21 0.11 -1.96 0.0511 Efficiency Perceived as Lower (dummy variable) -0.11 0.09 -1.22 0.2242 Efficiency Perceived as Higher (dummy variable) -0.18 0.09 -1.97 0.0494 Interest Growth 0.32 0.05 5.92 <.0001 Assignments 0.25 0.06 4.03 <.0001 Instructor Responsiveness 0.04 0.09 0.40 0.6903 Instructor Preparedness 0.16 0.08 2.09 0.0372 Instructor Accessibility -0.06 0.09 -0.67 0.5032
Since variations in course ratings were identified in Table 1, dummy variables reflecting the course were also included as predictors in the regression analysis. A dummy variable MFS was set to 1 when the SET data was from the Marketing of Financial Services course, and zero otherwise. A similar dummy variable coding was used for the variable MR, indicating if the data was from the Marketing Research course. The baseline therefore is the Marketing Strategy course, for which the average course rating is captured in the intercept term of the regression analysis. To ensure that multicollinearity does not influence the model results, the condition number for the predictor variables was computed and found to be 27.48, which indicates that multicollinearity is not a concern in the regression analysis (Aaker, Kumar, Leone and Day 2012).
As can be seen from Table 2, the regression analysis achieved a good level of model fit (R2=0.47) and is statistically
significant (F9,270=26.14; p<.01). Consistent with the results observed in Table 1, differences are evident between
the courses, indicated by the negative and statistically significant coefficient for the dummy variable reflecting the Marketing Research course. Furthermore, as expected many of the detailed SET measures positively influence students’ course ratings. Course ratings are positively affected by the ability of the course to grow students’ interest levels (p<.01), the usefulness of the readings and assignments (p<.01), and perceptions of the preparedness of the instructor (p<.05). These findings are consistent with previous research on the formation of student course perceptions in distance learning settings (Estelami 2012; Gerlich, Mills and Sollosy 2009; Peltier, Schibrowsky and Drago 2007). Most importantly, consistent with the results reported above, positive perceptions of course efficiency contribute negatively to course ratings at statistically significant levels (p<.05). This result reinforces the fact that those students who view an online course as more efficient that a face-to-face course, provide lower course ratings, compared to the rest of the students.
To determine if the above patterns with respect to the drivers of course ratings are also evident for instructor ratings, a similar regression analysis was conducted with the same set of predictors, but with instructor ratings as the dependent variable. Table 3 shows the results of this regression analysis. Similar to the previous regression analysis results, a high degree of model fit and statistical significance is observed (R2=0.46; F
9,270=113.8; p<.01). The effects
Table 3. Regression Analysis for Instructor Ratings
Parameter Estimate
Standard
Error t Value Pr > |t|
Intercept 2.11 0.24 8.77 <.0001 MFS (dummy variable) -0.05 0.08 -0.57 0.5714 MR (dummy variable) -0.19 0.09 -1.99 0.0473 Efficiency Perceived as Lower (dummy variable) -0.13 0.07 -1.75 0.0817 Efficiency Perceived as Higher (dummy variable) -0.22 0.08 -2.92 0.0038 Interest Growth 0.11 0.05 2.35 0.0197 Assignments 0.02 0.05 0.29 0.7720 Instructor Responsiveness 0.07 0.08 0.88 0.3818 Instructor Preparedness 0.21 0.07 3.09 0.0022 Instructor Accessibility 0.20 0.07 2.66 0.0082
F9,270=25.81; R2=0.46
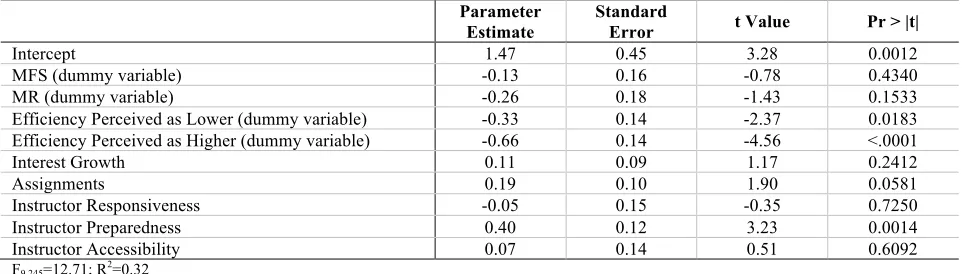
Table 4 shows the regression analysis results when student intentions to take similar online courses in the future is used as the dependent variable. The results of this analysis are also consistent with those shown earlier in Figure 2c, as well as the previous two regression analyses related to course ratings and instructor ratings. Perceptions of course efficiency influence intentions negatively for both the high and low perceived efficiency groups.
Table 4. Regression Analysis for Intentions to Take Similar Online Courses in the Future
Parameter Estimate
Standard
Error t Value Pr > |t|
Intercept 1.47 0.45 3.28 0.0012 MFS (dummy variable) -0.13 0.16 -0.78 0.4340 MR (dummy variable) -0.26 0.18 -1.43 0.1533 Efficiency Perceived as Lower (dummy variable) -0.33 0.14 -2.37 0.0183 Efficiency Perceived as Higher (dummy variable) -0.66 0.14 -4.56 <.0001 Interest Growth 0.11 0.09 1.17 0.2412 Assignments 0.19 0.10 1.90 0.0581 Instructor Responsiveness -0.05 0.15 -0.35 0.7250 Instructor Preparedness 0.40 0.12 3.23 0.0014 Instructor Accessibility 0.07 0.14 0.51 0.6092
F9,245=12.71; R2=0.32
The results of the three regression analyses, as well as the individual analysis of group means for course ratings and instructor ratings indicate that students who rate an online course as more efficient than a face-to-face course, contrary to conventional thinking, have less favorable sentiments towards the course, compared to the remainder of the students. This pattern of response begs one to question who these students are and what characteristics would be associated with them. To better understand the characteristics of the three efficiency perception groups, additional analyses were conducted by utilizing both the open-ended written responses and the grade expectation measures, collected through the SET survey instrument.
With respect to grade expectations, 72% of students who view online courses as equal in efficiency to face-to-face classes, expect to receive a grade of A. This figure rises to 87% for those students who view online courses as less efficient. Interestingly, of the students who view online courses as more efficient than face-to-face courses, only 62% expect to receive a grade of A. These differences, tested using Chi-square analysis are significant (p<.05;
ɸ=0.18) and associate a weaker academic profile with students who view online courses as more efficient than face-to-face courses, and a stronger academic profile for those viewing them as less efficient.
students’ propensity to express comments about the course, when compared to those students who perceive equal efficiency between online and face-to-face courses.
Since written comments were captured from those students who provided a response to the open-ended question, it was also possible to subject the provided comments to content analysis procedures, to determine the nature of the response and the frequency of perspectives expressed. To conduct the content analysis, standard content analysis procedures were deployed (Krippendorff 2012). The objective was to categorize for each respondent if the statement being expressed is positive, neutral, or negative. Two judges (faculty with years of experience teaching marketing) independently read the comments and categorized each statement made by the student as positive, neutral, or negative. For the entire set of responses, the judges agreed on 92% of the statements, and consistent with content analysis procedures, disagreements were resolved by a third judge. The resulting categorization of student comments allowed statistical analysis and frequency counts to be used to formally reflect student sentiment patterns. Since students could express multiple comments, for each respondent, the number of negative comments were subtracted from the number of positive and neutral comments, to provide a measure of polarity of views. When more negative comments are expressed than the sum of positive and neutral comments, polarity would be negative, and visa versa. This approach to quantifying the polarity of open-ended responses is consistent with past research in which qualitative data are transformed into quantitative measures to facilitate statistical analysis (Porath, McInnis and Folkes 2010; Schreier 2012; Spiggle 1994). Students who viewed online courses as equally efficient to face-to-face courses on average had a polarity measure of 0.196, in comparison to 0.315 for those who viewed them as less efficient and -0.019 for those who view them as more efficient. Though directionally supportive and consistent with earlier results, these differences are not statistically significant (F2,277=1.65; p=0.19), and do not conclusively
establish differences in polarity of the written responses between the three efficiency perceptions student groups.
DISCUSSION
The results indicate that for the three online marketing courses studied, the majority of students find them to be equally efficient to face-to-face courses. However, approximately one in five students find them to be more efficient, and the same proportion view them to be less efficient when compared to face-to-face courses. No significant differences between the three courses was found in terms of the efficiency ratings. These results address the first research question regarding student perceptions of the efficiency of online courses.
In addressing the second research question, the findings indicate that there are significant differences in student sentiment, depending on student perceptions of course efficiency. Interestingly, students who perceive an online course as more efficient exhibit lower levels of sentiment towards the course and the instructor. Furthermore, they are least likely to pursue take similar online courses in the future.
With respect to the third research question, the findings indicate that those students who view an online course as more efficient than a comparable face-to-face course have a weaker academic profile, as reflected in lower self-reported grade expectations. This group is also more likely to be expressive about the course, as evident by higher frequency of expression of open-ended thoughts in the SET survey instrument.
The findings in their totality question the benefits of gained efficiency in online educational settings. Overall, the results suggest that while superior efficiency through online courses is recognized by a subset (of about 20%) of the students, the efficiency gain does not translate into more positive instructor and course ratings. Furthermore, the segment that recognizes this efficiency gain is of a weaker academic standing compared to other students who may view an online course as equally efficient or even less efficient than face-to-face courses.
LIMITATIONS AND FUTURE RESEARCH
The research presented here can be expanded in many different directions. The three courses for which SET survey data were utilized are all in the field of marketing. In order to generalize the findings, replication in other sub-fields of business (e.g., finance, accounting, management, etc.) as well as other disciplines would be helpful. In addition, replication with a wider range of instructors deploying different online pedagogical approaches would help in establishing the extent by which the findings of this study can be generalized. Also, the use of larger samples of students may help uncover more refined student segments, compared to the three focused on in this study.
In addition to expanding the scope of data collection to a wider range of courses, students and instructors, future research in this area can focus on the use of different data collection methods, other than surveys. For example, an in-depth qualitative study of students, gauging their perceptions of online course efficiency would be informative. Application of content analysis procedures with such data collection approaches may help online educators gain a better understanding of the areas in which online instruction can be improved to address the needs of specific segments of the student population. Another data collection approach which may prove fruitful is the use of social media websites where student views are collected and disseminated (e.g., RateMyProfessors; RateMyTeachers, etc.). Content analysis of the postings on these sites for online courses would shed more light on student perspectives regarding the efficiency of online instruction.
While the focus of this study has been on student views of online course efficiency, future research can also examine this topic from an institutional perspective. Evidence exists regarding the efficiency gains for educational institutions that adopt online modes of course delivery. Online courses require a significantly lower level of investment in physical infrastructure and facilities, since the use of physical classrooms is minimized or omitted altogether. Given that the bulk of the costs of educational institutions is driven by their fixed costs, often attributed to facilities (Inglis 2008; Rumble 2009), online education can, in many cases, translate into the lowering of education delivery costs, with some researchers estimating the costs to be nearly half that of traditional face-to-face teaching (Jung 2003). Formal research on instructors’ and administrator’s views on the efficiency of online education can provide greater insights on the institutional opportunities and hurdles, and facilitate a better understanding of the future potential for this method of teaching.
CONCLUSION
For nearly two decades, distance education has represented the potential for revolutionizing education and disrupting traditional approaches to providing instruction (Christensen, Jones and Horn 2010). The revolutionary effects of distance education, to a large extent, stem from the conveniences and efficiencies it presents the students in engaging with the learning material. Yet, modern research on distance education has had a limited understanding of student perceptions of such efficiencies. Improved understanding of how online courses are viewed in terms of their relative efficiency compared to face-to-face courses is critical to uncovering pedagogically sound paths of growth for distance education. It is therefore hoped that this study has contributed to this understanding and has inspired further research on this important aspect of distance education.
AUTHOR BIOGRAPHY
Hooman Estelami is a professor of marketing and director of Blended and Distance Learning at the Gabelli School of Business, Fordham University in New York.
International Journal of Research in Marketing, Journal of the Academy of Marketing Science, Journal of Financial Services Marketing, Journal of Retailing, Journal of Business Research, Journal of Service Research, Journal of Product and Brand Management, International Journal of Bank Marketing, Journal of Consumer Behavior, Journal of Promotion Management, Journal of Marketing Education, and Marketing Education Review. Email: [email protected]
REFERENCES
Aaker, D., Kumar, V., Leone, R., & Day, G. (2012). Marketing Research. New York: Wiley.
Adams, J. (1965), “Inequity in Social Exchange,” in L. Berkowitz (ed.), Advances in Experimental Social Psychology. New York: Academic Press. 267–99.
Afremow, J. (2015). The Champion's Mind: How Great Athletes Think, Train, and Thrive. Boston: Rodale Books.
Agarwal, P. and Larrick, R. (2012), “When Consumers Care About Being Treated Fairly: The Interaction of Relationship Norms and Fairness Norms” Journal of Consumer Psychology, 22(2), 114-27.
Alharthi, Aisha S. (2010), "Learner Self-Regulation in Distance Education: A Cross-Cultural Study," American Journal of
Distance Education, 24(3), 135-150.
Allen, I.E. and J. Seaman (2014). Grade Change: Tracking Online Education in the United States. Babson Park, MA: Babson Survey Research Group
Arbaugh, J.B., A. Desai, B. Rau, B.S. Sridhar (2010), “A Review of Research on Online and Blended Learning in the Management Discipline: 1994-2009,” Organizational Management Journal, 7(1), 39-55.
Artino, Anothony Jr. (2007), "Self-regulated Learning in Online Education: A Review of the Empirical Literature,"International
Journal of Instructional Technology and Distance Learning, 4(6), 3-18.
Benbunan-Fich, R., H.R. Lozada, S. Pirog, R. Priluck, and J. Wisenblit (2001), “Integrating Information Technology into the Marketing Curriculum: A Pragmatic Paradighm,” Journal of Marketing Education, 23(1), 5-15.
Bolton, L., Tat Keh, H., and Alba, J. (2010), “How Do Price Fairness Perceptions Differ Across Culture?” Journal of Marketing
Research,47(3), 564-76.
Childress, Stacey (2012), “Rethinking School,” Harvard Business Review, 90(3), 76-79.
Christensen, C.M., C.W. Johnson and M.B. Horn (2010), Disrupting Class: How Disruptive Innovation Will Change the Way the
World Learns. New York: McGraw-Hill.
Clark, Ruth C., Frank Nguyen and John Sweller (2005). Efficiency in Learning: Evidence-Based Guidelines to Manage Cognitive
Load. London: Pfeiffer
Cockerill, Ian M., Hailey J. Pyle and Stephanie Read (1996), "The Self-efficacy/Self-esteem Relationship in Sport and at Work,"
Journal of Workplace Learning, 8(4), 19-23.
Cohen-Charash, Y. and Spector, P. (2001), “The Role of Justice in Organizations: A Meta-Analysis,” Organizational Behavior
and Human Decision Processes, 86(2), 278-21.
Corfman, K. and D.R. Lehmann (1993), "The Importance of Others' Welfare in Evaluating Bargaining Outcomes," Journal of
Consumer Research, 20(1), 124-135.
Curran, C. (2008), “Online Learning and the University,” in W.J. Bramble and S. Panda (eds.), Economics of Distance and
Online Learning: Theory, Practice and Research. New York: Routledge, 26-51.
Deci, Edward and Richard Flaste (1996), Why We do What We Do: Understanding Self-Motivation. London: Penguin Books. DeTure, Monica (2004), "Cognitive Style and Self-Efficacy: Predicting Student Success in Online Distance Education,"
American Journal of Distance Education, 18(1), 21-38.
Dowell, David J., and Felicity A. Small (2011), “What is the Impact of Online Resource Materials on Student Self-Learning Strategies?” Journal of Marketing Education, 33(2), 140-152.
Edelson, P.J. and V.V. Pittman (2008), “Historical Perspectives on Distance Learning,” in W.J. Bramble and S. Panda (eds.),
Economics of Distance and Online Learning: Theory, Practice and Research. New York: Routledge.
Estelami, Hooman (2012), “An Exploratory Study of the Drivers of Student Satisfaction and Learning Experience in Hybrid-Online and Purely Hybrid-Online Marketing Courses,” Marketing Education Review, 22(2), 143-156.
Edirisingha, P.(2008), “Open Basic Education: Organizational Structures, Costs and Benefits,” in W.J. Bramble and S. Panda (eds.), Economics of Distance and Online Learning: Theory, Practice and Research. New York: Routledge, 211-232. Epstein, D. (2014). The Sports Gene: Inside the Science of Extraordinary Athletic Performance. New York: Current.
Friday, E., S.S. Friday-Stroud, A.L. Green and A.Y. Hill (2006), A Multi-Semester Comparison of Student Performance between
Multiple Traditional and Online Sections of Two Management Courses. Chicago: Institute for Behavioral and Applied
Management.
Gerlich, Nicholas R., Lavelle H. Mills and Marc Sollosy (2009), "An Evaluation of Predictors of Achievement on Selected Outcomes in a Self-Paced Online Course," Journal of Research in Higher Education, 4(1), 1-14.
Grandzol, J.R. (2004), “Teaching MBA Statistics Online: A Pedagogically Sound Process Approach,” Journal of Education for
Gurak, L.J. and A.H. Duin (2004), “The Impact of the Internet and Digital Technologies on Teaching and Research in Technical Communication,” Communication Quarterly, 13, 187-198.
Hair, J.E. Jr., R.E. Anderson, R.L. Tatham and W.C. Black (2012), Mutivariate Data Analysis. Upper Saddle River, NJ: Prentice Hall.
Hansen, David. E. (2008), “Knowledge Transfer in Online Learning Environments,” Journal of Marketing Education, 30(2), 93-102.
Hay, A., M. Hodgkinson, J.W. Peltier and W.A. Drago (2004), “Interaction and Virtual Learning,” Strategic Change, 13, 193-200.
Hodges, Charles B. (2008), "Self-Efficacy in the Context of Online Learning Environments: A Review of the Literature and Directions for Research," Performance Improvement Quarterly, 20 (3), pp. 7-25.
Inglis, A. (2008), Costs and Quality of Online Learning,” in in W.J. Bramble and S. Panda (eds.), Economics of Distance and
Online Learning: Theory, Practice and Research. New York: Routledge: 132-147.
Jung. I.S. (2003), “A Comparative Study on the Cost-Effectiveness of Three Approaches to ICT Teacher Training,” Journal of
Korean Association of Educational Information and Broadcasting, 9(2): 39-70.
Jung, I. (2008), “Costing Virtual University Education,” in W.J. Bramble and S. Panda (eds.), Economics of Distance and Online
Learning: Theory, Practice and Research. New York: Routledge: 148-161.
Krippendorff, Klaus (2012), Content Analysis: An Introduction to its Methodology. New York: Sage Publications Inc. Kumar, N., Scheer, L. and Steenkamp, J-B. (1995), “The Effects of Supplier Fairness on Vulnerable Buyers”, Journal of
Marketing Research, 32(1), 54-65.
Leasure, J., R. Davis, and P. Thievon (2000), “Comparison of Student Outcomes and Preferences in a Traditional versus Web-Based Baccalaureate Nursing Research Course,” Journal of Nursing Education, 39(4), 149-154.
Lehmann, D. R., and S. Srinivasan (2014), "Assessing Brand Equity Through Add-on Sales," Customer Needs and Solutions, 1(1), 68-76.
Loch, C., Sting, F., Huchzermeier, A. and Decker, C. (2012), “Finding Profits in Fairness,” Harvard Business Review, 90(4), 111-16.
Muir, A. (2005). Lean Six Sigma Statistics: Calculating Process Efficiencies in Transactional Projects. New York: McGraw-Hill. Oliver, R. and Swan, J. (1989), “Consumer Perceptions of Interpersonal Equity and Satisfaction in Transactions: A Field Survey
Approach,” Journal of Marketing, 53(2), 21-35.
Peltier, J.W., W. Drago, and J.A. Schibrowsky (2003), “Virtual Communities and the Assessment of Online Marketing Education,” Journal of Marketing Education, 25(3), 260-276.
Peltier, J.W., J.A. Schibrowsky and W. Drago (2007), “The Interdependence of the Factors Influencing the Perceived Quality of the Online Learning Experience: A Causal Model,” Journal of Marketing Education, 29(2), 140-153.
Priluck, R. (2004), “Web-Assisted Courses for Business Education: An Examination of Two Sections of Principles of Marketing,” Journal of Marketing Education, 26(2), 161-173.
Ponzurick, T.G., K. Russo-France, and C.M. Logan (2000), “Delivering Graduate Marketing Education: An Analysis of Face-to-Face versus Distance Education,” Journal of Marketing Education, 22(3), 180-187.
Porath, C., D. MacInnis and V. Folkes (2010), "Witnessing Incivility among Employees: Effects on Consumer Anger and Negative Inferences about Companies," Journal of Consumer Research, 37(2), 292-302.
Rosa, M. & Amaral, A. (2014). Quality Assurance in Higher Education: Contemporary Debates. New York: Palgrave. Rossiter, A.P. and B.P. Jones (2015). Energy Management and Efficiency for the Process Industries. New York: Wiley. Rovai, A.P., M.K. Ponton and J.D. Baker (2008), Distance Learning in Higher Education. New York: Teachers College Press. Rumble, G. (2009), The Costs and Economics of Open and Distance Learning. London: Kogan Press.
Russell, T.L. (1999), The No Significant Difference Phenomenon. Chapel Hill: Office of Instructional Telecommunications, North Carolina State University.
Samaha, S., Palmatier, R. Dant, R. (2011), “Poisoning Relationships: Perceived Unfairness in Channels of Distribution,” Journal
of Marketing, 75(3), 99-17.
Schreier, Margrit (2012), Qualitative Content Analysis in Practice. New York: Sage Publications.
Simonson, M., S. Smaldino (2014), Teaching and Learning at a Distance: Foundations of Distance Education. Boston: Pearson Education.
Spiggle, S. (1994), "Analysis and Interpretation of Qualitative Data in Consumer Research," Journal of Consumer Research, 21(3), 491-502.