1 | P a g e
EMBEDDING THE ROLE OF SENSOR NETWORK
TECHNOLOGY FOR SECURE AND PRECISE DATA
AGGREGATION AND COMMUNICATION FOR
GLOBAL AGRICULTURAL DEVELOPMENT
Kawser Mohiuddin
Research Scholar - Computer Science, OPJS University, Churu, Rajasthan – India.
ABSTRACT
The sensor network environmental sensing was done by a small or large quantity of labor force. They
retrieved data directly from the agri-fields or its related environment and submitted upward for processing by
consuming the whole days and nights. In this paper we have given a best solution to the outdoor
environmental sensing especially with a good focus on agriculture production. In various countries
agriculture is one of the main and strongest sources of economy and employment. We have presented the
utilization of wireless sensor nodes for sensing the outdoor environment. This system will keep an eye on the
every minute change in the given field including sudden rains, evaporation, humidity, sun light, water levels
and various other Gas reactions along with the crop development under the given area. We have used the end
to end sensor node technology deployed in the outdoor environment having capabilities of the thermal, solar
and Gas sensations. This paper reduces the labor force, enhances precise monitoring and thus enhances the
economy of the said sector in a smart way.
Keywords
: Sensor Networks, Environmental Sensing, Agri-Fields, Gas Reactions, Tree Topology,
Environment, Crop.
I. INTRODUCTION
Recent advances in wireless sensor network technology have made the technical conditions to make
multi-functional tiny sensor devices, which can be used to observe and to react according to physical phenomena of
their surrounding environment [1]. Wireless sensor nodes are low-power devices equipped with processor,
storage, a power supply, a transceiver, one or more sensors and, in some cases, with an actuator. Several
types of sensors can be attached to wireless sensor nodes, such as Gas, optical, thermal and biological. These
wireless sensor devices are small and they are cheaper than the regular sensor devices. They can
automatically organize themselves to form an ad-hoc multi hop network. Wireless sensor networks (WSNs),
may be comprised by hundreds or maybe thousands of ad-hoc sensor node devices, working together to
accomplish a common task. Self-organizing, self-optimizing and fault-tolerant are the main characteristics of
this type of network [2]. A Sensor Node detects things like temperature, sound, vibrations, pressure, motion,
38 | P a g e and civilian use such as industrial process monitoring and control, machine health monitoring, monitoring of
the environment, healthcare applications, home automation, and traffic control. Each node can have more
than one sensor and generally also has a radio transceiver or some other type of device used for wireless
communication, a small microcontroller, and an energy source (such as a battery). The prices, complexity,
and sizes of sensor nodes vary, a complex node the size of a shoe box could be a few hundred dollars and a
very small one that isn’t very complex could be pretty cheap. The price and size of these nodes depend on
energy, memory, computational speed, and bandwidth. Each sensor supports a multi-hop routing algorithm
where nodes function as forwarders, relaying data packets to a base station; this is known as a wireless as-hoc
network. Widespread networks of inexpensive wireless sensor devices offer a substantial opportunity to
monitor more accurately the surrounding physical phenomena’s when compared to traditional sensing methods [3]. Wireless sensor network has it own design and resource constrains [4]. Design constrains are
related with the purpose and the characteristics of the installation environment. The environment determines
the size of the network, the deployment method and the network topology. Resources constrains are imposed
by the limited amount of energy, small communication range, low throughput and reduced storage and
computing resources. Research efforts have been done to address the above constrains by introducing new
design methodologies and creating or improve existing protocols and applications [1,2]. Sensor nodes are the
elementary components of any WSN and they provide the following basic functionalities [1-2,7]:
1. Multi Variant Data Sensing.
2. Storage of the sensed data.
3. Data Processing & Analysis.
4. Sensing for Self.
5. Scheduling and execution of the programmed sensing tasks.
6. Node configuration in the network.
7. Environment Sensing.
8. Self Organization and Coordination.
9. Sleep & Awake Mode Processing.
10. Node Recognition and data exchange within own network.
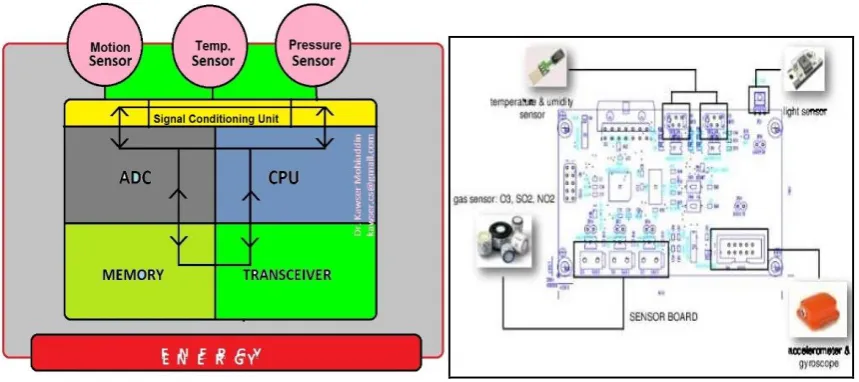
Sensor node is composed of one or more sensors having signal conditioning unit, an analog-to-digital
conversion module (ADC), a central processing unit (CPU), memory, a radio transceiver and an energy
power supply unit as shown in Fig. 1. Depending on the deployment environment, it can be necessary to
39 | P a g e
Figure 1: Hardware Layout and Motherboard Layout.
Applications of WSNs generally are used for some type of monitoring, tracking or controlling. More specific
applications would be things like habitat monitoring, tracking objects, detecting fires or landslides, and
monitoring traffic. Generally a WSN would be scattered in an area where its sensor nodes collect data. Area
monitoring would involve a WSN being put in an area where some occurrence is being monitored. An
example of this could be a country at war with another could place many nodes over a battlefield which
would then detect enemy intrusion. These sensors would detect heat, pressure, sound, light, electro-magnetic
fields, vibration, etc.), if a sensor were to go off it would be reported to a base station (a message could be
sent through things like the internet or satellite). Another form of area monitoring could be detecting vehicles
(motorcycles to train cars). Environmental monitoring is similar to area monitoring but is a little different
because generally the application of these sensors aren’t long lasting projects because of what is being
monitored. Usually environmental monitoring would be monitoring the state of permafrost in the Swiss Alps,
monitoring coastal erosion, or glacier monitoring. Greenhouse monitoring would involve monitoring the
temperature and humidity levels inside a green house. If the temperature and/or humidity drops the sensor
could notify the manager of the green house (through an email or text) or trigger misting systems, open vents,
turn on fans, or control a wide variety of system responses.
II. SYSTEM REQUIREMENTS AND ARCHITECTURE
The architecture of the proposed system has been made simple to create and implement in any environment
whether friendly or hostile. This system in addition to its purpose has ability to get deployed in various other
environments, but it has been especially designed and developed for the outdoor environment sensing with
respect to agricultural productions in any location or country. The requirements that adopting a WSN are
expected to satisfy in effective agricultural monitoring concern both system level issues (i.e., unattended
operation, maximum network lifetime, adaptability or even functionality and protocol self-configuration) and
40 | P a g e graphical user interfaces). The most relevant mainly concerns the supply of stand-alone operations. To this
end, the system must be able to run unattended for a long period, as nodes are expected to be deployed in
zones that are difficult to maintain. This calls for optimal energy management ensuring that the energy spent
is directly related to the amount of traffic handled and not to the overall working time. In fact, energy is
nevertheless a limited resource and the failure of a node may compromise WSN connectivity as the network
gets partitioned. Other issues to be addressed are the capabilities of quickly setting-up an end-to-end
communication infrastructure, supporting both synchronous and asynchronous queries, and of dynamically
reconfiguring it. An additional requirement is robust operative conditions, which need fault management
since a node may fail for several reasons. Other important properties are scalability and adaptability of the
network’s topology, in terms of the number of nodes and their density in unexpected events with a higher degree of responsiveness and reconfiguration abilities. This also has the development of a plug and play
sensor interface and the provisioning of remote connectivity. Figure 2 shows the design architecture of the
proposed model.
Figure 2: Architecture and Field Deployment
2.1. Sensor Requirements
In this paper we are providing a single solution to multiple issues. Typically a sensor node contains
single sensor for a particular purpose. We argue the use of multiple sensors integrated into a single
unit so that we can harness all the required results from a single node. We look into these separate
nodes for their makeup and working mechanism. The various kinds of sensor nodes for special use
in our work include the sensor nodes having capability to sense the light, heat, motion and various
41 | P a g e
2.1.1.
Motion Sensing Nodes
These are the wireless motes responsible for detection of every kind of motion in the monitoring field. This
will provide the live movements in the agri fields caused by human being, animals, birds or the winds. They
are helpful in relaying the physical movements across the agri fields covering the entire area. However there
are other various things that have no physical look and can’t be seen by human eye like Temperature,
Pressure, Gases in the fields etc. We have deployed separate kind of sensors in the field embedded and
integrated on a single board having a common battery backup and transmission exchange interfaces. The
wireless motion sensor works in a special manner by monitoring the given area, capturing the data and
transmitting the same to the server for further processing. These nodes have been designed and placed in a
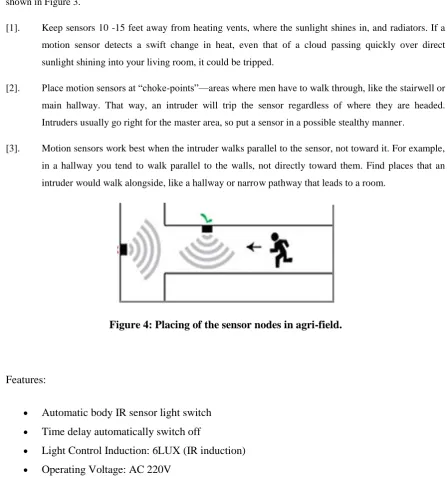
best manner to tackle every situation. Let’s have a look upon the layout deployment in the agri field also
shown in Figure 3.
[1]. Keep sensors 10 -15 feet away from heating vents, where the sunlight shines in, and radiators. If a
motion sensor detects a swift change in heat, even that of a cloud passing quickly over direct
sunlight shining into your living room, it could be tripped.
[2]. Place motion sensors at ―choke-points‖—areas where men have to walk through, like the stairwell or
main hallway. That way, an intruder will trip the sensor regardless of where they are headed.
Intruders usually go right for the master area, so put a sensor in a possible stealthy manner.
[3]. Motion sensors work best when the intruder walks parallel to the sensor, not toward it. For example,
in a hallway you tend to walk parallel to the walls, not directly toward them. Find places that an
intruder would walk alongside, like a hallway or narrow pathway that leads to a room.
Figure 4: Placing of the sensor nodes in agri-field.
Features:
Automatic body IR sensor light switch
Time delay automatically switch off
42 | P a g e
Detection Angle: 115 degrees
Delay Time: 40s
Sensor Probe Size: 23mm
Sensor Type: Light control.
Power: <200W (energy saving lamp), <500W (incandescent lamp)
Size (L x W x H): Approx. 6.4 x 3.8 x 2.8cm
All stainless steel construction
Zero & span adjustment
Wide operating Motion detection range
Outstanding performance & stability
Reverse polarity protection
Short circuit protection.
2.1.2 Temperature Sensing Nodes
These are the nodes having facility to sense and relay the prevailing temperature in the monitoring field
around the distance of 2 km for a particular node. We are introducing the use of ADAM-2000Z series. It
utilizes the IEEE 802.15.4 standard I/O and latest sensor technology whilst supporting 2.4GHz mesh
networking to provide the flexibility and build a cost-effective distributed monitoring system. The wireless
ADAM-2000Z series includes six modules, including a Modbus/RTU gateway, router node, and I/O and the
sensor devices listed below. The network topology can be Star / Tree / Mesh. The ADAM 2031Z is a wireless
Temperature Sensor with operating range -20 to 70degC and Humidity Sensor with operating range of
0-100%. To learn more about the ADAM-2000 series Video on ADAM-2000 series. It has a variety of features
for the proposed project:
Easy maintenance and field installation Low duty wireless communication Smart and simple indicator design 1 Temperature Sensor, 1 Humidity Sensor Outdoor range up to 200 m
Supports battery input with 2 x AA Alkaline batteries
Node Specifications:
LED Indicators Ext PWR, Error, Status, Level Index
Connectors 1 x plug-in terminal block (#14~22 AWG)
43 | P a g e Resolution Temp. Sensor: 0.02°C (0.04°F), Humidity Sensor: 0.15%RH
Operating Temp -20~70 °C (-4~158 °F)
Operating Humidity 20~95 %RH
Wireless IEEE Standard: 802.15.4
Frequency Bands ISM 2.4 GHz (2.4 GHz ~ 2.4835 GHz)
Transmit Power 3±1 dBm
Outdoor Range 100 m
Receiver Sensitivity -97 dBm
RF Data Rate 250 kbps
Power Input Unregulated 10~30 VDC Battery Input: 2xAA Alkaline 3 VDC
2.1.2.
Pressure Sensing Nodes
These nodes have a wide range of ability and applications. Pressure is caused by any of the factors depending
upon the saturation of any such substance in the monitoring fields. The excessive rains may increase the
water levels and pressure exerted by presence of the excess water will be relayed to the server for immediate
action. Sometimes the excessive presence of certain gases including smoke etc. may occur and will be also
reported to the base station server. The node used in the project must have contain the below features and
specifications to meet achieve the desired and quality results.
Features:
All stainless steel construction ±0.3% Combined error
Industrial standard 4 to 20 mA output Zero & span adjustment
Wide operating temperature range Integral O-ring seal
Outstanding performance & stability Reverse polarity protection
Short circuit protection
44 | P a g e Pressure Range: 0 to 1500 Bar
Burst Pressure: 2400 Bar
Output Span: 4 to 20 mA
Output Type: 2 wire
Zero Offset: ±1.0 % of full scale
Span Tolerance: ±1.0 % of full scale
Combined Error: ±0.3 % of full scale
Repeatability: ±0.1 % of full scale
Long Term Stability: ±0.2 % of full scale / 6 months
Supply Voltage: 13 to 36 VDC
Intrinsic Load: 3 µA/V
Load Driving Capacity: 1150 Ω @ 36 VDC
Load Resistance: ≤(Vs-13.0)/(0.02)
Insulation (Conn. to Case): 100 MΩ @ 100 VDC
Load Resistance: ≤(Vs-13.0)/(0.02)
Zero Adjustment: ±10.0 % of full scale
Span Adjustment: ±10.0 % of full scale
Pressure Media Material: SS316
Media Temperature: -20 to 85 °C
Ambient Temperature: -40 to 90 °C
Thermal Effect on Zero: ±0.04 % of full scale
Thermal Sensitivity: ±0.04 % of full scale
Mechanical Shock Tolerance: 15 g @ s (11 mS)
Vibration Tolerance: 10 g to 50 Hz
45 | P a g e Pressure Connection: ½‖ BSP Male
Electrical Connection: DIN Plug
Environmental Rating: IP65
Sensor Weight: 90 g
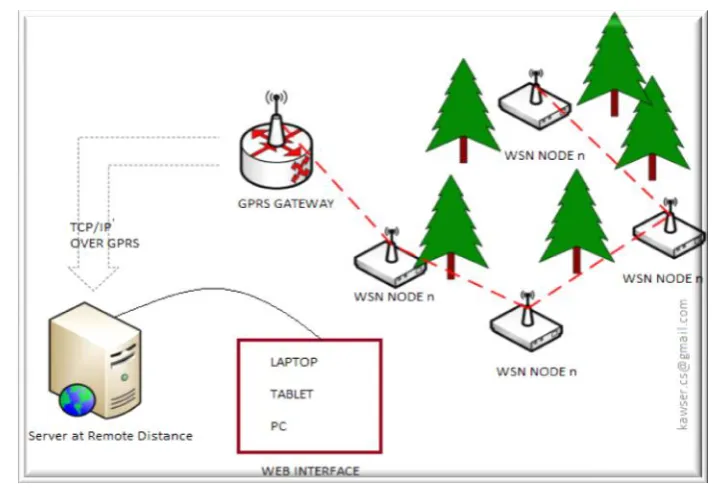
III. IMPLEMENTATION
A number of n Sensor Nodes are deployed in the agricultural field or forest etc. linked with each other
through a wireless connection. The inter-node distance has been fixed as 2 km. Every node is equipped with
sufficient hardware programming instructions to integrate the three sensing capabilities for onward
transmission to the gateway. The gateway is being operated on GPRS can establish a live session with the
remote server using TCP/ IP. The actual data acquisition is done with the help of sensor nodes and
transmitted via wireless links within its own network to the server. The remote server on the other side can be
accessed using any of the web interfaces i.e. laptop or any cellular devices etc. Each node in our sensor
network is configured first and mapped with the base station node and thus can only be accessible to its base
node to avoid any possible compromising of the nodes or its data exchange in the network. All the nodes have
been arranged in a tree topology fashion as per the agri field requirements. The agricultural area under our
project is a rectangular area having length of 20 km long and16 km wide. Figure 5 shows the node layout in
the said agri land with any array of 8 x 10 nodes. The total end node strength in the said project is 80. Besides
the 80 end nodes there are 2 cluster heads nodes and various other passive nodes on standby. The nodes are
having the best battery backup that can last for the minimum period of 10 days. The Figure 3 shows the node
deployment as per the area requirement. The given area is put under the tree topology of the sensor nodes.
There are 80 nodes divided into a matrix of 8 x 10 pattern ranging from A1 to H10. The horizontal lines are
denominated by 8 alphabets from A through H. The node number ranges from A1 to A10 for the first row up
to 8th row i.e. H1 to H10. In every row there are 10 nodes at the distance of 2 km each. The horizontal
distance of the area is 20 km and is thus divided into 10 sections having 10 sensor nodes deployed at the
distance of 2 km each. While as the vertical distance of the agri land is 16 km and contains 8 nodes at the
length of 2 km each. Every node will be responsible for its own area only from 0 km to 2 km. The TCP/ IP
layers in accordance with the system will work in a systematic fashion. The end nodes (n nodes) serve for
data acquisition purpose and provide physical interface for the system and the surrounding environment. On
the other server side there are other interfaces like laptop or PC that will produce output to the user.
Data captured by any of the sensors mounted on a single board is continuously transmitted to the base station/
server for user information and analysis. Motion sensors detect every movement caused by any agent
including human being, birds, animals or the blowing winds. The motion sensor gets immediately activated
on occurrence of every little movement and this information is transmitted upwards for processing at server
side. However at no motion from anywhere these sensors will relax and thus helping in the the extension of
46 | P a g e
Figure 5: n Node Layout and Deployment
Sensor = 1, Mode = 1, Acquisition = 1, Transmit = 1 /Data being transmitted/
Sensor = 0, Mode = 0, Acquisition = 0, Transmit = 0 /No data available/
Sensor = 1, Mode = 1, Acquisition = 0, Transmit = 1 /Empty packets transmitted/
Data to be acquired by sensor nodes is of various types and varying in nature. It can be motion detections,
temperature detections or pressure detection. All these detections can be positive or negative and are
accordingly transmitted to the server via GPRS gateway. The data received at the server side by users is
continuously being monitored and analyzed for every possible requirement. This model works smoothly
when executed properly as per the specifications and under the expert management.
IV. CHALLENGES FOR ENVIRONMENTAL SENSING
Environmental sensing with reference to the large area agricultural monitoring is slightly a difficult process.
A large number of issues need to be considered and taken well care of everything to achieve the desire and
satisfactory results. Following are various common challenges needed to be timely addressed and looked into
properly.
4.1
Power Management
This is essential for long-termoperation, especially when it is needed to sensing remote and hostile
environments. Harvesting schemes, cross-layer protocols and new power storage devices are presented as
possible solutions to increase the sensors lifetime.
4.2
Scalability
A wireless sensor network canaccommodate thousands nodes. Current real WSN for environment proposes
the use of tens to hundreds nodes. So it is necessary to prove that the available theoretical solutions are suited
47 | P a g e
2.3 Remote Management
Systems installed on isolatedlocations cannot be visited regularly, so a remote access standard protocol is
necessary to operate, to manage, to reprogramming and to configure the WSN, regardless of manufacturer.
2.4 Usability
The WSNs are to be deployed by users whobuy them off the shelf. So, the WSN need to become easier to
install, maintain and understand. It is necessary to propose new plug and play mechanisms and to develop
more software modules with more user-friendly interface.
2.5 Standardization
The IEEE 802.15.4 represents amilestone in standardization efforts. Although, compatibility between
of-the-shelf modules is in practice very low. It is important to specify standard interfaces to allow interoperability
between different modules vendors in order to reduce the costs and to increase the available options.
2.6 Size
Reducing the size is essential for manyapplications. Battery size and radio power requirements play
an important role in size reduction. The production of platforms compatible with the smart dust can
be determinant in WSN environmental sensing.
2.7 IP end-to-end connectivity
Originally it was notthought appropriate the use of IP protocol in WSN networks, because of the perception
that is was to heavy weight to the WSN nodes resources. Recently, the industry and the scientific community
start to rethink many misconceptions about the use of IP in all WSN nodes. Supporting IPv6 on sensor nodes
simplifies the task of connecting WSN devices to the Internet and creates the conditions to realize the
paradigm of Internet of Things community. Additionally, by using IPv6 based protocols, users can deploy
tools already developed for commissioning, configuring, managing and debugging these networks. The
application developing process is also simplified and open.
2.8
Support other transducers verities
Environmentalsensing usually uses limited type of transducers, such as temperature, light, humidity and
atmospheric pressure. New environmental sensing applications will be developed and new transducers will be
necessary to measure new physical phenomena, for example image and video. Transmit images and video on
resources and power constrained networks are a challenge.
V. CONCLUSION AND FUTURE WORK
In this paper we have developed a model for Sensor based Environment Sensing with respect to the
Agricultural Monitoring and Production. We used a variety of sensor nodes for different purposes embedded
48 | P a g e other movements caused by human being, birds, animals or the winds. On the other hand temperature sensors
continuously monitored the temperature and relayed to the server. The pressure sensors acquired the data
related to pressure caused by excessive or lesser presence of the water, pressure caused by excess or lack of
certain gases etc. This Model yielded best results thus helps in decreasing the manual labor force and
increasing the precision and quality agriculture. We argues that WSN technology must be much developed
and utilized in a much better way for the agricultural development in India or in any other countries.
REFERENCES
[1] IF. Akyildiz, W. Su, Y. Sankarasubramaniam, and E. Cayirci, ―Wireless sensor networks: a survey,‖
Computer Networks; vol. 30, issue 4, pp. 393–422, 2002.
[2] Brett Warneke, Matt Last, Brian Liebowitz, and Kristofer S. J. Pister. Smart Dust: Communicating
with a Cubic-Millimeter Computer. Computer, pages 44–51, January 2001.
[3] Christian Bettstetter. On the Minimum Node Degree and Connectivity of a Wireless Multihop
Network. In MOBIHOC’02. ACM, 2002.
[4] IEEE Std 802.15.4-2006. Part 15.4: wireless medium access control (MAC) and physical layer (PHY)
specifications for low-rate wireless personal area networks (LR-WPANs). IEEE Std 802.15.4-2006,
2006.
[5] Deborah Estrin, Ramesh Govindan, John Heidemann, and Satish Kumar. Next Century Challenges:
Scalable Coordination in Sensor Networks. In Proceedings of the 5th Annual ACM/IEEE International
Conference on Mobile Computing and Networking, pages 263–270. ACM Press, 1999.
[6] P. Baronti, P. Pillai, V. Chook, S. Chessa, A. Gotta, and Y. Hu, ―Wireless sensor networks: A survey
on the state of the art and the 802.15.4 and ZigBee standards,‖ Computer Communications, vol. 30,
issue 7, Wired/Wireless Internet Communications, pp. 1655-1695, May 2007.
[7] F Zhao, and L. Guibas, Wireless Se nsor Networks: An Informati on Processing Approach, Morgan
Kaufmann : San Francisc o, pp. 240–245, 2004.
[8] B. Chen, K. Jamieson, H. Balakrishnan and R. M orris, ―Span: a n energy efficient
coordinationalgorith m for topology maintenance in ad hoc wireless networks,‖ ACM Wireless
Networks Journal, vol. 8, issue 5, pp. 481–494, 2002.
[9] Y. Xu, J. Heidemann, and D. Estrin, ― Geography informed energy conservation for ad hoc routing,‖
Proceedings of the 7th In ternational Conference on M obile Computing and Networking (MobiCom
2001), Italy, July 2001, pp. 70 –84.
[10] J. Al-K araki, and A Kamal, "Rou ting techniques in wireless sensor networks: A survey", IEEE
Wireless Commun. Mag., vol. 11, no. 6, 2004, pp. 6-28.
[11] R. Szewczyk, A. Mainwaring, J. Polastre, and D. Culler. ―An analysis of a large scale habitat sensing
application,‖ In Proceedings of the Second ACM Conference on Embedded Networked Sensor
Systems (SenSys), Baltimore, November 2004.
[12] G. Tolle, J. Polastre, R. Szewczyk, D. Culle r, N. Turner, K. Tu, S. Burges s, T. Dawson, P. Buon-
49 | P a g e International Conference on Embedded Networked Senso r Systems (SE NSYS), ACM Press, San
Diego, CA, USA, pp. 51–63, Nov ember 2005.
[13] G. Werner-Allen, K. Lorincz, M. Welsh, O. Marcillo, J. Johnson, M. Ruiz, and J. Lees, "Deploying a
Wireless Sensor Network on an Active Volcano," IEEE Internet Computing, pp . 18-25, March /April,
2006.
[14] G. Barrenetxea, F. Ingelrest, G. Schaefer, M. Vetterli, O. Couach, & M. Parlange, ―SensorScope:
Out-of-the-Box Environmental Sensing, ‖ Proceedings of the 7th international conference on Inf.
processing in sensor networks, pp.332-343, Apr 22-24, 08.
[15] N. GershenfeldN, R. Krikorian, and D. Cohen, ―The Internet of Things,‖ Scientific American 2 004;
vol. 291, issue, pp. 76-81.
[16] J. Hui, and D. Culler, ―Extending IP to Low-Power, Wireless Personal Area Networks,‖ I EEE Internet
Computing 2008, vol. 12, issue 4, pp. 37-45.
[17] L. Zhou, N. X iong, L. Shu, A. Vasilakos and S.-S. Yeo, ―Context-Aware Multimedia Service in