R E S E A R C H
Open Access
Plant selection for ethnobotanical uses on
the Amalfi Coast (Southern Italy)
V. Savo
1,2*, R. Joy
1,3, G. Caneva
2and W. C. McClatchey
4Abstract
Background:Many ethnobotanical studies have investigated selection criteria for medicinal and non-medicinal plants. In this paper we test several statistical methods using different ethnobotanical datasets in order to 1) define to which extent the nature of the datasets can affect the interpretation of results; 2) determine if the selection for different plant uses is based on phylogeny, or other selection criteria.
Methods:We considered three different ethnobotanical datasets: two datasets of medicinal plants and a dataset of non-medicinal plants (handicraft production, domestic and agro-pastoral practices) and two floras of the Amalfi Coast. We performed residual analysis from linear regression, the binomial test and the Bayesian approach for calculating under-used and over-used plant families within ethnobotanical datasets. Percentages of agreement were calculated to compare the results of the analyses. We also analyzed the relationship between plant selection and phylogeny, chorology, life form and habitat using the chi-square test. Pearson’s residuals for each of the significant chi-square analyses were examined for investigating alternative hypotheses of plant selection criteria. Results:The three statistical analysis methods differed within the same dataset, and between different datasets and floras, but with some similarities. In the two medicinal datasets, only Lamiaceae was identified in both floras as an over-used family by all three statistical methods. All statistical methods in one flora agreed that Malvaceae was over-used and Poaceae under-used, but this was not found to be consistent with results of the second flora in which one statistical result was non-significant. All other families had some discrepancy in significance across methods, or floras. Significant over- or under-use was observed in only a minority of cases. The chi-square analyses were significant for phylogeny, life form and habitat. Pearson’s residuals indicated a non-random selection of woody species for non-medicinal uses and an under-use of plants of temperate forests for medicinal uses.
Conclusions:Our study showed that selection criteria for plant uses (including medicinal) are not always based on phylogeny. The comparison of different statistical methods (regression, binomial and Bayesian) under different conditions led to the conclusion that the most conservative results are obtained using regression analysis.
Keywords:Ethnobotany, Medicinal flora, Regression analysis, Pearson’s residuals
Background
Plants and humans are engaged in a dynamic relation-ship, where plants evolve creating biodiversity and humans develop strategies and solutions. In this rela-tionship, plants evolve secondary metabolites to protect themselves from being “used” and people find ways to use these metabolites to their advantage. Several aspects
of this relationship have puzzled researchers over the past decades, especially those regarding the reasons be-hind plant selection criteria used by different communi-ties around the world. In the ethnobotanical framework, theories have been expressed to explain possible mecha-nisms behind this selection (e.g., [1, 2]) and then know-ledge transmission [3–5].
One selection criterion that has been hypothesized is based on phylogeny. A non-random distribution of used medicinal plant species across families has been ob-served in several parts of the world (e.g., [6–10]). Plants within the same family, with close evolution ties, more * Correspondence:vsavo@sfu.ca
1
Hakai Institute, Simon Fraser University, 8888 University Drive, Burnaby, BC V5A 1S6, Canada
2
Department of Science, University Roma Tre, Viale Marconi 446, 00146 Rome, Italy
Full list of author information is available at the end of the article
likely share similar secondary compounds [11] which may have similar or equal medicinal properties (e.g., [12]) and this has been intuitively discovered by many traditional communities. Furthermore, plants that are evolutionarily closely related have generally more total uses than those that are evolutionarily isolated [13].
Besides theories that suggest selection criteria based on phylogeny, many others have been hypothesized. Sev-eral researchers have looked at possible alternative cri-teria used in selecting medicinal plants (e.g., [14–18]). These are for example based on taste and smell [12, 14, 17, 19–21] but also shape (e.g., [14]) or different/com-bined features (e.g., [16, 18, 22]). Another hypothesized criterion, which can apply to different plant uses, follows the ethnobotanical apparency theory, which states that plants that are more common and/or more available generally have a higher cultural importance than less ap-parent plants [1, 23, 24]. This selection criterion is based on the fact that some plants are more easily available or visible, not necessarily more useful [25].
Cultural factors might also be important in selecting plants [26–28]. Other researchers have hypothesized that the selection of medicinal plants could have been influ-enced by medical treatises of the past, especially in the Mediterranean area [3, 4, 29–32]. However, some selec-tion criteria must have been involved before these plant uses were firstly reported in written documents.
Different methods have been developed to validate these theories. Several statistical analysis methods may be used to analyze ethnobotanical data to highlight whether some taxa are more extensively used than others in a certain flora under the hypothesis that selec-tion criteria are based on phylogeny. In this paper we in-vestigate the use of three different statistical methods proposed to test whether a specific family is over or under-used in a certain area: residual analysis from lin-ear regression [15, 33], the binomial test [2], and a Bayesian approach [34, 35]. Other researchers used also an imprecise Dirichlet modeling [36]. Turi and Murch [37] tested the Native American Ethnobotanical Data-base [38] using four statistical methods (linear regres-sion, Bayesian, binomial and imprecise Dirichlet modeling). Kindscher et al. [39] analyzed three statistical methods (linear regression, Bayesian, and binomial) using a smaller dataset, focusing only on Native Ameri-can medicinal plants used within the state of Kansas. While these methods often give similar results, there are differences between them (see [37]) that have given rise to disagreements among researchers, and up to now, there has been no clear consensus about the use of one method over another. We perform these analyses con-sidering three different sets of ethnobotanical data for the same area (the Amalfi Coast, Southern Italy). We analyze selection criteria for medicinal plants but we
also test the methods using a set of non-medicinal plants (handicraft production, domestic and agro-pastoral prac-tices). However, the aim of this paper is not to define which statistical method is the best one, but to test if discrepancies in datasets, sample size, data collection and floras of reference could affect results in a way that has as large or larger an effect as the selection of the method itself.
This paper has two main objectives:
1) To distinguish whether differences in the selected datasets and analytic methods affect results and might, therefore, lead to different interpretations of plant selection criteria.
2) Test if the selection for traditional medicinal or non-medicinal plants is based on phylogeny, or is based on other selection criteria (chorology, life form, or habitat). We want to approach the analysis with an alternative hypothesis about selection of plants for use, and not just rely on a blind statistical method.
Research area
The Amalfi Coast is located in Southern Italy (Campa-nia) on the Southern side of the Sorrento Peninsula (Fig. 1). The area develops along the coast, but is typified by high mountains (up to 1400 m on the sea level) and steep slopes. These mountains belong to the Lattari chain, which constitutes an outcrop of carbonatic strati-fication, mainly composed by limestone, dolomitic lime-stone and Meso-Cenozoic dolomites [40].
The area has mainly a Mediterranean bioclimate (sensu [41, 42]), stretching into the Temperate biocli-mate in the uplands. Rainfall in the area is rather high considering other Tyrrhenian coastal areas of Southern Italy (e.g., [43–45]). The average annual rainfall amount along the coast sums up to 1300–1400 mm, and is higher in some valleys (1800 mm) [46].
declining as many terraces are being abandoned, while fewer are being cultivated with local crops and trad-itional techniques [59].
Methods
Three different sets of data were analyzed in this paper:
Dataset 1 (DTS1): Medicinal uses of plants in the 80-90ies (bibliographic source: [60,61]).
Dataset 2 (DTS2): Recent medicinal uses of plants (interviews between April 2007 and September 2009) (published data: [62]).
Dataset 3 (DTS3): Uses of plants for handicraft production, domestic and agro-pastoral practices
(interviews between April 2007 and September 2009) (original data).
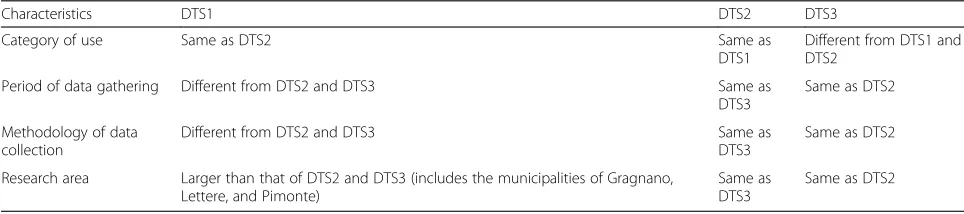
The three datasets share similarities and differences in category of use, period of gathering and methodology of data collection and research area (Table 1, Fig. 1). Data on plant uses listed in DTS1 and DTS2 were obtained from literature [60–62]. However, data for DTS2 were collected by the first author of this paper with the same methodology and during the same period of collection of the data of DTS3. Data of DTS3 were collected during field surveys through 214 random semi-structured inter-views with people who are or who have been living most of their lives in the area. Before starting interviews, in-formants were made aware of the scope of this study Longitude
Latitude
40 30 40 40 40 50 41 00
14 10 14 20 14 30 14 40
DTS1 only
DTS1, DTS2, and DTS3
Naples
Salerno
Gulf of Naples
Gulf of Salerno
Capri
Italy
10 15
38 42 46
Fig. 1The Amalfi Coast (Italy) with boundaries of the research areas (for DTS1, DTS2 and DTS3)
Table 1Differences and similarities in the three datasets (DTS1, DTS2, DTS3)
Characteristics DTS1 DTS2 DTS3
Category of use Same as DTS2 Same as
DTS1
Different from DTS1 and DTS2
Period of data gathering Different from DTS2 and DTS3 Same as
DTS3
Same as DTS2
Methodology of data collection
Different from DTS2 and DTS3 Same as
DTS3
Same as DTS2
Research area Larger than that of DTS2 and DTS3 (includes the municipalities of Gragnano, Lettere, and Pimonte)
Same as DTS3
and Prior Informed Consent [63] was requested verbally. Interviews were conducted following the ISE Code of Ethics [64]. Personal data on the informants (age, job, place of residence) and on uses of local plants (vernacu-lar name, place and period of gathering, how they use plants, part used, if they use fresh or dried plants, and if they use them with other plants, if the use is present or obsolete, etc.) were recorded. Plants quoted by infor-mants were collected and voucher specimens were de-posited at the Herbarium of the University Roma Tre (URT [65]). Plant species were identified following the “Flora d’Italia” [66] and their scientific names were up-dated [67–70].
The flora of the Amalfi Coast
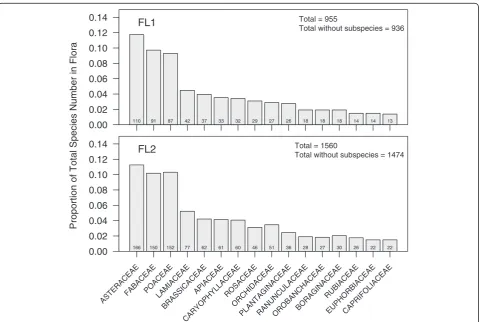
The recent flora (FL1) [48] of the whole area includes 955 taxa (936 species- some species have more than one subspecies) belonging to 108 families (Fig. 2). However, since the datasets (DTS1, DTS2, DTS3) are related to different time periods and plants can become locally ex-tinct, historical floras (e.g., [49–56]) were also consid-ered. The whole set of data is defined here as the historical flora (FL2) of the Amalfi Coast. The historical
flora (FL2) of the area includes 1560 taxa (1474 species) belonging to 116 families (Fig. 2). The majority of culti-vated plants are also included in this flora. All plant spe-cies names (FL1 and FL2) were updated [69, 70], checking for possible errors [subspecies that are not rec-ognized anymore, subspecies that are now considered different species, etc. (e.g., Arenaria leptoclados (Rchb.) Guss. and Arenaria serpyllifolia L. are now recognized as a unique species)]. Plant families follow APG III [71]. In this way all data were uniform as regards nomencla-ture and taxonomy.
The two floras (FL1, FL2) were characterized for their chorological and life spectra using information in Pignatti [66]) (Table 2). The percentages of specific life or chorological form vary (e.g., Phanerophytes constitute 13.5 % of FL1 and 11.9 % of FL2).
Preliminary analysis of data
Plants listed in the three datasets (DTS1, DTS2, DT3) were checked for their presence in the two floras (recent and historical) of the area (Table 3). This operation was important for comparing species/families in each dataset that were actually listed in the floras for the following
110 91 87 42 37 33 32 29 27 26 18 18 18 14 14 13
Total = 955
Total without subspecies = 936 FL1
0.00 0.02 0.04 0.06 0.08 0.10 0.12 0.14
166 150 152 77 62 61 60 46 51 36 28 27 30 26 22 22
Total = 1560
Total without subspecies = 1474 FL2
0.00 0.02 0.04 0.06 0.08 0.10 0.12 0.14
ASTERACEAEFABACEAE POACEAE
LAMIACEAE BRASSICACEAE
APIACEAE
CARYOPHYLLACEAE ROSACEAE
ORCHIDACEAE
PLANTAGINACEAERANUNCULACEAEOROBANCHACEAEBORAGINACEAE RUBIACEAE
EUPHORBIACEAECAPRIFOLIACEAE
Proportion of Total Species Number in Flora
Table 2Chorology, life form, habitat and taxonomical group (following [34,66]) of plants included in DTS1, DTS2, DTS3. Chorology, life form and taxonomical group distribution of FL1 and Fl2
Categories DTS1 DTS2 DTS3 FL1 FL2
Species tot 176 102 45 955 1560
Taxonomical group
Asterids 3 0 3 13 17
Campanulid/asterids2 29 18 3 173 274
Commelinids 5 2 3 108 199
Eudicots 6 1 0 25 44
Fabid/rosids1 11 3 1 39 61
Gymnosperms 4 0 0 5 15
Lamid/asterids1 46 23 7 162 256
Magnolids 1 1 1 3 5
Malvid/rosids2 29 22 5 156 252
Monocots 8 6 3 70 135
Pentapetalae 1 1 1 18 30
Pteridophytes 6 4 4 24 39
Rosids/n-fixing clade 27 21 14 158 234
Chorology
Endemic 0 2 3 32 60
Circumboreal 12 2 2 33 60
Mediterranean 61 40 20 436 654
European 8 1 2 53 142
Eurasian 30 10 8 170 291
Asian and Australian 16 12 3 8 23
American 10 6 2 22 35
African 2 2 0 4 10
Paleotemperate 9 2 1 52 81
Wide distribution 28 15 3 136 173
Naturalized 0 0 0 1 2
Cultivated 2 2 0 0 7
Life form
P (phanerophytes) 52 36 27 128 184
H (hemicryptophytes) 55 26 8 307 515
G (geophytes) 15 7 6 120 218
Ch (chamaephytes) 16 9 3 71 114
T (therophytes) 34 20 1 323 512
I (hydrophytes) 0 0 0 2 5
Habitat
Temperate woodland 25 7 9 x x
Maquis and garrigues 34 17 12 x x
Mediterranean woodland 24 9 10 x x
Arid environments 24 19 9 x x
Along rivers and humid sites 20 3 4 x x
Cultivated land 36 24 7 x x
statistical analyses [e.g., 21 species listed in DTS1 are not mentioned in the historical flora (FL2)].
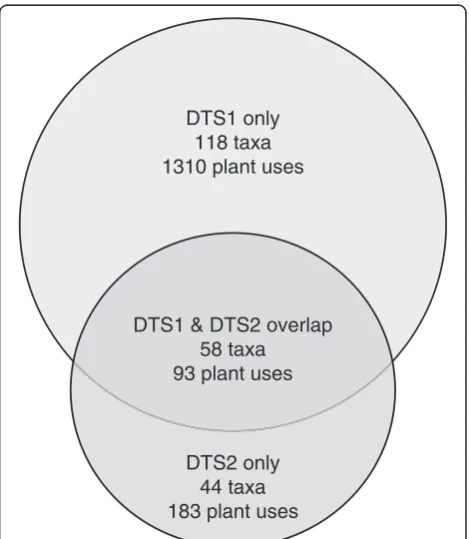
The medicinal floras share some similarities, but also several differences (both for species and plant uses). The medicinal flora of DTS1 includes 176 taxa (Table 3) be-longing to 63 families, while the medicinal flora of DTS2 includes 102 taxa (2 taxa are at genus level) belonging to 44 families. These two datasets are only partially over-lapping (Fig. 3).
The chorology, the life form and the habitat (according to Pignatti [66]) of all species (in DTS1, DTS2, DTS3) were recorded. The habitat of each species was reported in order to identify the habitats where it is possible to find more useful species as the same species may grow in more than one habitat. Places of gathering mentioned by informants were not considered since they were too generic, or not available.
The uses of plants for handicraft production, domestic and agro-pastoral practices in the Amalfi Coast were compared to other similar plant uses in Italian regions in order to seek points of convergence or divergence.
Statistical analysis
In order to test whether a specific family is over or under-used in the Amalfi Coast we applied three differ-ent statistical methods to the three datasets (DTS1, DTS2, DTS3). In doing these analyses, we had to con-sider that:
1) The number of taxa in each family is different whether we count the number of taxa by considering or ignoring subspecies (difference is especially remarkable for floras, FL1, FL2). 2) The relative number of taxa in each family is
different depending on how many taxa are listed in a given flora (Table3).
Under these two different conditions, it was possible to generate floras and datasets with different numbers of elements, and different combinations of datasets within the floras. We compared the differences between the dif-ferent datasets and floras but also compared results be-tween the different statistical methods. We analyzed the studentized residuals from a linear regression [33], we compared proportions via binomial tests [2] and we de-veloped confidence intervals around proportions using the Bayesian approach with a standard Uniform prior distribution [34]. We used the following data:
DTS1–DTS2–DTS3: total number of taxa in each family considering FL1 (subspecies were not
included).
DTS1–DTS2–DTS3: total number of taxa in each family that were effectively listed in FL2 (subspecies were included).
Using linear regression, the total number of selected speciesper family was regressed on the total number of Table 2Chorology, life form, habitat and taxonomical group (following [34,66]) of plants included in DTS1, DTS2, DTS3. Chorology, life form and taxonomical group distribution of FL1 and Fl2(Continued)
Maritime environments (dunes, alophilous rocks) 5 6 2 x x
Walls, rocks 25 21 5 x x
Table 3Number of species and families in the three datasets (DTS1, DTS2, DTS3) in relation to the different floras (FL1 and FL2)
Categories DTS1 DTS2 DTS3
Total taxa 176 102 45
Without subspecies 168 96 45
N° of families selected in FL1 63 44 28
N° of species selected in FL1 168 96 45
N° of families selected in FL2 61 52 27
N° of species selected in FL2 147 88 42
DTS1 only 118 taxa 1310 plant uses
DTS1 & DTS2 overlap 58 taxa 93 plant uses
DTS2 only 44 taxa 183 plant uses
species in the same family in the area. The hypothesis underlying this method is that the “regression analysis gave a number of species that might be utilized as medi-cines in each family if they were selected at random” [72]. The over or under-used families were identified when the studentized regression residuals of the fitted line laying in the extreme tails of the Student’s t-distribution. While in Moerman et al. [15] the raw resid-uals are used, we computed here studentized residresid-uals in order to compare them with the appropriate quantiles of the Student’s t distribution. Species with studentized re-sidual falling into the lower (or upper) 5 % tails of the appropriate Student’s t distribution were considered as under-used (or over-used).
The binomial test is based on the assumption that me-dicinal species are allocated within a family according to the proportion of medicinal species in the flora [2]. We tested if the proportion selected within a family was portionally more or less compared to the average pro-portion of the dataset. When the within-family proportion of selected species was statistically less (more) than the overall average proportion of the data-set, then the family was considered under-used (over-used).
The Bayesian approach is based on the assumption that the overall average proportion of selected plants in the flora is not observed without error; this being espe-cially relevant for small datasets [34]. Using an unin-formative Uniform (0,1) prior distribution, we compared the 95 % posterior credible interval of the average pro-portion selected in the overall dataset with the corre-sponding credible intervals for each family. If the credible interval for a family fell outside and left (right) of the credible interval for the overall dataset, the given family was considered under-used (over-used).
We then compared the percentage agreement among these three analyses. This allowed us to investigate the agreement among the results under different methods (linear regression, binomial or Bayesian) and under two different flora. The application of these methods is based on the assumption that the main factor that drives the selection of medicinal plant species is phylogeny (plants in the same family have closer relationships and will all be preferentially selected/avoided).
We investigated the effect of sample size on the ability to conduct a meaningful hypothesis test for over- and under-use. Our simulations were based on the datasets and floras identified in this paper, and showed whether a researcher would have the power to reject a null hypoth-esis for the observed sample sizes typical of ethnobotan-ical research studies. We identified the minimum number of taxa within a family that would be required to identify over-use and under-use given the three popu-lation proportions observed for FL1 and FL2.
We ran chi-square statistical analyses to test whether different selection criteria other than taxonomy may exist. Because a subset of cell counts were <5, we ad-justed our p-values using 2000 replicate Monte Carlo simulations. In this analysis, we considered the taxo-nomic group according to APG III, the chorological form, the life form, and the habitat of each species (ac-cording to Pignatti [66]) in datasets DTS1, DTS2, DTS3 (see Table 2). Data were organized in contingency tables where the counts of the use versus the explanatory vari-ables (taxonomic group, chorology, life form and habitat) were displayed. As contingency tables had dimensions greater than 2 × 2, we investigated the Pearson’s resid-uals for empirical evidence of departures from the null hypothesis of independence. All analyses were imple-mented using the software R [73].
Results
There were 45 plant species used for handicraft produc-tion, domestic and agro-pastoral practices on the Amalfi Coast, with 95 different plant uses. These plant uses are detailed in the Additional file 1 (selected plant part, spe-cific present or obsolete plant use, and the number of ci-tations are also provided). Moreover, in the Additional file 1 we also report the similarity of each specific plant use with uses in other Italian regions. Among these plant uses many (62 %) are shared with other Italian regions while a rather high percentage of plant uses (38 %) seem to be typical of the Amalfi Coast. For example,Spartium junceumL. is used to make brooms in Calabria, in other areas of Campania, Lucania, Marche, Sicily, Trentino and Tuscany, while Fraxinus ornus L. subsp. ornus is used to make handles of farmyard utensils (Abruzzi, other areas of Campania, Marche, Molise, Sardinia and Sicily). Some plant uses seem to be typical of the Amalfi Coast, such as the use ofThymelaea tartonraira(L.) All. to make brooms to brush courtyards or the use of Poly-stichum setiferum(Forssk.) Moore ex Woyn for covering lemon orchards.
repetitions across datasets). Many plants have a wide distribution (15 %) or a Eurasian areal (14 %). Consider-ing the historical flora (FL2), Mediterranean plants con-stitute the 42 % and the Eurasian species the 19 %; thus, percentages of the ethnobotanical flora partially reflect the chorological spectrum of the whole flora (FL2).
Statistical analysis
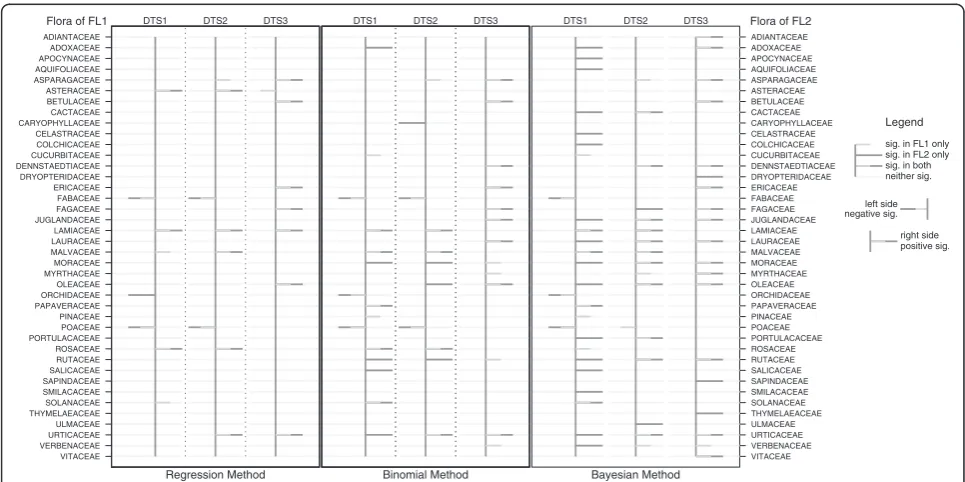
The comparison of the three statistical methods to the three datasets (DTS1, DTS2, DTS3), in relation to the two floras FL1 and FL2, is reported in Fig. 4 (see also Additional file 2). Using FL1 and the medicinal dataset DTS1, the over-used families in the three statistical methods are Lamiaceae, Malvaceae, Rosaceae, Solanaceae, while the under-used families are Fabaceae, and Poaceae. Using FL2 and DTS1, we found over-use only in just one family, Lamiaceae, and found under-use in three (Fabaceae and Poaceae as in FL1, but also found Orchidaceae was under-used). Using FL1 and medicinal dataset DTS2, the over-used families according to all three statistical methods are Asparagaceae, Lamiaceae, Malvaceae and Urticaceae, with just one under-used family (Poaceae). Using FL2 and DTS2, we found over-use in three of the same families (Lamiaceae, Malvaceae and Urticaceae), and no under-used families. In both FL1 and FL2, and dataset DTS3 we found 6 over-used families similarly across all three statistical methods (Aspar-agaceae, Betulaceae, Ericaceae, F(Aspar-agaceae, Oleaceae and Urticaceae) and no under-used families. In general, the floras FL1 and FL2 shared some agreement between
medicinal dataset families identified as neither under- nor over-used, and similarities between under- and over-used families (e.g., Lamiaceae was identified as over-used in FL1 and FL2, DTS1 and DTS2). Overall, we found more fam-ilies identified using DTS1 in FL1 (subspecies not included) compared to FL2 (subspecies included), and more non-medicinal dataset (DTS3) families identified in FL2 com-pared to FL1.
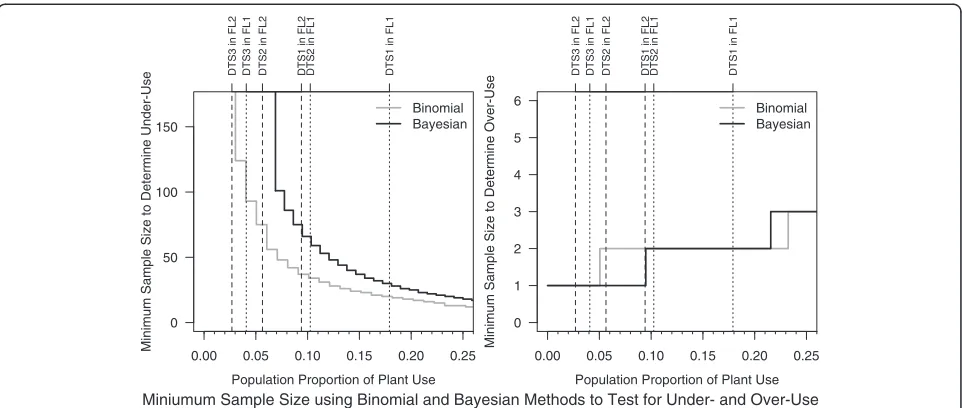
In Fig. 5, we show the results of a power analysis that compares the minimum sample size of taxa within a family that would be required to reject the null hypoth-esis in favor of concluding significant under- or over-use using the binomial and Bayesian methods. The power analysis for the residual analysis from a linear regression model was not included as it is not a test of proportional selection. The power analysis results in Fig. 5 show there is no power using the Bayesian method to detect under-use in DTS2, DTS3 for FL2, or DTS3 for FL1 (and we must conclude no families in these datasets are statisti-cally under-used). In general, the left panel shows that large sample sizes are required before the test is powered to statistically determine under-use, and shows the bino-mial approach is more powerful in determining under-use than the Bayesian method. For example, the right-hand-most vertical line shows the minimum sample size is 20 and 30 species within a family for the binomial and Bayesian methods to have sufficient number of species in them to have the statistical power to determine under-use. If we refer to the bottom panel of Fig. 2 we
see that 16 and 11 families (in the top panel) would have the power to determine under-use using the binomial and Bayesian methods. These tests require much smaller sample sizes to be powered to determine over-use (right-hand panel; Fig. 5), and this is the reason behind our statistical results finding more families that are over-used than under-over-used. This is accentuated for the Bayes-ian method between population proportions of .05, and .093 which requires only one species in the family for a valid test, while the binomial method requires two. This is important in our study as the Bayesian analysis is able to reject the null hypothesis if that one species within the family is “used” and conclude over-use, whereas the binomial requires two. For example, we found that no families could be identified as over-used using binomial tests for DTS1 or DTS2, FL1 or FL2, whereas there are many identified using the Bayesian method. For this rea-son, there are far more determinations of over-use using the Bayesian method compared to the binomial method (Fig. 6). It is worth noting that no method has enough power to identify under-use when the overall use is already small (e.g., DTS3).
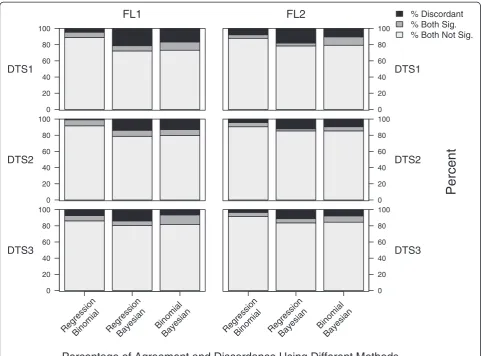
Figure 6 compares results between the two floras using the three statistical methods, and shows that there are differing conclusions from FL1 compared to FL2 (% dis-cordant). In addition, this figure shows that the Bayesian method is most discordant from the residual regression
analysis. This suggests again that the differences in data-sets as well as choice of statistical method would affect the results and interpretation of the families within a dataset and flora.
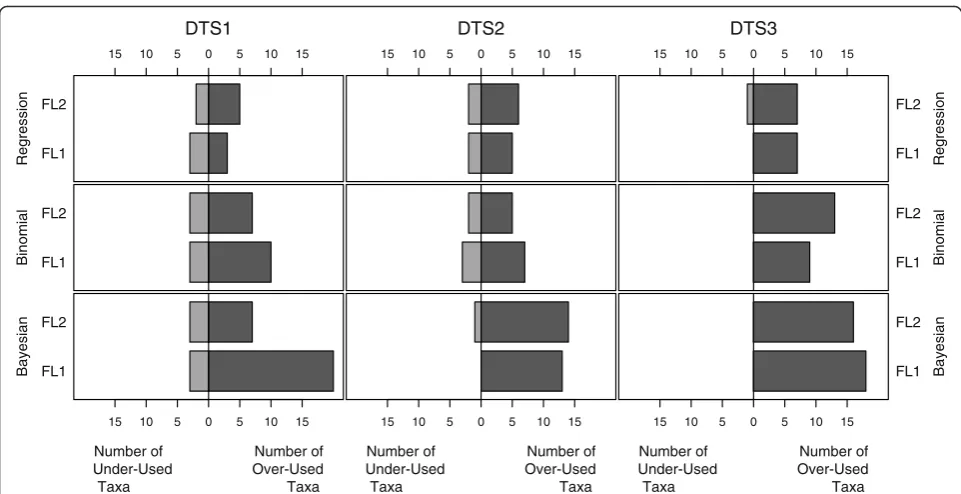
In Figs. 7 and 8, we show that for the datasets and floras of the Amalfi Coast, the Bayesian method identi-fies the highest number of over-used and under-used families, while linear regression identifies the lowest number (the “least common set of families” across the three methods).
The percentages of agreement (Figs. 6 and 7) among the different datasets and cases showed that:
– Results of statistical analyses are variable in relation to the combination of datasets, leading to different possible interpretations of data.
– In general the percentage of agreement is higher for FL1.
– As it is possible to observe in Fig.6, the best agreement is reached by the regression and binomial methods for DTS2 with FL1.
– The lowest percentage of agreement in relation to methods is between the regression and Bayesian approach, for DTS 1 in FL2.
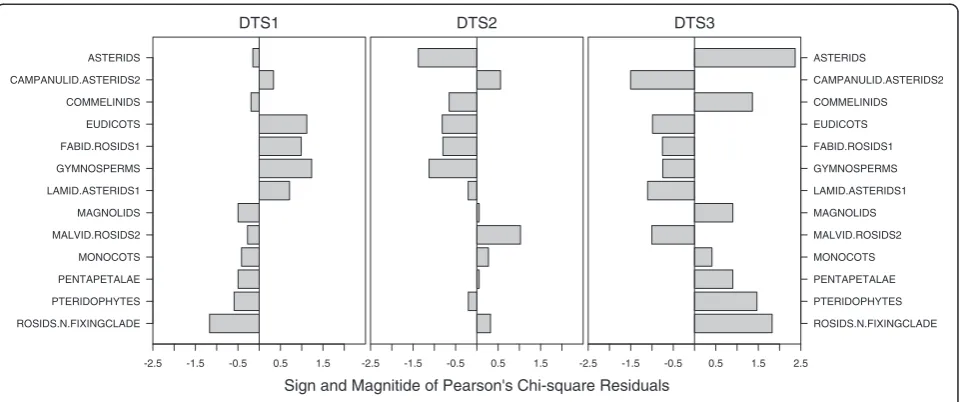
The chi-squared test of independence yields signifi-cance for phylogeny, life form and habitat but not for
0 50 100 150
0.00 0.05 0.10 0.15 0.20 0.25
Minimum Sample Size to Determine Under-Use
Population Proportion of Plant Use Binomial Bayesian
0 1 2 3 4 5 6
0.00 0.05 0.10 0.15 0.20 0.25 Binomial Bayesian
Minimum Sample Size to Determine Over-Use
Population Proportion of Plant Use Miniumum Sample Size using Binomial and Bayesian Methods to Test for Under- and Over-Use
chorology (p-value < 0.05). The Pearson’s residuals for phylogeny, life form and habitat are provided in Fig. 9, where the magnitude of the residual indicates a depart-ure from the expected count. For DTS3, these analyses showed a non-random selection for plants in the Aster-ids taxon, woody (Phanerophytes) or growing in Tem-perate woodlands. Medicinal plants are more commonly selected within Hemicryptophytes (DTS1) and Thero-phytes (DTS2), growing in riverine (DTS1) and rocky (DTS2) habitats.
Discussion
The number of plant uses in the Amalfi Coast is still high (in comparison to other Italian areas [74]) even if many are disappearing, and the cultural erosion is espe-cially evident for younger generations [62]. It seems also that medicinal uses of plants are changing: there are some differences between DTS1 and DTS2 but these
differences could be due also to the slightly different area of study and/or to the methods of data gathering.
Uses for handicraft production, domestic and agro-pastoral practices are various and some are reported also in other Italian areas. However, the lack of bibliography for several regions did not allowed us to define a clear pattern of diffusion of these uses, while this same ana-lysis was easier for medicinal plants (see Savo et al. [62]). However, it was possible to highlight that in regions where a plant grows and where there are more studies, it is very likely that this plant would be used for handi-craft production, domestic and agro-pastoral practices. This could mean that, at least for this category of use, plants might be chosen among the ones available, and then eventually for their intrinsic features (woody, flex-ible branches, smell, etc.). These features or “technical” qualities seem to be important on the Amalfi Coast, since many plants are gathered in the woodland, which is not always close to houses or fields.
0 20 40 60 80 100
DTS1
FL1
0 20 40 60 80 100
DTS1
FL2
0 20 40 60 80 100
DTS2
0 20 40 60 80 100
DTS2
0 20 40 60 80 100
DTS3
RegressionBinomial Regression Bayesian
Binomial Bayesian
0 20 40 60 80 100
DTS3
RegressionBinomial Regression Bayesian
Binomial Bayesian
% Discordant % Both Sig. % Both Not Sig.
Percent
Percentage of Agreement and Discordance Using Different Methods
Patterns in plant use depends on different factors and on the kind of available data
The use of a plant depends on different factors. In many cases, plants which are abundant are more likely to be used [75] but plant uses might also be affected by the history and culture of the local population and by the degree of isolation from, or connection with, other cul-tures [76]. In Italy, some plants are widespread and are used in similar ways in many regions [74]. However, the different ways in which people use plants are complex and dynamic and the understanding of these processes is still rudimentary [77]. Potentially, both ecological and cultural factors may affect the traditional use of a plant in a dynamic and unique process.
Several hypotheses and theories have been expressed to explain patterns in plant selection. These have been explored and tested using different methods of analysis over the last years. However, before it is possible to per-form these analyses, it is important to make some con-siderations on the data on which perform the tests. We found out that differences in floras affected our infer-ence about preferinfer-ence and avoidance in use of plant families. In this paper, we observed several additional (non-statistical) problems in analyzing data. In order to define if plants are preferentially selected or avoided it is necessary to have a complete flora of the area or to analyze ethnobotanical lists of plants excluding species that are not listed in the flora. However, in this last case, culturally important plants may not be considered in the analysis: an example is given by cultivated plants (which
0 20 40 60 80 100
DTS1
0 20 40 60 80 100
DTS2
0 20 40 60 80 100
DTS3
Regression Binomial Bayesian
% Discordant % Both Sig. % Both Not Sig.
Comparing FL1, FL2
Fig. 7Percentages of agreement and discordance using floras FL1 and FL2 among the results obtained using the three
statistical methods
Regression FL1 FL2
15 10 5 0 5 10 15
DTS1
15 10 5 0 5 10 15
DTS2
Re
g
ression
FL1 FL2
15 10 5 0 5 10 15
DTS3
Binomial FL1 FL2
Binomial
FL1 FL2
Bayesian FL1 FL2
15 10 5 0 5 10 15
Number of Under-Used
Taxa
Number of Over-Used Taxa
15 10 5 0 5 10 15
Number of Under-Used
Taxa
Number of Over-Used Taxa
Ba
y
esian
FL1 FL2
15 10 5 0 5 10 15
Number of Under-Used
Taxa
Number of Over-Used Taxa
are less in FL1 than FL2), that are not gathered in the wild, or by plants used by migrants, that are imported as dried preparations. Considering a recent flora or a complete flora (including historical data) for the analysis of data can change the results, since the two floras differ by more than 500 taxa (some plants have gone extinct, some plants have been introduced, etc.). Even the inclu-sion or the excluinclu-sion of subspecies led to differences of 85 taxa and 17 taxa in the historical (FL2) and in the re-cent flora (FL1) respectively. Moreover, the updating of the recent flora (FL1) to the very recent nomenclature has led to the elimination of 11 taxa (the flora originally had 966 taxa). This suggests that if the results and per-formances of the different methods vary depending on the kind of data available, the best method is dependent on the best available data that matches the study objectives.
The number of plant families in each dataset is differ-ent as well as the number of plant families in the floras (FL1 and FL2). These differences are due to different background factors, which are generally independent from the choices of researchers. However, these differ-ences lead to different results (and interpretations) when looking for over-used or under-used families in a certain flora, and in many cases it can be particularly difficult due to lack of statistical power to determine under-use when there are limited number of taxa within a plant family.
In some cases, plants have uses tied to traditions, reli-gion and ancient cultural practices. For example, the use ofPrunus aviumfor pieces of furniture for brides, or the use of Myrtus communis branches to decorate wreaths of flowers. In Morocco these wreaths of flowers and Myrtus are placed on graves, while they are generically used in churches in Greece [78]. This plant seems to be
related to religious uses in many countries even if it is not always specified how. Some plant uses are very an-cient, since their scientific name is related to their use. For example the use of Spartium junceum (the name Spartiumcomes from the Greek Σπαρτον= rope) for its fibers: Phoenicians, Romans, and Greeks in fact used them to make sails [79]. Also the word Ampelodesmos originates from two old Greek cognales àmpelos (vine) and desmòs(tie) [80] and in Southern Italy it is widely used for tying plants to stakes [74].
Statistical analysis
Our first objective was to test to whether differences in the selected datasets and analytic methods affected the interpretation of results. In a statistical sense, the “best”analysis is the one that either makes or violates the fewest statistical assumptions, while best from an anthropological perspective is the one that gives more consistent results. The analysis of three datasets (DTS1, DTS2, DTS3) and two floras using the three different statistical methods (linear regression residual analysis, binomial and Bayesian) gave different results for under-used or over-used families (Fig. 8). If the in-put data to the tests are the same, then these differ-ences can be attributed to differdiffer-ences in tests and/or differences in the power of the tests. Without forcing the intercept of the linear regression through zero, the standardized residuals of the linear regression is test-ing a different hypothesis than the binomial and Bayesian approaches. Differences in determining under- and over-use in the same datasets and flora be-tween the binomial and Bayesian approaches were merely a result of statistical power.
Differences between datasets and floras affected results for the Asteraceae family (and other families) but not for
the families of Lamiaceae and mostly Malvaceae (with a single exception). This is rather interesting since the ex-tensive use of Asteraceae and Lamiaceae as medicinal plants is reported in several ethnobotanical studies (e.g., [81, 82]). Asteraceae species are also commonly con-sumed as food plants [83] and this could affect their se-lection and potential use as medicinal plants. Differences may be generated by an evolution of plant uses, the period and method of gathering of data and/or to the flora of reference. The use of different floras (including subspecies or not) is not irrelevant for an ethnobotanical discussion, in the light of ethno-classification of species (e.g., in the case of over-differentiation [84]). Datasets were also analyzed including or excluding species that are not listed in the floras (FL1 or FL2): species could have been not well determined or taxonomy could have changed the classification (especially important if analyz-ing old floras, as for example in Dal Cero et al. [32]). Species that are not listed in the flora could also have been purchased or are only cultivated. The number of these species may be relevant when analyzing, for example, ethno-floras of migrant communities [85]. In general, the regression method is the least sensitive method, but over these different conditions (changing flora datasets) gave less variable results. On the other hand, binomial or Bayesian methods gave more variable results, but they could be used depending on your interest in over vs under-use as the Bayesian method is more sensitive to over-use, and the binomial method is more sensitive to under-use.
Our second aim was to test if the selection of plants for medicine or handicraft production, domestic and agro-pastoral practices is based on phylogeny, or other criteria (chorology, life form and habitat). In our case study, plants seem to be selected for more than one reason. There is a preference for woody plants (Phan-erophytes) for handicraft production, domestic and agro-pastoral practices, which could be expected (many plants are used to build tools and instruments). Regarding medicinal plants, there is also a slight pref-erence for herbaceous plants (Hemicryptophytes and Therophytes). This could be explained by the fact that many medicinal plants are weeds. Herbs and weeds tend to have a high content in secondary compounds since they are evident and appetizing for plant eating animals [86]. De Almeida et al. [87] hypothesize that annual plants should contain more secondary com-pounds than perennial plants, so the majority of medi-cinal plants should be annual, but in their study as well as in ours, this combination (annual-medicinal) is not strikingly significant. Herbaceous plants and weeds could also be selected for their availability and proximity, indeed, the riverine and rocky habitats in the area are in close proximity to the hamlets.
Conclusions
The understanding of the reasons that drive people to select plants in a certain area is still rudimentary. Our study shows that selection criteria for plants (including medicinal plants) could not be limited to phylogeny, and it is likely that plants are selected for multiple different reasons. Finally, the comparison of different statistical methods (regression, binomial and Bayesian) under dif-ferent conditions (difdif-ferent floras) led to the conclusion that the selection of the method is dependent on the best available data and the aims of the study. There are several differences in over-used families using the differ-ent methods, and this could lead to conflicting conclu-sions about plant selection criteria in a given area.
Developing insights about the complexity of cultural evolution and factors that drive changes is central to un-derstanding the human experience and roles of environ-mental opportunities and constraints that are presented by plants. This work contributes to emerging theory about human interactions with plants specifically by helping researchers to focus their efforts and thought-fully match analytical methods with results. We hope to see publications that show that researchers have consid-ered the methods of analysis before collecting their data rather than fishing for analytical methods after collecting data.
Additional files
Additional file 1:Species (and their plant parts), with vernacular names, currently or previously used for handicraft production, domestic and agro-pastoral practices (with details on their specific uses), the related number of citations and the eventual similarities with uses recorded in other Italian regions.Species are listed in alphabetical order (of the family).
Additional file 2:Linear regression, Binomial method and Bayesian approach applied to the three datasets (DTS1-3) in relation to FL1 and FL2 showing all the families.A darker line the right indicates significant over-use of the plant family, while a darker line to the left indicates significant under-use. When both flora indicate similar results, the darker lines of each flora overlap with the line representing FL2 longer than that of FL1.
Competing interests
The authors declare that they have no competing interests.
Authors’contributions
VS collected the field data, conceived the study, participated in the analysis of data and wrote the paper. RJ performed all the statistical analyses, and contributed substantially to the manuscript. GC contributed to and critically revised the paper, WCM largely contributed to and critically revised the paper. All authors read and approved the final manuscript.
Acknowledgements
Orientale, Italy) for the first statistical analyses and inputs in the drafting of the paper.
Author details
1Hakai Institute, Simon Fraser University, 8888 University Drive, Burnaby, BC
V5A 1S6, Canada.2Department of Science, University Roma Tre, Viale Marconi 446, 00146 Rome, Italy.3Department of Statistics and Actuarial Science,
Simon Fraser University, 8888 University Drive, Burnaby, BC V5A 1S6, Canada.
4Botanical Research Institute of Texas, 1700 N. University Drive, Fort Worth,
TX 76107-3400, USA.
Received: 20 January 2015 Accepted: 22 May 2015
References
1. Albuquerque UP, de Lucena RFP. Can apparency affect the use of plants by local people in tropical forest? Interciencia. 2005;30:506–11.
2. Bennett BC, Husby CE. Patterns of medicinal plant use: an examination of the Ecuadorian Shuar medicinal flora using contingency table and binomial analysis. J Ethnopharmacol. 2008;116:422–30.
3. Leonti M, Casu L, Sanna F, Bonsignore L. A comparison of medicinal plant use in Sardinia and Sicily–De Materia Medica revisited? J Ethnopharmacol. 2009;121:255–67.
4. Leonti M, Cabras S, Weckerle CS, Solinas MN, Casu L. The causal dependence of present plant knowledge on herbals—contemporary medicinal plant use in Campania (Italy) compared to Matthioli (1568). J Ethnopharmacol. 2010;13:379–91.
5. Leonti M. The future is written: Impact of scripts on the cognition, selection, knowledge and transmission of medicinal plant use and its implications for ethnobotany and ethnopharmacology. J Ethnopharmacol. 2011;134:542–55. 6. Moerman DE. An analysis of the food plants and drug plants of native
North America. J Ethnopharmacol. 1996;52:1–22.
7. Leonti MS, Ramirez R, Sticher O, Heinrich M. Medicinal flora of the Popoluca, Mexico: a botanical systematical perspective. Econ Bot. 2003;57:218–30. 8. Moerman DE, Estabrook GF. Native Americans’choice of species for
medicinal use is dependent on plant family: confirmation with meta-significance analysis. J Ethnopharmacol. 2003;87:51–9.
9. Ladio A, Lozada M, Weigandt M. Comparison of traditional wild plant knowledge between aboriginal communities inhabiting arid and forest environments in Patagonia, Argentina. J Arid Environ. 2007;69:695–715. 10. Adams M, Chammartin M, Hamburger M, Potterat O. Case Study of the
Swiss Flora for Prior Phytochemical and Biological Investigations. J Nat Prod. 2013;76:209–15.
11. Judd WS, Campbell CS, Kellogg EA, Stevens PF, Donoghue MJ. Plant Systematics: A Phylogenetic Approach. 3rd ed. Sunderland, MA: Sinauer Association; 2007.
12. Molares S, Ladio A. Chemosensory perception and medicinal plants for digestive ailments in a Mapuche community in NW Patagonia, Argentina. J Ethnopharmacol. 2009;123:397–406.
13. Yessoufou K, Daru BH, Muasya AM. Phylogenetic exploration of commonly used medicinal plants in South Africa. Mol Ecol Resour. 2015;15:405–13. 14. Ankli A, Sticher O, Heinrich M. Yucatec Mayan medicinal plants vs non-medicinal plants: Indigenous characterization and selection. Hum Ecol. 1999;27:557–80.
15. Moerman DE, Pemberton RW, Kiefer D, Berlin B. A comparative analysis of five medicinal floras. J Ethnobiol. 1999;19:49–67.
16. Stepp JR, Moerman DE. The importance of weeds in ethnopharmacology. J Ethnopharmacol. 2001;75:19–23.
17. Leonti M, Sticher O, Heinrich M. Medicinal plants of the Popoluca, Mexico: organoleptic properties as indigenous selection criteria. J Ethnopharmacol. 2002;81:307–15.
18. Stepp JR. The role of weeds as sources of pharmaceuticals. J Ethnopharmacol. 2004;92:163–6.
19. Brett J. Medicinal plant selection criteria: The cultural interpretation of chemical senses. J Appl Bot. 1998;72:70–4.
20. Heinrich M. Indigenous concepts of medicinal plants in Oaxaca, Mexico: Lowland Mixe plant classification based on organoleptic characteristics. J Appl Bot. 1998;72:75–81.
21. Brett J, Heinrich M. Culture perception and the environment. J Appl Bot. 1998;72:67–9.
22. Foster GM. Hippocrates’Latin American Legacy Humoral Medicine in the New World. Langhorne: Gordon and Breach Science Publisher; 1994.
23. Phillips O, Gentry A. The useful plants of Tambopata, Peru: I Statistical hypotheses tests with a new quantitative technique. Econ Bot. 1993;47:15–32.
24. Phillips O, Gentry A. The useful plants of Tambopata, Peru: II Additional hypothesis testing in quantitative ethnobotany. Econ Bot. 1993;47:33–43. 25. De Lucena R, Araújo E, De Albuquerque UP. Does the local availability of woody Caatinga plants (Northeastern Brazil) explain their use value? Econ Bot. 2007;61:347–61.
26. Amorozo MCM. Pluralistic medical settings and medicinal plant use in rural communities, Mato Grosso, Brazil. J Ethnobiol. 2004;24:139–61.
27. Vandebroek I, Calewaert J, De Jonckheere S, Sanca S, Semo L, Van Damme P, et al. Use of medicinal plants and pharmaceuticals by indigenous communities in the Bolivian Andes and Amazon. Bull World Health Organ. 2004;82:243–50.
28. Mollik MAH, Hossan MS, Paul AK, Taufiq-Ur-Rahman M, Jahan R, Rahmatullah M. A Comparative Analysis of Medicinal Plants Used by Folk Medicinal Healers in Three Districts of Bangladesh and Inquiry as to Mode of Selection of Medicinal Plants. Ethnobotany Res Applications. 2010;8:195–218.
29. Di Nola AM. La medicina popolare: questioni di metodo. La Ricerca Folklorica. 1983;8:7–12.
30. Paul HW. People’s Stories: Wine in Popular Medicine. Bacchic Medicine. Amsterdam, New York: Clio Medica Rodopi; 2001.
31. De Natale A, Pezzatti GB, Pollio A. Extending the temporal context of ethnobotanical databases: the case study of the Campania region (southern Italy). J Ethnobiol Ethnomed. 2009;5:7.
32. Dal Cero M, Saller R, Weckerle CS. The use of the local flora in Switzerland: A comparison of past and recent medicinal plant knowledge. J Ethnopharmacol. 2014;151:253–64.
33. Moerman DE. Symbols and selectivity: a statistical analysis of native American medical ethnobotany. J Ethnopharmacol. 1979;1:111–9. 34. Weckerle CS, Cabras S, Castellanos ME, Leonti M. Quantitative methods in
ethnobotany and ethnopharmacology: Considering the overall flora—Hypothesis testing for over- and underused plant families with the Bayesian approach. J Ethnopharmacol. 2011;137:837–43.
35. Medeiros PMD, Ladio AH, Santos AMM, Albuquerque UPD. Does the selection of medicinal plants by Brazilian local populations suffer taxonomic influence? J Ethnopharmacol. 2013;146:842–52.
36. Weckerle CS, Cabras S, Castellanos ME, Leonti M. An imprecise probability approach for the detection of over and underused taxonomic groups with the Campania (Italy) and the Sierra Popoluca (Mexico) medicinal flora. J Ethnopharmacol. 2012;142:259–64.
37. Turi CE, Murch SJ. Spiritual and Ceremonial Plants in North America: An Assessment of Moerman’s Ethnobotanical Database Comparing Residual, Binomial, Bayesian and Imprecise Dirichlet Model (IDM) Analysis. J Ethnopharmacol. 2013;148:386–94.
38. Moerman DE. Native American Ethnobotany. Portland, Oregon: Timber Press; 2009.
39. Kindscher K, Corbett S, McClure K. A Statistical Analysis of Medicinal Plants: A Case Study of Plant Families in Kansas and the Great Plains. Trans Kans Acad Sci. 2013;116:149–55.
40. De Castro P. Il Giura-Lias dei Monti Lattari e dei rilievi ad Ovest della Valle dell’Irno e della Piana di Montoro. Bollettino della Società dei Naturalisti in Napoli. 1962;LXXI:3–34.
41. Rivas Martinez S, Loidi Arregui J. Bioclimatology of the Iberian peninsula. Itinera Geobotanica. 1999;13:41–7.
42. Rivas Martinez S, Diaz TE, Fernandez-Gonzalez F, Izco J, Loidi J, Lousa M, et al. Vascular Plant Communities of Spain and Portugal Addenda to the Syntaxonomical Checklist of 2001. Itinera Geobotanica. 2002;15:5–922. 43. Drago A. Climatological Atlas of Sicily, Second Edition. Rivista Italiana di
Agrometeorologia. 2005;2:67–83.
44. Buttafuoco G, Caloiero T, Coscarelli R: Variabilità spaziale e persistenza temporale delle precipitazioni medie annue in Calabria. In: AA.VV, editors. XXX Convegno di Idraulica e Costruzioni idrauliche: 10–15 September 2006. Rome: Gruppo Italiano di Idraulica; 2006. p.1–12.
45. Blasi C, Chirici G, Corona P, Marchetti M, Maselli F, Puletti N. Spazializzazione di dati climatici a livello nazionale tramite modelli regressivi localizzati. Forest@. 2007;4:213–9.
47. Cancellieri L, Cutini M, Caneva G, Grilli R, Savo V, Zivkovic L. Lineamenti sulla vegetazione della Costa d’Amalfi. In: Caneva G, Cancellieri L, editors. Il paesaggio vegetale della Costa d’Amalfi. Rome: Gangemi Ed; 2007. p. 87–143.
48. Salerno G, Cancellieri L, Ceschin S, Lucchese F, Caneva G. La flora e le emergenze floristiche. In: Caneva G, Cancellieri L, editors. Il paesaggio vegetale della Costa d’Amalfi. Rome: Gangemi Ed; 2007. p. 35–84. 49. Casale V, Gussone G. Rapporto fatto al Signor Prof Michele Tenore, Direttore
del Real Giardino ec delle peregrinazioni Botaniche eseguite nel distretto di Castellammare, ed in quello di Avellino da’Dottori Vincenzo Casale e Giovanni Gussone Corrispondenti del Real Giardino delle piante per le provincie di Napoli e di Principato ulteriore. Giornale Enciclopedico di Napoli 1811, AV 1: 305–334.
50. Tenore M: Flora Napolitana 1–5.Naples: Stamperia Reale, Napoli Tipografia del Giornale Enciclopedico, Stamperia Francese; 1811–1836.
51. Tenore M: Flora medica universale e flora particolare della provincia di Napoli. In Corso delle Botanche Lezioni Tipografia del Giornale Enciclopedico. Edited by Tenore M. Naples: 1823.
52. Tenore M. Sylloge plantarium vascularium Florae Napolitanae hucaque detectarum. Naples: Ex Typografia Fibreni; 1835. p. 1831–42.
53. Pasquale GA, Pedicino NA, Terraciano N. Catalogo delle piante raccolte per i dintorni di Salerno, Amalfi ed Eboli. Naples: Annali dell’Accademia degli Aspiranti naturalisti di Napoli; 1864.
54. Guadagno M. La vegetazione della Penisola Sorrentina (Parte I, II, III). Bullettino dell’Orto Botanico di Napoli. 1918;5:133–78.
55. Massalongo C. Piante provenienti da Amalfi e dintorni e da altri siti della Penisola Sorrentina. Bollettino Madonna di Verona. 1920;14:1–31. 56. Caputo G, La Valva V, Nazzaro R, Ricciardi M. La flora della Penisola
Sorrentina (Campania). Delpinoa. 1989;31–32:3–97.
57. Cerasuoli F. Scrutazioni storiche, archeologiche, topografiche sulla città di Maiori. Salerno: Tipografia di R. Migliaccio; 1865.
58. Caneva G, Cancellieri L, Zivkovic L, Grilli R, Lombardozzi V, Salerno G. Il paesaggio naturale ed il paesaggio culturale. In: Caneva G, Cancellieri L, editors. Il paesaggio vegetale della Costa d’Amalfi. Rome: Gangemi Ed; 2007. p. 147–92.
59. Savo V, Caneva G, Salvati L, McClatchey WC, Reedy D. Combining environmental factors and agriculturalists’observations of environmental changes in the terrace system of the Amalfi Coast (Southern Italy). AMBIO. 2014;43:297–310.
60. De Feo V, Aquino R, Menghini A, Ramundo E, Senatore F. Traditional phytotherapy in the Peninsula Sorrentina, Campania, Southern Italy. J Ethnopharmacol. 1992;36:113–25.
61. De Feo V, Senatore F. Medicinal plants and phytotherapy in the Amalfitan Coast, Campania, Southern Italy. J Ethnopharmacol. 1993;39:39–51. 62. Savo V, Caneva G, Guarrera PM, Reedy D. Folk phytotherapy of the Amalfi
Coast (Campania, Southern Italy). J Ethnopharmacol. 2011;135:376–92. 63. Rosenthal JP. Politics, culture, and governance in the development of prior
informed consent in indigenous communities. Curr Anthropol. 2006;47:119–42. 64. ISE. ISE Code of Ethics. 2006. http://ethnobiology.net/code-of-ethics/. 65. Thiers B (2014).Index Herbariorum: A global directory of public herbaria and
associated staff New York Botanical Garden’s Virtual Herbarium. http:// sweetgum.nybg.org/ih/.
66. Pignatti S. Flora d’Italia, vol I-III. Bologna: Edagricole; 2003.
67. Conti F, Abbate G, Alessandrini A, Blasi C:An Annotated Checklist of Italian Flora.Rome: Ministero dell’Ambiente e della Tutela del Territorio, Dip di Biologia vegetale Università di Roma“La Sapienza”, Palombi Ed; 2005. 68. Conti F, Alessandrini A, Bacchetta G, Banfi E, Barberis G, Bartolucci F, et al.
Integrazioni alla Checklist della flora vascolare italiana. Natura Vicentina. 2007;10:5–74.
69. ThePlantList. A working list of all plant species [www.theplantlist.org]. 70. TROPICOS. Missouri Botanical Garden [http://www.tropicos.org/]. 71. Stevens PF (2001). Angiosperm Phylogeny Website. Version 9, June 2008
(and more or less continuously updated since) http://www.mobot.org/ MOBOT/research/APweb/.
72. Moerman DE. Commentary: Regression residual vs Bayesian analysis of medicinal floras. J Ethnopharmacol. 2012;139:693–4.
73. R Development Core Team. R: A Language and Environment for Statistical Computing. Vienna: R Foundation for Statistical Computing; 2010. 74. Guarrera PM. Usi e Tradizioni della Flora italiana Medicina popolare ed
etnobotanica. Rome: Aracne Ed; 2006.
75. Johns T, Kokwaro JO, Kimanani EK. Herbal remedies of the Luo of Siaya District, Kenya: Establishing quantitative criteria for consensus. Econ Bot. 1990;44:369–81.
76. Akerreta S, Cavero RY, López V, Calvo MI. Analyzing factors that influence the folk use and phytonomy of 18 medicinal plants in Navarra. J Ethnobiol Ethnomed. 2007;3:16.
77. Heinrich M, Kufer J, Leonti M, Pardo-de-Santayana M. Ethnobotany and ethnopharmacology–interdisciplinary links with the historical sciences. J Ethnopharmacol. 2006;107:157–60.
78. Medusa Database (and references contained therein). [wwwmedusamaichgr/].
79. Guarrera PM, Leporatti ML. Ethnobotanical remarks on Central and Southern Italy. J Ethnobiol Ethnomed. 2007;3:23.
80. Novellino D.Ampelodesmos mauritanicus. The role ofAmpelodesmos mauritanicusand fiber plants in central Italy. Non-Wood news. 2007;14:24–5. 81. Di Stasi LC, Oliveira GP, Carvalhaes MA, Queiroz-Junior M, Tien OS, Kakinami SH, et al. Medicinal plants popularly used in the Brazilian Tropical Atlantic Forest. Fitoterapia. 2002;73:69–91.
82. Scherrer AM, Motti R, Weckerle CS. Traditional plant use in the areas of Monte Vesole and Ascea, Cilento National Park (Campania, Southern Italy). J Ethnopharmacol. 2005;97:129–43.
83. Ghirardini MP, Carli M, del Vecchio N, Rovati A, Cova O, Valigi F, et al. The importance of a taste. A comparative study on wild food plant consumption in twenty-one local communities in Italy. J Ethnobiol Ethnomed. 2007;3:22.
84. Berlin B. Folk systematics in relation to biological classification and nomenclature. Annu Rev Ecol Syst. 1973;4:259–71.
85. Medeiros PMD, Soldati GT, Alencar NL, Vandebroek I, Pieroni A, Hanazaki N, De Albuquerque UP. The use of medicinal plants by migrant people: adaptation, maintenance, and replacement. Evidence-Based Complementary and Alternative Medicine 2012, Article ID 807452.
86. Rhoades DF, Cates RG. Toward a general theory of plant antiherbivore chemistry. In: Wallace JW, Mansell R, editors. Biochemical Interactions Between Plants and Insects. 1st ed. New York: Plenum Press; 1976. p. 168–213.
87. De Almeida CFCBR, De Lima Silva TC, De Amorim ELC, De Maia MB, De Albuquerque UP. Life strategy and chemical composition as predictors of the selection of medicinal plants from the Caatinga (Northeast Brazil). J Arid Environ. 2004;62:127–42.
Submit your next manuscript to BioMed Central and take full advantage of:
• Convenient online submission
• Thorough peer review
• No space constraints or color figure charges
• Immediate publication on acceptance
• Inclusion in PubMed, CAS, Scopus and Google Scholar
• Research which is freely available for redistribution
![Table 2 Chorology, life form, habitat and taxonomical group (following [34,66]) of plants included in DTS1, DTS2, DTS3](https://thumb-us.123doks.com/thumbv2/123dok_us/695765.1565818/5.595.61.536.107.728/table-chorology-habitat-taxonomical-group-following-plants-included.webp)