R E S E A R C H
Open Access
Identification of dietary patterns by factor analysis
and study of the relationship with nutritional
status of rural adolescents using factor scores
Kodavalla Venkaiah
1,3*, Ginnela Narsimhachary Veera Brahmam
2and Kamasamudram Vijayaraghavan
2Abstract
Study was undertaken to know food and nutrient consumption patterns and their relationship with nutritional status among rural adolescents in Orissa. It was a Community based cross sectional study, conducted at district level in the State of Orissa. Data on 686 adolescent boys and 689 adolescent girls were utilized. Factor analysis was used to find dietary pattern and discriminate analysis and its relationship with undernutrition. The study revealed that among adolescent boys, there existed six patterns among food-groups and three patterns among nutrients explaining 52% and 76% of total variation. Similarly among adolescent girls, seven patterns among food groups and three patterns among nutrients, explaining 67% and 80% of total variation. The discriminate analysis using the factor scores revealed overall 56% of adolescent boys, and 53% of girls were correctly classified. About 46% of boys who were actually thin were predicted as normal, while, 40% who were normal were predicted as thin. Among girls 50% who were actually thin were predicted as normal, while, 36% who were normal were predicted as thin. In conclusions, there exists considerable relationship between dietary patterns and nutritional status among rural adolescents.
Keywords:Dietary patterns, Adolescents, Nutritional status, Factor analysis
Background
Adolescence is a period of rapid growth and human development, after infancy [1]. Adequate intake of foods and nutrients contribute significantly to the growth and development during the adolescence period particularly among the girls, the future mothers [2]. The complexity of relationship of dietary patterns presents a challenge to study the prevalence of under nutrition in relation to dietary intakes. Food intake is generally studied in terms of adequacy of nutrients [3]. However, foods contain other chemical compounds, some of which are estab-lished, some are poorly characterized, and others being completely unknown cannot be measured. Since there is very little information about dietary intakes and the rela-tionship with nutritional status of adolescent population in India [4], an attempt was made to find the relation-ship between dietary intakes and nutritional status.
About 45% of rural adolescents in India are currently reported to suffer from undernutrition, as assessed by
Body Mass Index (BMI) <−2SD [5]. The relationship
between intake of a food-group and the prevalence of under nutrition may erroneously be attributed to a single component, overlooking the fact that there exists multi-colinearity between nutrients and foods, which can be demonstrated by employing sophisticated statis-tical procedure, such as principal components and factor analysis, to derive food consumption patterns [6]. Factor analysis is used to find latent variables or factors among observed variables [7]. In other words, factor analysis is used to reduce the number of variables which groups variables with similar characteristics together. The reduced number of factors can also be used for further analysis. Thus, using Factor analysis it is possible to study the food and nutrient intake patterns and its relationship with the nutritional status. For developing general descriptions of dietary patterns, Principal Com-ponent Analysis (PCA), followed by factor analysis is used. The objective is to transform a large set of correlated variables into smaller sets of non-correlated
* Correspondence:kodalivenkaiah@yahoo.com 1
Division of Biostatistics, National Institute of Nutrition, Indian Council of Medical Research (ICMR), Jamai-Osmania, PO, Hyderabad 500007, India
3
Department of Biostatistics, National Institute of Nutrition (ICMR), Jamai-Osmania, PO, Hyderabad 500007, Andhra Pradesh, India Full list of author information is available at the end of the article
variables, known as principal components or factors [8]. In factor analysis, rather than establishing a diet indicator, data objectively indicate as to how measure-ments are clustered. The aim of this technique is to identify the underlying structure in data matrix, by summarizing and consigning data to arrive at a sys-tematic measurement of the diet. To summarize data, factor analysis desires dimension that, when inter-preted and understood, describes data in terms of a much smaller number of items than do the individual variables [8].
The objective of the present analysis is to describe the food and nutrient-consumption patterns among adoles-cent rural population that are apparently homogeneous, and to relate these with the prevalence of thinness in the State of Orissa, India using factor analysis.
Methods
Study design and sample
The data on diet and nutritional status, collected from the survey of district nutrition profile in Orissa state,was
used. In total, 12,000 households— 400 households per
district— from all the 30 districts in Orissa state were covered [9]. Anthropometric measurements, viz. height and weight, were taken on all the available individuals in the households. In every alternate household covered for nutrition assessment, a 24-hour recall family diet survey was carried out. Individual dietary intakes were also assessed on 12,621 individuals of different ages of both the sexes. From the average daily intake of foods, nutrients were computed using food composition tables [10]. The present analysis included data on 686 adolescent boys and 689 adolescent girls, aged between≥10 and < 18 years, on whom the data on both anthropometry and dietary intakes was available.
Data collection
Data was collected by qualified staffs (nutritionist, social worker and anthropologist) that were trained for a period of 3 weeks in standard survey methodologies. Anthropometric measurements such as height and weight were collected using standard equipment and procedures [11]. Height was measured using anthrop-ometer rod and weight was measured using SECA weighing balance. Diet survey was carried out using 24 hr recall method of diet survey in alternative house hold covered for anthropometry [12]. Scientist from the Institute had revisited the household completed on pre-vious day by the project staff to ensure quality control.
Statistical analysis
The mean, median, and inter-quartile range of various food-groups and nutrients for adolescent boys and girls were calculated. Diet patterns were obtained by exploratory
factor analysis for 13 food-groups and 11 (3 macro and 8 micro) nutrients. Further, the proportion of adolescents consuming < 50% of Recommended Dietary Intake (RDI) [13] for foods and nutrients was calculated for different age groups of both the sexes.
Exploratory Factor analysis—an explorative multivari-ate statistical technique—was used for the identification of factors in a set of dietary measurements. Such factors would correspond to indicators, and all variables were considered simultaneously, each one in relation to the others. Principal Component Analysis was used for extraction of factors and orthogonal rotation (varimax option) to derive non-correlated factors and minimize the number of indicators that have high loading on one factor [6, 7]. The first component extracted is the one that accounts for the maximum possible variance in the dataset. The second component, independent of the first, will be the one that explains the largest possible share of the remaining variance and so on, without the components being correlated with each other [8].
Since dietary data has been collected using 24 hr recall method actual intakes were measured. When quantita-tive data is available, factor analysis is the suitable statis-tical method and gives better results as compared to Food Consumption Score, Dietary Diversity score where in these methods uses scoring procedure instead of actual diet intakes. Since we did not aim to compare various methods to determine dietary intake patterns, the other methods have not been applied.
The adequacy of data was evaluated based on the value of Kaiser-Meyer-Olkin (KMO) and Bartlett's test (homogeneity of variance). The KMO measure, which represents the adequacy of sample-size, compares the value of partial correlation coefficients against the total correlation coefficients.
Undernutrition of a given individual was computed on the basis BMI of a given individual (weight in kg/height in metre2). The adolescents were categorized into one of the two groups of ‘Thinness’ as Group 1: BMI < median −2
SD units and Normal if BMI≥median -2SD units as
Group 2 using WHO reference values [14].
Discriminate function analysis was used for studying the relationship between the food and nutrient intake and the nutritional status [8]. The factor scores obtained by the factor analysis for food and nutrients were con-sidered as continuous independent variables, and BMI categories of the adolescents were considered dichotom-ous dependent variable. Statistical analysis was performed using the SPSS software (version 19.0).
Ethical approval
involve any biochemical investigations; hence only in-formed written consent was obtained from the head of the village and from head of the household.
Results
The average and interquartile range of various food intakes according to sex is presented in Table 1. The food grouping was done as is adopted in the National Nutrition Monitor-ing Bureau surveys in India over the past 40 years and is well-accepted by nutritionists. The mean and median in-takes of were comparable in both the boys and girls with respect to cereals & millets, pulses and legumes, roots and tubers, other vegetables, condiments and spices, and fats and oils . However, the median intakes of nuts and oil seeds, fruits, fish and other sea foods, meat and poultry,
milk and milk products and sugar and jaggery indicated
that 50% were consuming these foods inadequately. In fact,
75% of the adolescents were consuming income elastic foods like fish and other seafood’s, meat and poultry and milk and milk products in amounts < 50% of Recom-mended dietary intakes(RDI). However the intakes are more or less similar in both adolescent boys and girls.
The median intakes of various nutrients according to age groups and sex are presented in Table 2. The median intake of energy for boys and girls were 1902 Kcal and 1844 Kcal respectively. There exists a large variation in the consumption of various nutrients was observed among adolescents. There were no sex differentials in the median intakes of various nutrients.
Since the Recommended dietary intakes (RDIs) are different for different age groups and sex, the intakes were compared with RDI according to age groups and sex (Table 3). About 7 to 16% of adolescents were not meeting even 50% of RDI for cereals. In case of pulses more than a half of the adolescents were not meeting 50% RDI. Improving trend with age in the consumption of different foods was observed in both the boys and girls, with no significant sex differentials.
The consumption of energy was relatively better with 86% consuming > 50% of RDA, while about 70% were consuming proteins > 50% of RDA (Table 4). More than three fourths of the adolescent boys and girls consumed less than 50% of the RDA for fats and micronutrients such as calcium, riboflavin iron and vitamin A.
There was sufficient correlation between different foods (Boys: 0.613; Girls: 0.513) to proceed with factor analysis. Similarly, in the case of nutrients, the KMO measure indicated a higher correlation between nutri-ents (boys: 0.793 and girls: 0.755). The Bartlett test of sphericity for foods and nutrients among boys and girls was highly significant (p < 0.01), indicating homogeneity of variance by the consumption of foods and nutrients.
Five components for boys and seven components for girls were extracted by factor analysis for different food-groups (Table 5). The five components (factors) in the initial solution have an Eigen value over 1, accounting for about 52% of the observed variation in the food-consumption pattern among the boys, while, among the girls the seven factors accounted for about 67% of the observed variation in the food-consumption pattern.
The first factor, which accounted for 16.6% of the total
variance among the boys, was labeled as income-elastic
foods, as high factor loading was observed for sugar and
jaggery, followed by milk and milk products, Fats and oils and pulses and legumes. The second factor ex-plained 10.1% of the total variance and was labeled as
plant-foods, and green leafy vegetables, fruits and cereals and millets were the major contributors. The third factor accounted for 9.5% of the total variance, and this factor was labeled astraditionalcontributed by the intake of fish and other sea foods, meat and poultry and condiments Table 1 Average intake of foods among rural adolescent
population by sex
Food-group (g/day) Sex Mean SD Percentiles
25 50 75
Cereals and millets Boys 456.7 195.6 315.8 445.5 584.0
Girls 449.4 180.3 325.4 437.9 559.7
Pulses and legumes Boys 26.9 37.2 0.0 17.8 38.4
Girls 28.2 36.8 0.0 20.7 41.4
Green leafy vegetables Boys 27.0 50.8 0.0 0.0 38.6
Girls 29.6 55.2 0.0 0.0 47.5
Roots and tubers Boys 77.5 68.3 26.9 62.6 111.2
Girls 72.3 65.4 20.0 61.1 103.5
Other vegetables Boys 70.5 71.8 0.0 55.3 106.5
Girls 62.1 67.1 0.0 47.9 91.4
Nuts and oilseeds Boys 0.91 5.6 0.0 0.0 0.3
Girls 1.1 7.8 0.0 0.0 0.3
Condiments and spices Boys 5.9 10.1 1.9 3.6 6.6
Girls 5.5 7.9 1.9 3.8 6.5
Fruits Boys 13.1 27.5 0.0 0.0 14.7
Girls 11.2 24.9 0.0 0.0 11.0
Fish and other sea-foods Boys 9.8 27.9 0.0 0.0 0.0
Girls 10.1 30.0 0.0 0.0 0.0
Meat and poultry Boys 5.0 31.2 0.0 0.0 0.0
Girls 1.9 12.6 0.0 0.0 0.0
Milk and milk products Boys 13.8 42.4 0.0 0.0 0.0
Girls 12.8 37.1 0.0 0.0 0.0
Fats and oils Boys 6.6 7.2 4.6 2.5 8.2
Girls 6.4 11.3 4.4 2.5 7.7
Sugar andjaggery Boys 11.1 22.2 0.0 0.0 14.7 Girls 10.3 19.7 0.0 0.0 12.9
and spices. The fourth factor explained 8.4% of the total variance and labeled as plant foodscontributed by other vegetables and roots and tubers. The last and the fifth fac-tor explained 7.9% of the total variance and were labeled asprotein-rich foods(nuts and oilseeds).
In case of the girls, the first factor, which accounted
for 13.7% of the total variance, was labeled as
income-elastic foodswith high factor loadings for milk and milk
products followed by sugar and jaggery. The second
factor explained 10.4% of the total variance and was labeled astraditional(Fish and other sea-foods and Fats and oils). The third factor accounted for 9.7% of the total variance, and was labeled as plant foods charac-terized by the intake of other vegetables and roots and tubers. The fourth factor explained 9.2% of the total variance and labeled asstaplesuch as cereals and millets along with fruits. The fifth factor explained 8.0% of the total variance and were labeled asplant-protein (pulses and legumes).The sixth and seventh factors explains 7.7% of total variation each consists of meat and poultry, condiments and spices, nuts and oil seeds and green leafy vegetables (Table 5).
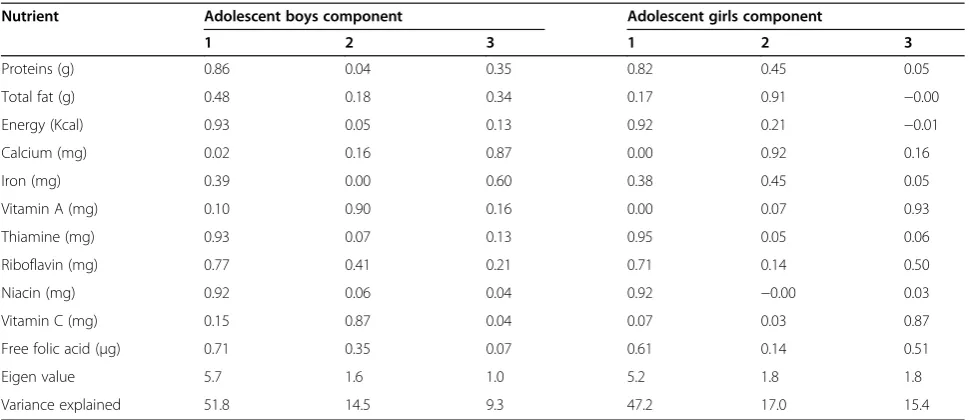
In the case of nutrients, three components for each sex were extracted (Table 6). Energy, thiamin, niacin, protein, riboflavin, and free folic acid had higher loadings on factor 1 among the boys, which explained 51.8% of the total vari-ance. It was labeled as macro nutrients and B-vitamins. Factor 2, labeled as‘vitamins’contained vitamin A and C and had high loadings explaining 14.5% of the total vari-ation. The third factor characterized by the intake of calcium and iron, labeled as‘minerals’which accounted for 9.3% of the total variance. In case of girls, factor 1 explained 47.2% of total variance with loadings of similar to that observed in boys. The second factor which explained 17% of total variation was labeled asfats and minerals(Calcium and total fat) and the third factor explaining 15.4% of total variation was labeled asmacro nutrients and vitamins.
The prevalence of thinness (BMI <−2SD) was 49.4%
among the boys and 46.6% among the girls.
The distributions of predicted thinness based on the de-rived BMI values by the discriminate function analysis using the factor scores of various foods and nutrients as against those based on the anthropometric measurements are presented in Table 7. The discriminate analysis re-vealed overall 56% of adolescent boys, and 53% of girls were correctly classified. About 46% of boys who were ac-tually thin were predicted as normal, while, 40% who were normal were predicted as thin. Among girls 50% who were Table 2 Average intake of nutrients among rural
adolescent population by sex
Nutrients Sex Mean SD Percentiles
25 50 75
Protein (g) Boys 44.7 20.6 30.5 42.4 55.6
Girls 43.9 18.4 31.5 41.6 52.7
Total fat (g) Boys 11.6 10.0 5.7 8.9 13.9
Girls 11.3 13.0 5.8 8.5 13.3
Energy (Kcal) Boys 1929 773 1383 1902 2414
Girls 1895 695 1426 1844 2279
Calcium (mg) Boys 341.0 440 126.4 224 399.4
Girls 337.0 680 121.8 222 393.6
Iron (mg) Boys 11.6 8.9 6.7 9.4 13.5
Girls 11.4 8.1 6.7 9.3 13.4
Vitamin A (mg) Boys 276 553 26.4 54.6 171.1
Girls 302 634 23.5 52.7 196.5
Thiamine (mg) Boys 1.2 0.5 0.8 1.2 1.6
Girls 1.2 0.5 0.9 1.2 1.6
Riboflavin (mg) Boys 0.4 0.2 0.3 0.4 0.6
Girls 0.4 0.2 0.3 0.4 0.5
Niacin (mg) Boys 19.0 8.1 12.8 18.4 24.6
Girls 18.8 7.6 13.4 18.1 23.3
Vitamin C (mg) Boys 58.8 71.1 18.1 34.9 69.8
Girls 58.6 82.2 16.7 32.5 72.5
Free Folic acid (μg) Boys 122 81.1 68.2 104.7 153.5
Girls 122 76.2 72.5 109.2 148.2
n:Boys-686 and Girls-689.
Table 3 Percent (%)of adolescent consuming foods in amount <50% of RDI
Age group (y) Sex n Cereals Pulses Leafy-veg. Other-veg. Milk and milk products Fats and oils Sugar and Jaggery
10-12 Boys 310 16.1 58.7 82.6 36.1 97.1 85.8 71.9
Girls 278 14.0 50.7 75..2 36.3 95.7 84.2 74.8
13-15 Boys 246 10.6 61.4 80.1 26.4 95.1 80.5 67.5
Girls 262 6.5 55.3 79.4 28.2 94.7 88.9 66.0
16-17 Boys 130 7.7 46.9 75.4 23.8 94.6 78.5 59.2
Girls 149 8.1 47.7 78.5 32.9 95.3 85.2 67.8
All Boys 686 12.5 57.4 80.3 30.3 85.9 82.5 67.9
All Girls 689 9.9 51.8 77.5 32.5 95.2 86.2 70.0
actually thin were predicted as normal, while, 36% who were normal were predicted as thin.
Discussion
Studies have shown that conventional dietary pattern has some limitations to study the relationship between dietary patterns and type 2 diabetes as well as cardiovas-cular diseases [15, 16]. Our earlier study has established relationship between factor scores of dietary patterns derived through factor analysis and chronic energy defi-ciency [17]. In the present manuscript similar technique has been used to demonstrate the relationship between dietary pattern and nutritional status among adolescents. The dietary data has been collected using 24 hr recall method in which actual intakes were measured. When quantitative data is available, the multivariate factor
analysis which is based on interrelations of the entire data set is a suitable statistical method. The result obtained through this method is robust in indentifying the dietary patterns.
It is interesting to note that a half of the rural adolescents were not consuming green leafy vegetables, nuts and oil seeds, fruits, fish and other fish products, meat and poultry,
milk and milk products and sugar and jaggery. Low
con-sumption of green leafy vegetables among adolescents may be due to non availability and low purchasing capacity among the study population. Consequently, about 70-90% of them were not meeting even 50% of RDI for various nu-trients such as calcium, iron, vitamin A and riboflavin [18]. Results of an earlier study revealed that both PCA and cluster analysis are useful approaches for the assessment of dietary patterns [19]. A common criticism of the two Table 4 Percent of adolescents consuming nutrients < 50% of RDA
Age group Gen-der n Protein Energy Calcium Iron Vit-A Thia- min Ribo-flavin Niacin Vit-C Folic acid Fat
10-12 Boys 310 39.7 20.6 84.5 82.9 84.2 10.6 89.4 9.4 59.7 37.4 93.2
Girls 115 31.4 16.9 82.0 84.2 79.5 10.8 89.2 9.0 57.6 31.3 92.1
13-15 Boys 246 28.5 13.0 79.3 84.1 83.3 7.3 84.1 4.9 53.3 30.9 89.8
Girls 262 27.1 8.8 83.2 76.3 81.7 6.5 83.2 5.0 58.8 24.4 91.2
16-17 Boys 130 14.6 8.5 78.5 73.1 81.5 5.4 70.8 3.8 46.9 14.6 86.2
Girls 149 21.5 7.4 83.2 80.5 83.2 4.7 77.9 2.0 57.7 24.2 90.6
All Boys 686 30.9 15.6 81.5 81.5 83.4 8.5 84.0 6.7 55.0 30.8 90.7
All Girls 689 31.6 11.8 82.7 80.4 81.1 7.8 84.5 6.0 58.1 27.1 91.4
Boys + Girls pooled 1375 31.3 13.7 82.1 80.9 82.3 8.1 84.2 6.3 56.5 28.9 91.1
Table 5 Rotated component matrix for food-groups
Food-group (g) Adolescent boys component Adolescent girls component
1 2 3 4 5 1 2 3 4 5 6 7
Cereals and millets 0.00 0.55 0.13 0.31 0.07 −0.18 −0.04 0.23 0.68 0.28 −0.01 0.03
Pulses andlegumes 0.46 0.17 −0.19 0.20 −0.16 0.11 0.00 0.00 0.07 0.84 0.00 −0.05
Green-leafy vegetables −0.02 0.70 −0.14 −0.17 −0.11 −0.00 −0.08 0.04 0.26 −0.28 −0.21 −0.58
Roots and tubers 0.16 −0.12 0.12 0.62 −0.16 0.05 0.20 0.75 −0.03 −0.10 0.07 −0.04
Other vegetables 0.10 0.07 −0.16 0.73 0.18 0.07 −0.11 0.76 0.07 0.10 −0.07 0.11
Nuts and oilseeds 0.02 0.03 −0.00 0.02 0.89 −0.00 −0.03 0.11 0.16 −0.22 −0.10 0.79
Condiments and spices −0.24 0.17 0.56 0.24 0.13 −0.06 −0.00 0.15 0.35 −0.24 0.54 −0.18
Fruits 0.25 0.62 0.11 −0.04 0.09 0.19 0.10 −0.14 0.72 −0.09 0.06 −0.01
Fish and other sea-foods 0.14 −0.20 0.63 −0.20 0.16 −0.01 0.83 −0.12 0.12 −0.12 −0.08 0.08
Meat and poultry 0.05 0.09 0.57 −0.00 −0.23 0.06 0.03 −0.07 −0.06 0.11 0.80 0.11
Milk and milk products 0.64 −0.08 0.10 0.11 0.01 0.81 −0.02 0.10 −0.07 −0.01 0.15 −0.02
Fats and oils 0.59 0.15 0.35 0.31 −0.08 0.09 0.77 0.26 −0.06 0.16 0.14 −0.06
Sugar and jaggery 0.75 0.12 −0.08 −0.05 0.14 0.79 0.09 0.02 0.11 0.14 −0.12 0.03
Eigen value 2.16 1.31 1.23 1.09 1.02 1.58 1.35 1.26 1.19 1.05 1.0 1.0
Variance explained 16.6 10.1 9.5 8.4 7.9 13.7 10.4 9.7 9.2 8.0 7.7 7.7
techniques is that these involve several subjective —but
important— decisions, such as grouping of foods and
nutrients and possible transformations of variables [20]. PCA also involves decisions about the number of compo-nents to be retained and their subsequent labeling [20]. Another disadvantage of these techniques is that though they generate patterns based on variation in diet, there is no guarantee that these patterns will be predictive of a particular health outcome. However, the techniques have the advantage that they are empirically derived and are, therefore, not limited by merea prioriknowledge [8].
In developing countries, studies on identifying dietary patterns and their relationship with nutritional status are scarce. The intake of foods and nutrients highly correlated, and the classification methods based on univariate analysis may lead to flawed estimates [8]. Therefore, multivariate methods, such as factor analysis, represent an alternative approach to the evaluation of individual foods and nutrients and to examine the association of dietary patterns with nutritional status. Moreover, it should be kept in mind that individuals intake of nutrients depend on their intakes of different types foods, which are influenced by many factors, Table 6 Rotated component matrix for nutrients
Nutrient Adolescent boys component Adolescent girls component
1 2 3 1 2 3
Proteins (g) 0.86 0.04 0.35 0.82 0.45 0.05
Total fat (g) 0.48 0.18 0.34 0.17 0.91 −0.00
Energy (Kcal) 0.93 0.05 0.13 0.92 0.21 −0.01
Calcium (mg) 0.02 0.16 0.87 0.00 0.92 0.16
Iron (mg) 0.39 0.00 0.60 0.38 0.45 0.05
Vitamin A (mg) 0.10 0.90 0.16 0.00 0.07 0.93
Thiamine (mg) 0.93 0.07 0.13 0.95 0.05 0.06
Riboflavin (mg) 0.77 0.41 0.21 0.71 0.14 0.50
Niacin (mg) 0.92 0.06 0.04 0.92 −0.00 0.03
Vitamin C (mg) 0.15 0.87 0.04 0.07 0.03 0.87
Free folic acid (μg) 0.71 0.35 0.07 0.61 0.14 0.51
Eigen value 5.7 1.6 1.0 5.2 1.8 1.8
Variance explained 51.8 14.5 9.3 47.2 17.0 15.4
Extraction method; Principal component analysis; Rotation method; Varimax with Kaiser normalization; Rotation converged in 3 iterations in both Boys and Girls.
Table 7 Classification of subjects according nutritional status with undernutrition and without undernutrition using observed BMI and predicted BMI using scores derived from factor analysis for foods and nutrients
a. Classification results: adolescent boys
BMI Predicted BMI group according to factor scores derived through factor analysis Total
<−2SD ≥ −2SD
According to BMI n% <−2SD 250 216 466
≥ −2SD 89 131 220
<−2SD 53.6 46.4 100
≥ −2SD 40.5 59.5 100
Factor scores derived by factor analysis predicted correctly (55.9%) those who are thin as thin and normal as normal group. Adolescent boys (46.4%), who were originally thin (<−2SD) were predicted as normal and 40.5% who were originally normal were predicted as thin.
b. Classification results: adolescent boys
BMI Predicted BMI group according to factor scores derived through factor analysis Total
<−2SD ≥ −2SD
According to BMI n% <−2SD 264 268 532
≥ −2SD 57 100 157
<−2SD 49.6 50.4 100
≥ −2SD 36.6 63.7 100
such as cultural, socioeconomic and demographic char-acteristics. Describing food intake in different consump-tion patterns may be useful in developing community based intervention programmes. It is possible to find a smaller number of measures using factor analysis that would permit the identification of persons who are nutritionally at risk [21].
Several studies examined the relationship between dietary patterns and nutritional status, overweight, obesity etc., there were many in consistencies in es-tablishing a clear relationship between them [22, 23]. However, the present data showed a considerable relationship between the dietary pattern and the nu-tritional status, as indicated by the distribution of predicted BMI based on factor scores. About a half of the adolescents of with thinness (boys: 54% and girls: 50%) were correctly classified based on the scores ob-tained by factor analysis. Similar findings were also observed among adult population from our earlier study [17].
National Institute of Nutrition conducted workshop to disseminate the results of the survey to all the stake-holders of Government of Orissa and distributed bro-chures containing the need for consumption of locally available foods such as green leafy vegetables and fruits. This will be useful for the politician, policy planners or development partners in formulating optimal dietary in-terventions to this vulnerable population [24].
Conclusion
Factor analysis allowed the identification of dietary pat-terns based on the data from food and nutrient intake. The factors extracted for boys and girls are different in case of food groups, but similar in case of nutrients among adolescent rural population.
There exists a relationship between specific diet pattern and thinness among the rural adolescent population. These results will be useful for identifying adolescent boys and girls with thinness in the community and help the planners in formulating dietary interventions to them.
Competing interests
The authors declare that they have no competing interests.
Conflicts of interest
There are no conflicts of interest.
Authors’contributions
K Vijayaraghavan conceived and supervised the study. K Venkaiah developed the database and carried out the statistical analysis and prepared the manuscript. GNVB and K Vijayaraghavan revised and provided critical comments. All authors read and approved the final version of the manuscript.
Acknowledgements
The authors thank all the adolescents who participated in the study. The authors thank Dr. B. Sesikeran, Director, National Institute of Nutrition, for
permission to conduct the study. They also thank Dr. M. Vishnuvardhana Rao and Dr. N. Balakrishna for their technical support.
Source of funding
Department of Women and Child Welfare, Ministry of Human Resource Development, Government of India.
Author details
1
Division of Biostatistics, National Institute of Nutrition, Indian Council of Medical Research (ICMR), Jamai-Osmania, PO, Hyderabad 500007, India.2Division of
Community Studies, National Institute of Nutrition, Indian Council of Medical Research (ICMR), Jamai-Osmania, PO, Hyderabad 500007, India.3Department of
Biostatistics, National Institute of Nutrition (ICMR), Jamai-Osmania, PO, Hyderabad 500007, Andhra Pradesh, India.
Received: 31 January 2013 Accepted: 24 December 2014
References
1. Macmillan P. Dictionary for Students Macmillan, Pan Ltd. 1981; p. 14-456. Retrieved 2010-7-15
2. Martorell R. Long−term effects of improved childhood nutrition. SCN News No. 1992;8:10–2.
3. Report of the expert group of Indian council of Medical Research. Nutrient 405 requirement and recommended dietary allowances for Indians. ICMR, New Delhi, 2011. http://icmr.nic.in/final/RDA-2010.pdf
4. Venkaiah K, Damayanthi K, Nayak MU, Vijayaraghavan K. Diet and nutritional status of rural adolescents in India. Eur J Clin Nutr. 2002;56:1119–25. 5. Brahmam GNV, Laxmaiah A, Hari Kumar R, Balakrishna N, Arlappa N, Gal reddy CH et al. Technical report on Diet and Nutritional status of population and prevalence of Hypertension among adults in rural areas. NNMB Technical Report No.24, National Institute of Nutrition, Indian Council of Medical Research, Hyderabad 2006. http://nnmbindia.org/
nnmbreport06nov20.pdf
6. Kleinbaum DG, Kupper LL, Muller KE. Variable reduction and factor analysis. Applied regression analysis and other multivariable methods. Boston: PWS Kent Publishing Co; 1988. p. 595–640.
7. Hair JF, Anderson RE, Tatham RL, Black WC. Multivariate data analysis with reading. 4th ed. New Jersy: Prentice Hall; 1995. p. 500.
8. Mardia KV, Kent JM, Bibby JM. Multivariate analysis. London: Academic press; 1980. p. 521.
9. Vijayaraghvan K, Hanumathurao D, Brahmam GNV, Sarma KVR, Radhaiah G, Laxmaiah A, et al. Technical report on nutrition profile of community. Orissa: National Institute of Nutrition, Indian Council of Medical Research, Hyderabad; 2002.
10. Gopalan C, Rama Sastri BV, Balasubramanyam SC, Narsingarao BS, Deosthale YG, Panth KC, et al. Nutritive value of Indian foods. Hyderaba: National Institute of Nutrition, Indian Council of Medical Research; 1989. p. 47–67.
11. Jelliffee DB, Jelliffee EP. Community nutritional assessment. Oxford: Oxford university Press; 1990.
12. Thimmayamma BVS, Rao DH. A comparative study on oral questionnaire method with actual observation of dietary intake of preschool children. J Nutri Diet. 1969;6:177–81.
13. K Venkaiah, K Damayanti, M U Nayak and K Vijayaraghavan. Diet and nutritional status of rural adolescents in India. EJCN, 2002; 56(11):1119-1125. 14. Mercedes De O, Onyango AW, Elaine B, Amani S, Chizuru Nishida Jonathan S. Development of a WHO growth reference for school-aged children and adolscents. Builtin World Health Org. 2007;85:660–7.
15. Frank BH. Dietary pattern analysis: a new direction in nutritional epidemiology. Currr Opin Lipidol. 2002;13:3–9.
16. Zhaleh S, Mahdieh A, Nooshin P, Bagher L, Mostafa Q and Mohsen KN. New challenges in dietary pattern analysis: combined dietary patterns and calorie adjusted factor analysis in type 2 diabetic patients. http://www.jdmdonline. com/content/13/1/71.
17. Venkaiah K, Brahmam GNV, Vijayaraghavan K. Application of factor analysis to identify dietary patterns and use of factor scores to study their relationship with nutritional status of adult rural populations. J Health Popul Nutr. 2011;29(4):327–38.
National Institute of Nutrition, Indian Council of Medical Research, 2000. http://nnmbindia.org/NNMBPDF%20FILES/Special_Report_on_Elderly%26_ Adolescents%20Diet_%26_Nutritional_St.pdf
19. Newby PK, Muller D, Hallfrisch J, Andres R, Tucker KL. Food patterns measured by factor analysis and anthropometric changes in adults. Am J Clin Nutr. 2004;80:504–13.
20. Crozier SR, Robinson SM, Borland SE, Inskip HM, SWS Study Group. Dietary patterns in the Southampton women’s survey. Eur J Clin Nutr.
2006;60:1391–9.
21. Guthrie HA, Gutherie GM. Factor analysis of nutritional status data from ten state nutrition surveys. Am J Clin Nutr. 1976;29:1238–41.
22. Newby PK, Katherine L, Tucker KL. Empirically derived eating patterns using factor or cluster analysis: a review. Nutr Rev. 2004;62:177–203.
23. Wang Y, Popkin B, Zhai F. The nutritional status and dietary pattern of Chinese adolescents, 1991 and 1993. Eur J Clin Nutr. 1998;52(12):908–16. 24. Nutritional Programs for Adolescence .retrieved from http://www.healthy.
net/Health/Article/Nutritional_Programs_for_Adolescence/1246 dt.16/04/ 2014.
Submit your next manuscript to BioMed Central and take full advantage of:
• Convenient online submission
• Thorough peer review
• No space constraints or color figure charges
• Immediate publication on acceptance
• Inclusion in PubMed, CAS, Scopus and Google Scholar
• Research which is freely available for redistribution