R E S E A R C H
Open Access
Negative effects of diabetes
–
related
distress on health-related quality of life: an
evaluation among the adult patients with
type 2 diabetes mellitus in three primary
healthcare clinics in Malaysia
Boon-How Chew
1*, Sherina Mohd-Sidik
2and Sazlina Shariff-Ghazali
1Abstract
Background:Patients with type 2 diabetes mellitus (T2D) often experienced change in life, altered self-esteem and increased feelings of uncertainty about the future that challenge their present existence and their perception of quality of life (QoL). There was a dearth of data on the association between diabetes-related distress (DRD) and health-related quality of life (HRQoL). This study examined the determinants of HRQoL, in particular the association between DRD and HRQoL by taking into account the socio-demographic-clinical variables, including depressive symptoms (DS) in adult patients with T2D.
Methods:This cross-sectional study was conducted in 2012–2013 in three public health clinics in Malaysia. The World Health Organization Quality of Life-Brief (WHOQOL-BREF), 17-items Diabetes Distress Scale (DDS-17), and 9-items Patient Health Questionnaire (PHQ-9) were used to measure HRQoL, DRD and DS, respectively. The aim of this research was to examine the association between the socio-demographic-clinical variables and HRQoL as well as each of the WHOQOL-BREF domain score using multivariable regression analyses.
Results:The response rate was 93.1 % (700/752). The mean (SD) for age was 56.9 (10.18). The majority of the patients were female (52.8 %), Malay (53.1 %) and married (79.1 %). About 60 % of the patients had good overall HRQoL. The mean (SD) for Overall QoL, Physical QoL, Psychological QoL, Social Relationship QoL and Environmental QoL were 61.7 (9.86), 56.7 (10.64), 57.9 (11.73), 66.8 (15.01) and 65.3 (13.02), respectively. The mean (SD) for the total DDS-17 score was 37.1 (15.98), with 19.6 % (136/694) had moderate distress. DDS-17 had a negative association with HRQoL but religiosity had a positive influence on HRQoL (B ranged between 3.07 and 4.76). Women, especially younger Malays, who had diabetes for a shorter period of time experienced better HRQoL. However, patients who were not married, had dyslipidaemia, higher levels of total cholesterol and higher PHQ-9 scores had lower HRQoL. Macrovascular complications showed the largest negative effect on the overall HRQoL (adjusted B =−4.98, 95 % CI−8.56 to−1.40).
(Continued on next page)
* Correspondence:chewboonhow@gmail.com 1
Department of Family Medicine, Faculty of Medicine and Health Sciences, Universiti Putra Malaysia, 43400 Serdang, Selangor, Malaysia
Full list of author information is available at the end of the article
© 2015 Chew et al.Open AccessThis article is distributed under the terms of the Creative Commons Attribution 4.0 International License (http://creativecommons.org/licenses/by/4.0/), which permits unrestricted use, distribution, and reproduction in any medium, provided you give appropriate credit to the original author(s) and the source, provide a link to the Creative Commons license, and indicate if changes were made. The Creative Commons Public Domain Dedication waiver (http://creativecommons.org/publicdomain/zero/1.0/) applies to the data made available in this article, unless otherwise stated.
(Continued from previous page)
Conclusion:The majority of primary care adult with T2D had good overall HRQoL. Furthermore, the independent determinants for HRQoL had also concurred with many past studies. In addition, the researchers found that DRD had negative effects on HRQoL, but religiosity had positive influence on HRQoL. Appropriate support such as primary care is needed for adult patients with T2D to improve their life and their HRQoL.
Trial registration:NMRR-12-1167-14158
Keywords:Quality of life, Distress, Depression, Type 2 diabetes mellitus, Primary care, Religious beliefs
Background
Type 2 diabetes mellitus (T2D) has been known to have changed life experiences, altered self-esteem, challenged present existence and increased uncertainty about the future [1–8].
The lives of individuals would change from the moment when they experience the symptoms such as chronic hyperglycaemia, weight loss, skin infections and lethargy right up to the diagnosis of diabetes mellitus. A complete change in life routines continues from the demands of more regular healthy life-styles, adherence to daily medi-cation and scheduled visits to various types of healthcare professionals. Repeated physical examinations, laboratory tests and psychosocial counselling reverberating the ideas of risky threats to bodily health and the long-term com-plications [9] could reduce the esteem and self-confidence that inspire adventures and motivation in the patients’lives [10, 11]. Family members and friends would also avoid discussing the implications of the disease with the patients [12, 13]. There might be occasional feelings of stigmatisation at family gatherings or even at work-related social functions [7, 14]. Left alone to these physical and psychological onslaughts, many patients may feel over-whelmed, shaken and questioned their personal values and beliefs of the purpose of self-regulation [10], self-care and self-management [15]. Hope for the future may be re-placed with dread of complications from the disease and the adverse effects of medications which may result in fre-quent and disruptive effects such as restlessness, distress, anxiety, and depression [3, 16]. Eventually, all of these negative emotions may lead to the failure of adherence to health recommendations, medications, medical follow-ups [17, 18], and may increase the number of medical leaves [16]. Consequently, patients’ personal perceptions turn from bad to worse, and they start to smoke excessively [19], practise uncontrolled diet, and have conflicts with their significant others [20]. This would cause the symp-toms of diabetes and their associated complications to re-turn despite escalating their medications [21].
Quality of life (QoL) of the patients with diabetes mel-litus represents personal perceptions of life experience, social, vocational and domestic functioning against hope and ideals from aspects of physical, psychological, rela-tionships, environmental and spiritual domains [22, 23].
A large body of literature has focused on the impacts of diabetes mellitus of both type 1 and type 2 on patients, albeit in vast aspects and contexts of life [4, 21, 24], and the associations with QoL, self-efficacy and disease con-trol for adult patients with T2D. Moreover, patients who perceived higher levels of QoL also showed that they had better social support, acceptance of the seriousness and consequences of the disease, and had less difficulty in managing their diabetes [25]. In spite of the many differ-ent QoL scales used in past studies, there are similar effects of socio-demographic variables and clinical parameters on the domains of QoL across the globe [18, 26–34]. However, there was a dearth of data on the association between diabetes-related distress (DRD) and health-related quality of life (HRQoL). Accordingly, the purpose of this study was to evaluate the determinants of HRQoL, particularly to examine the effects of DRD on HRQoL taking into ac-count other socio-demographic-clinical variables of adult patients with T2D who received regular primary medical care in three public health clinics in Malaysia. Hence, the research question was: what are the independent effects of socio-demographic-clinical variables, including DRD and depressive symptoms (DS), on HRQoL in adult patients with T2D?
Methods
Ethics, consent and permission
This cross-sectional study was approved by the Medical Research Ethics Committee (MREC), Malaysia’s Ministry of Health with the reference number NMRR-12-1167-14158. Respondents had provided their written informed consent before participating in the study, and the ano-nymity of the patients was preserved throughout the study.
Setting
Indians in a larger proportion than a usual public health clinic. SL is a rural clinic situated in a Malay-majority resi-dential area. The variability of the sites provided a broad range of patients on which the associations of DRD, HRQoL and socio-demographic clinical parameters can be assessed. The purpose of this report was to determine the associations of the independent variables and the de-pendent variables irrespective of the health clinics.
Patient
Definitions of study participants
The researchers had sampled consecutively all the patients with T2D who came to the clinics. The patients were at least 30 year-old and were diagnosed with T2D for more than a year. The patients who were recruited for this study fulfilled the following criteria: have been on regular follow-ups, had at least three visits at the clinic in the past 1 year and had recent blood test results done within the past 3 months. Patients who were pregnant or lactating, had psychiatric/psychological disorders that could impair judgment and memory, and could not read or understand English, Malay or Mandarin were excluded from this study. Patients who fulfilled the criteria were approached and informed of the study and their written consents were obtained before the questionnaires were administered in their preferred language. Trained research assistants also interviewed the patients who were not able to answer the questionnaires themselves.
Besides a questionnaire on demography (age, gender, ethnicity, religion, educational level, occupation, monthly income, self-perceive social support) and smoking status, a structured case record form was used to document the patients’history which includes co-morbidities (hyperten-sion and hyperlipidaemia/dyslipidaemia), diabetes-related complications, duration of the diabetes, HbA1c, blood pressure, lipid profiles, number and type of medication used. Three questionnaires were distributed to evaluate HRQoL, DRD and DS, and they were prepared in three languages: English, Malay and Mandarin.
Definitions of diseases
The definition of T2D was when their case records fulfilled any of these criteria: (i) either having documented a diag-nosis of diabetes mellitus according to the 1999 World Health Organization criteria [35] or (ii) currently treated with lifestyle modifications, oral anti-hyperglycaemic agents or insulin. Hypertension was diagnosed if the sys-tolic blood pressure was≥130 mm Hg and/or the diastolic blood pressure was≥80 mm Hg on two of the successive readings obtained by the clinic’s physicians. A blood pres-sure (BP) < 130/80 mmHg was regarded as controlled BP, and this was the mean of the two readings in the rested position with the arm positioned at the heart level, using a cuff of an appropriate size. Hyperlipidaemia refers to an
increase in the concentration of one or more plasma or serum lipids, usually caused by cholesterol and triglycer-ides, and the term dyslipidaemia was used for either an in-crease or dein-crease in the concentration of one or more plasma or serum lipids [a low density lipoprotein-cholesterol (LDL-C) > 2.6 mmol/L, triglyceride (TG) > 1.7 mmol/L and high density lipoprotein-cholesterol (HDL-C) < 1.1 mmol/L]. Body mass index (BMI) was cal-culated as weight was divided by height squared. A LDL-C≤2.6 mmol/L and HbA1c≤6.5 % were regarded as the other treatment targets [36, 37]. These clinical data were retrieved from the patient’s medical records using a case record form on the same day when the patient completed the questionnaires.
Definitions of diabetes-related complications
There were five diabetes-related complications in this study. Three were classified as microvascular complica-tions (MicroCx) which comprised retinopathy, nephropa-thy, and diabetic foot problems (DFP). Another two complications were classified as macrovascular complica-tions (MacroCx) which comprised ischemic heart disease and cerebrovascular disease, or stroke. These complica-tions were retrieved from the patient’s medical records. Diagnoses of these complications were made or confirmed by the attending physicians at the clinics based on the medical symptoms, laboratory results, radiological evi-dence, and treatment history obtained from the clinic and other hospitals. Nephropathy was diagnosed if any of the following was present: microalbuminuria, proteinuria, serum creatinine > 150 mmol/L or estimated glomerular filtration rate < 60mls/min (calculated using Cockroft-Gault formula) persisted (≥2 occasions with at least 3 months apart). DFP comprised foot deformity, current ulcer, amputation, peripheral neuropathy, or peripheral vascular disease.
Instruments
Health-related quality of life
to 0.84 (for domain 1) [39, 40]. There are also two items on overall perceptions of HRQoL that are ex-amined separately. Question 1 asks about the individ-ual’s overall perception of HRQoL, and question 2 asks about the individual’s overall perception of his or her health. Each item, from item number 3 to 26, contributes equally to their domain score. After the negatively framed constituent questions were reverse scored, domain scores were calculated by computing the mean of the item scores within the domain. The mean domain scores were then multiplied by 4 providing a range of 4 to 20 and trans-formed to 100 ([score – 4] * 100/16) in further analyses. The sum of the domain scores were scaled in a positive dir-ection (i.e. higher scores denote higher HRQoL). Where up to two items were missing, the mean of the other items in the domain were substituted. Where more than 20 % of the data were missing from an assessment, the assessment was discarded. Where more than two items were missing from the domain, the domain score was not calculated (with the exception of domain 3, where the domain was only calculated if < 1 item was missing). There were high correlations between the domain scores based on the WHOQOL-100 and domain scores calculated using items in the WHOQOL-BREF [39]. These correlations ranged from 0.89 (for domain 3) to 0.95 (for domain 1). The WHOQOL-BREF was shown to be comparable to the WHOQOL-100 which could discriminate between the ill and well groups [38, 39].
Diabetes-Related Distress (DRD)
The 17-item Diabetes Distress Scale (DDS-17) assesses problems and hassles concerning diabetes in the past 1 month on a Likert scale which had measurements of 1 (not a problem) to 6 (a very serious problem) [41]. The total DDS-17 score ranges from 17 to 102. The score was calculated by summing up the patient’s responses to the appropriate items and divided by the number of items in that scale. A mean item score of≥3 (moderate distress) is considered a level of distress worthy of clin-ical attention. The DDS-17 has been found to have ad-equate and better psychometric properties compared to other similar scales [42]. A local translation and valid-ation study of the Malay version of DDS-17 showed a high internal consistency (Cronbach’sα= 0.94) and test– retest reliability value of 0.33 (P= 0.009) [43]. There was a significant relationship between the mean DDS-17 item score categories (<3 vs≥3) and HbA1c categories (<7 % vs≥7 %) (X2= 4.20;P= 0.048). The DDS-17 sensi-tivity and specificity, with positive and negative predict-ive values were 56.5, 23.8, 7.6 and 83.1 %, respectpredict-ively. A Chinese version of the DDS-17 was found to have good psychometric properties with Cronbach’s α of 0.90 for internal consistency and test–retest reliability coefficient of 0.74 [44].
Depressive Symptoms (DS)
The Patient Health Questionnaire (PHQ-9) has been known to have a good construct and criterion validity in making diagnosis and assessing the severity of DS, of which a total score of≥10 indicates a sensitivity of 88 % and a specificity of 89 % for major DS [45]. The PHQ-9 refers to the symptoms experienced by patients during the 2 weeks prior to answering the questionnaire (for example thoughts that you would be better off dead or of hurting yourself in some way). The PHQ-9 scores range from 0 to 27, and each of the nine items has a score starting from 0 (not at all) to 3 (nearly every day). PHQ-9 scores of 0–4, 5–9, 10–14, 15–19, and 20–27 represent none to minimal, mild, moderate, moderately severe, and severe DS, respectively. The Malay version of PHQ-9 had been locally validated with a sensitivity of 87 % (95 % confidence interval 71 to 95 %), a specificity of 82 % (74 to 88 %), positive likelihood ratio (LR) 4.8 (3.2, 7.2) and negative LR 0.16 (0.06, 0.40) [46]. DS was included in this study as one of the main covariates of DRD [47]. The Chinese version of the PHQ-9 is reported to have good psychometric properties with an internal consistency of 0.82 and test–retest reliability of 0.76 over a 2-week interval [48].
Statistical analyses
A sample size was calculated using GPower 3.1.2 soft-ware with an estimated effect size at 1.5 [47, 49], of DRD on HRQoL, with a power of 0.95 and significance at 0.05; the estimated sample size was 500. Taking into consideration the fact that 30 % of the data in the patient’s medical records were either incomplete or miss-ing, and 30 % of the data in the questionnaires filled by the patients were incomplete, and the sample size needed was 650.
Quantitative data analyses were then executed with IBM SPSS Statistics version 21.0. Comparisons of mean levels were performed using the Student’s t-test for unpaired samples and Chi square test was used for pro-portionate samples. If the value ofP< 0.05, it was consid-ered to be significant at two tails. Independent variables include the demographic, DRD (measured by DDS-17), DS (measured by PHQ-9), and clinical data.
The researchers had observed that the socio-demographic characteristic was according to the tertile of the overall quality of life (OQOL). Visual inspections on the histogram and the statistical tests confirmed the normal distributions of OQOL and the four domain scores (PQOL, YQOL, SRQOL and EQOL). Then the relationship between the independent variables towards OQOL and each of the domain score were examined using multiple linear regression analyses.
on the WHOQOL-BREF scores were included in the final multiple linear regression analyses. Socio-demographic data that were continuous and ordinal were entered in the linear regression while the nominal variables were trans-formed to binary (such as ethnicity, religion and marital status). Employment status variable was re-ordered into three categories: unemployed (0), retired/home manager (1) and employed (2) based on the initial assessments of the direction of the effect on WHOQOL-BREF scores. Clinical variables that had intervals were first entered in the linear regression. The absence of association prompted the entry of the clinical variables to be in a binary nature in accordance to the recommended targets of control (1). MicroCx and MacroCx were preferentially entered in sequence in the linear regression analyses instead of the combined variable of any diabetes complications which was only entered when both the MicroCx and MacroCx were found not in association with HRQoL. This was done so that the individual effects of MicroCx or MacroCx could be discovered, and the combined variable for both of these complications would confirm the true state of no association with a larger sample size.
The multicollinearity between the variables was checked with a correlation matrix and an inspection of their standard error (SE) magnitude. In this study, no variables correlated with each other, r< 0.2 and SEs were all within 0.001 to 5.0. In all the final models, Q-Q plots gave an indication of normality, the residual plots in-dicated a fulfilment of linearity and homogeneity assump-tions. Age, gender and ethnicity were included in all the models because these three variables were potential confounders.
Results
The participants’response rate was 93.1 % (700/752). Out of these respondents, 694, 700, 697 and 698 had complete data on summed OQOL, PQOL, YQOL, SRQOL and EQOL, respectively. The mean (SD) for age was 56.9 (10.18) years. More than half were women (52.8 %) and Malay (53.1 %) (Table 1). Furthermore, the majority of the respondents were either married or living with partners (79.1 %), had non-tertiary education (89.0 %), and were earning < RM 3000 (about USD 850) per month (94.4 %). Most patients did some exercise (57.6 %) and never smoked (76.1 %). About 80 % of the patients reported that they had hypertension compared to about 40 % who had dyslipidaemia. Patients who used oral hypogly-caemic (OHA), anti-hypertensive agents (AHA), and lipid-lowering agents (LLA) were about 91 %, 88 % and 77 %, re-spectively (Table 1).
There were only a minority of patients who achieved treatment targets. About 10 % attained BMI < 23 kgm−2,
15 % achieved HbA1c < 6.5 %, 25 % achieved HbA1c < 7.0 %, 30 % attained BP≤130/80 mmHg and 40 % attained LDL-C≤2.6 mml/L (Table 1). In addition, about 12 % had one of the diabetes-related complications, and this rate seemed to parallel with the number of patients who were on anti-platelet agents (Table 1).
Based on the first two items of the WHOQOL-BREF, a majority of the adult patients with T2D at the primary care clinics had good HRQoL. About 60 % of the respon-dents had more than good overall HRQoL and were satis-fied with their health (Fig. 1). The mean (SD) for OQOL, PQOL, YQOL, SRQOL and EQOL were 61.7 (9.86), 56.7 (10.64), 57.9 (11.73), 66.8 (15.01) and 65.3 (13.02), respect-ively. The patterns of distribution for WHOQOL-BREF domains in the three participating clinics were largely similar with PQOL and YQOL at the trough, and SRQOL and EQOL at the peak (Fig. 2). Patients from SL health clinic showed a significantly higher HRQoL. This associ-ation disappeared after the other socio-demographic variables were adjusted in the multivariable analyses (Table 2).
Socio-demographic profile and quality of life
Male patients with T2D were generally experienced lower HRQoL except in PQOL and significantly so in SRQOL (Table 2). However, Malay patients had significantly better EQOL except in PQOL and YQOL (Table 2). Patients who were older and had diabetes for a longer duration had negative impacts on HRQoL in almost all of the sub-domains which was statistically significant with the SRQOL domain (Table 2). We observed that being re-ligious was a socio-demographic variable that had the lar-gest positive and independent effects on OQOL (B = 3.07), PQOL (B = 3.22) and YQOL (B = 4.76) (Table 2). Also, being employed as compared to those unemployed and re-tired, was a significant independent determinant of OQOL (B = 2.08) and PQOL (B = 2.34). Patients who exercised more frequently per week perceived higher OQOL (ad-justed B = 1.31), SRQOL (ad(ad-justed B = 2.38), and EQOL (adjusted B = 1.99).
Clinical parameters and quality of life
Having co-morbidities and diabetes-related complica-tions would reduce WHOQOL-BREF scores (Table 2). Dyslipidaemia was shown to have significant independ-ent negative impacts on YQOL (B =−3.14) and EQOL (B =−2.78). Although hypertension showed a positive ef-fect on SRQOL (Table 2), MacroCx caused consistent negative and independent effects on HRQoL, OQOL (B =−4.98, 95 % CI−8.56 to−1.40) and EQOL (B =−4.38, 95 % CI−8.30 to−0.46).
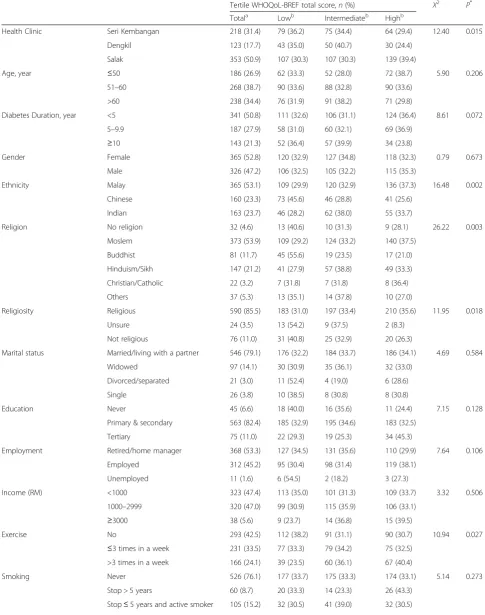
Table 1The socio-demographic and clinical characteristics according to the tertile of the World Health Organization Quality of Life- Brief (WHOQOL-BREF)
Tertile WHOQoL-BREF total score,n(%) X2
P* Totala Lowb Intermediateb Highb
Health Clinic Seri Kembangan 218 (31.4) 79 (36.2) 75 (34.4) 64 (29.4) 12.40 0.015
Dengkil 123 (17.7) 43 (35.0) 50 (40.7) 30 (24.4)
Salak 353 (50.9) 107 (30.3) 107 (30.3) 139 (39.4)
Age, year ≤50 186 (26.9) 62 (33.3) 52 (28.0) 72 (38.7) 5.90 0.206
51–60 268 (38.7) 90 (33.6) 88 (32.8) 90 (33.6)
>60 238 (34.4) 76 (31.9) 91 (38.2) 71 (29.8)
Diabetes Duration, year <5 341 (50.8) 111 (32.6) 106 (31.1) 124 (36.4) 8.61 0.072
5–9.9 187 (27.9) 58 (31.0) 60 (32.1) 69 (36.9)
≥10 143 (21.3) 52 (36.4) 57 (39.9) 34 (23.8)
Gender Female 365 (52.8) 120 (32.9) 127 (34.8) 118 (32.3) 0.79 0.673
Male 326 (47.2) 106 (32.5) 105 (32.2) 115 (35.3)
Ethnicity Malay 365 (53.1) 109 (29.9) 120 (32.9) 136 (37.3) 16.48 0.002
Chinese 160 (23.3) 73 (45.6) 46 (28.8) 41 (25.6)
Indian 163 (23.7) 46 (28.2) 62 (38.0) 55 (33.7)
Religion No religion 32 (4.6) 13 (40.6) 10 (31.3) 9 (28.1) 26.22 0.003
Moslem 373 (53.9) 109 (29.2) 124 (33.2) 140 (37.5)
Buddhist 81 (11.7) 45 (55.6) 19 (23.5) 17 (21.0)
Hinduism/Sikh 147 (21.2) 41 (27.9) 57 (38.8) 49 (33.3)
Christian/Catholic 22 (3.2) 7 (31.8) 7 (31.8) 8 (36.4)
Others 37 (5.3) 13 (35.1) 14 (37.8) 10 (27.0)
Religiosity Religious 590 (85.5) 183 (31.0) 197 (33.4) 210 (35.6) 11.95 0.018
Unsure 24 (3.5) 13 (54.2) 9 (37.5) 2 (8.3)
Not religious 76 (11.0) 31 (40.8) 25 (32.9) 20 (26.3)
Marital status Married/living with a partner 546 (79.1) 176 (32.2) 184 (33.7) 186 (34.1) 4.69 0.584
Widowed 97 (14.1) 30 (30.9) 35 (36.1) 32 (33.0)
Divorced/separated 21 (3.0) 11 (52.4) 4 (19.0) 6 (28.6)
Single 26 (3.8) 10 (38.5) 8 (30.8) 8 (30.8)
Education Never 45 (6.6) 18 (40.0) 16 (35.6) 11 (24.4) 7.15 0.128
Primary & secondary 563 (82.4) 185 (32.9) 195 (34.6) 183 (32.5)
Tertiary 75 (11.0) 22 (29.3) 19 (25.3) 34 (45.3)
Employment Retired/home manager 368 (53.3) 127 (34.5) 131 (35.6) 110 (29.9) 7.64 0.106
Employed 312 (45.2) 95 (30.4) 98 (31.4) 119 (38.1)
Unemployed 11 (1.6) 6 (54.5) 2 (18.2) 3 (27.3)
Income (RM) <1000 323 (47.4) 113 (35.0) 101 (31.3) 109 (33.7) 3.32 0.506
1000–2999 320 (47.0) 99 (30.9) 115 (35.9) 106 (33.1)
≥3000 38 (5.6) 9 (23.7) 14 (36.8) 15 (39.5)
Exercise No 293 (42.5) 112 (38.2) 91 (31.1) 90 (30.7) 10.94 0.027
≤3 times in a week 231 (33.5) 77 (33.3) 79 (34.2) 75 (32.5)
>3 times in a week 166 (24.1) 39 (23.5) 60 (36.1) 67 (40.4)
Smoking Never 526 (76.1) 177 (33.7) 175 (33.3) 174 (33.1) 5.14 0.273
Stop > 5 years 60 (8.7) 20 (33.3) 14 (23.3) 26 (43.3)
Table 1The socio-demographic and clinical characteristics according to the tertile of the World Health Organization Quality of Life- Brief
(WHOQOL-BREF)(Continued)
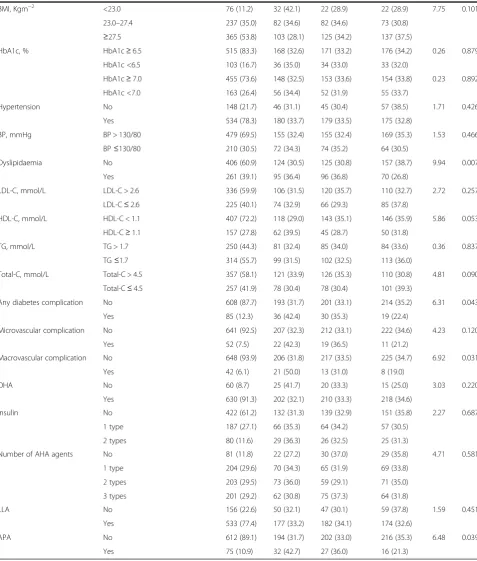
BMI, Kgm−2 <23.0 76 (11.2) 32 (42.1) 22 (28.9) 22 (28.9) 7.75 0.101
23.0–27.4 237 (35.0) 82 (34.6) 82 (34.6) 73 (30.8)
≥27.5 365 (53.8) 103 (28.1) 125 (34.2) 137 (37.5)
HbA1c, % HbA1c≥6.5 515 (83.3) 168 (32.6) 171 (33.2) 176 (34.2) 0.26 0.879
HbA1c <6.5 103 (16.7) 36 (35.0) 34 (33.0) 33 (32.0)
HbA1c≥7.0 455 (73.6) 148 (32.5) 153 (33.6) 154 (33.8) 0.23 0.892
HbA1c <7.0 163 (26.4) 56 (34.4) 52 (31.9) 55 (33.7)
Hypertension No 148 (21.7) 46 (31.1) 45 (30.4) 57 (38.5) 1.71 0.426
Yes 534 (78.3) 180 (33.7) 179 (33.5) 175 (32.8)
BP, mmHg BP > 130/80 479 (69.5) 155 (32.4) 155 (32.4) 169 (35.3) 1.53 0.466
BP≤130/80 210 (30.5) 72 (34.3) 74 (35.2) 64 (30.5)
Dyslipidaemia No 406 (60.9) 124 (30.5) 125 (30.8) 157 (38.7) 9.94 0.007
Yes 261 (39.1) 95 (36.4) 96 (36.8) 70 (26.8)
LDL-C, mmol/L LDL-C > 2.6 336 (59.9) 106 (31.5) 120 (35.7) 110 (32.7) 2.72 0.257
LDL-C≤2.6 225 (40.1) 74 (32.9) 66 (29.3) 85 (37.8)
HDL-C, mmol/L HDL-C < 1.1 407 (72.2) 118 (29.0) 143 (35.1) 146 (35.9) 5.86 0.053
HDL-C≥1.1 157 (27.8) 62 (39.5) 45 (28.7) 50 (31.8)
TG, mmol/L TG > 1.7 250 (44.3) 81 (32.4) 85 (34.0) 84 (33.6) 0.36 0.837
TG≤1.7 314 (55.7) 99 (31.5) 102 (32.5) 113 (36.0)
Total-C, mmol/L Total-C > 4.5 357 (58.1) 121 (33.9) 126 (35.3) 110 (30.8) 4.81 0.090
Total-C≤4.5 257 (41.9) 78 (30.4) 78 (30.4) 101 (39.3)
Any diabetes complication No 608 (87.7) 193 (31.7) 201 (33.1) 214 (35.2) 6.31 0.043
Yes 85 (12.3) 36 (42.4) 30 (35.3) 19 (22.4)
Microvascular complication No 641 (92.5) 207 (32.3) 212 (33.1) 222 (34.6) 4.23 0.120
Yes 52 (7.5) 22 (42.3) 19 (36.5) 11 (21.2)
Macrovascular complication No 648 (93.9) 206 (31.8) 217 (33.5) 225 (34.7) 6.92 0.031
Yes 42 (6.1) 21 (50.0) 13 (31.0) 8 (19.0)
OHA No 60 (8.7) 25 (41.7) 20 (33.3) 15 (25.0) 3.03 0.220
Yes 630 (91.3) 202 (32.1) 210 (33.3) 218 (34.6)
Insulin No 422 (61.2) 132 (31.3) 139 (32.9) 151 (35.8) 2.27 0.687
1 type 187 (27.1) 66 (35.3) 64 (34.2) 57 (30.5)
2 types 80 (11.6) 29 (36.3) 26 (32.5) 25 (31.3)
Number of AHA agents No 81 (11.8) 22 (27.2) 30 (37.0) 29 (35.8) 4.71 0.581
1 type 204 (29.6) 70 (34.3) 65 (31.9) 69 (33.8)
2 types 203 (29.5) 73 (36.0) 59 (29.1) 71 (35.0)
3 types 201 (29.2) 62 (30.8) 75 (37.3) 64 (31.8)
LLA No 156 (22.6) 50 (32.1) 47 (30.1) 59 (37.8) 1.59 0.451
Yes 533 (77.4) 177 (33.2) 182 (34.1) 174 (32.6)
APA No 612 (89.1) 194 (31.7) 202 (33.0) 216 (35.3) 6.48 0.039
Yes 75 (10.9) 32 (42.7) 27 (36.0) 16 (21.3)
*
Chi-squarePvalue
BPblood pressure,LDL-Clow-density lipoprotein cholesterol,HDL-Chigh-density lipoprotein cholesterol,TGtriglycerides,Total-Ctotal cholesterol,AHA anti-hypertensive agent,BMIbody mass index,BPblood pressure,APAanti-platelet agent,OHAoral hypoglycaemic agent,LDL-Clow density lipoprotein- cholesterol,
HDL-Chigh density lipoprotein- cholesterol,LLAlipid-lowering agent,RMRinggit Malaysia,TGtriglyceride,Total-Ctotal-cholesterol,WHOQoL-BREFWorld Health Organization Quality of Life-Brief 26 items
a
Column percentage b
Row percentage
(B =−4.51) and Total-C on EQOL (B =−1.04). Pa-tients who were on OHA compared to those not tak-ing any OHA were reported to have better HRQoL, and the most significant positive effect was seen on PQOL (Table 2).
Diabetes-related distress, depressive symptoms and quality of life
The mean (SD) for total DDS-17 score was 37.1 (15.98) with 19.6 % (136/694) had moderate distress. Both higher DRD and DS were associated with lower HRQoL,
0 10 20 30 40 50 60
How would you rate your quality of life? N= 700
How satisfied are you with your health? N= 698
Percentage
very poor/very dissatisfied
poor/dissatisfied
neither
good/satisfied
very good/very satisfied
Fig. 1The proportion of responses to the first two items of the WHOQOL-BREF on the overall perception of health. WHOQOL-BREF= World
Health Organization Quality of Life- Brief
Fig. 2The WHOQOL-BREF mean (95 % confidence interval) of the total and domain score according to the three primary healthcare clinics
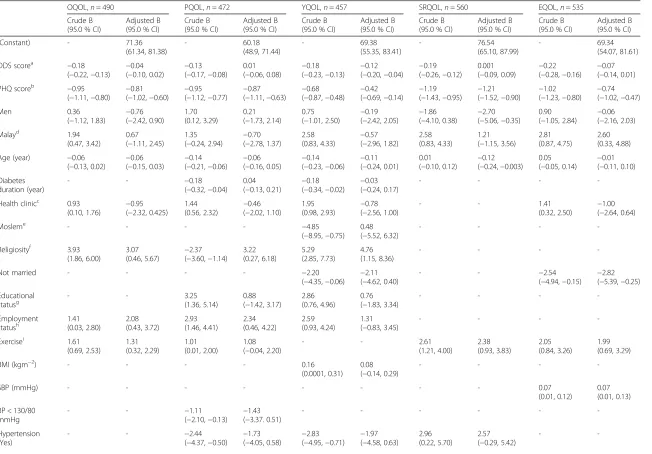
Table 2The determinants of the health-related quality of life measured by the World Health Organization Quality of Life- Brief (WHOQOL-BREF)
OQOL,n= 490 PQOL,n= 472 YQOL,n= 457 SRQOL,n= 560 EQOL,n= 535
Crude B (95.0 % CI)
Adjusted B (95.0 % CI)
Crude B (95.0 % CI)
Adjusted B (95.0 % CI)
Crude B (95.0 % CI)
Adjusted B (95.0 % CI)
Crude B (95.0 % CI)
Adjusted B (95.0 % CI)
Crude B (95.0 % CI)
Adjusted B (95.0 % CI)
(Constant) - 71.36
(61.34, 81.38) - 60.18 (48.9, 71.44) - 69.38 (55.35, 83.41) - 76.54 (65.10, 87.99) - 69.34 (54.07, 81.61)
DDS scorea
−0.18
(−0.22,−0.13) − 0.04
(−0.10, 0.02) − 0.13 (−0.17,−0.08)
0.01
(−0.06, 0.08) − 0.18
(−0.23,−0.13) − 0.12
(−0.20,−0.04) − 0.19 (−0.26,−0.12)
0.001
(−0.09, 0.09) − 0.22
(−0.28,−0.16) − 0.07 (−0.14, 0.01)
PHQ scoreb −0.95
(−1.11,−0.80) − 0.81
(−1.02,−0.60) − 0.95
(−1.12,−0.77) − 0.87
(−1.11,−0.63) − 0.68
(−0.87,−0.48) − 0.42
(−0.69,−0.14) − 1.19
(−1.43,−0.95) − 1.21
(−1.52,−0.90) − 1.02
(−1.23,−0.80) − 0.74 (−1.02,−0.47)
Men 0.36
(−1.12, 1.83) − 0.76 (−2.42, 0.90)
1.70 (0.12, 3.29)
0.21 (−1.73, 2.14)
0.75
(−1.01, 2.50) − 0.19
(−2.42, 2.05) − 1.86
(−4.10, 0.38) − 2.70 (−5.06,−0.35)
0.90
(−1.05, 2.84) − 0.06 (−2.16, 2.03)
Malayd 1.94
(0.47, 3.42)
0.67 (−1.11, 2.45)
1.35
(−0.24, 2.94) − 0.70 (−2.78, 1.37)
2.58
(0.83, 4.33) − 0.57 (−2.96, 1.82)
2.58 (0.83, 4.33)
1.21 (−1.15, 3.56)
2.81 (0.87, 4.75)
2.60 (0.33, 4.88)
Age (year) −0.06
(−0.13, 0.02) − 0.06
(−0.15, 0.03) − 0.14
(−0.21,−0.06) − 0.06
(−0.16, 0.05) − 0.14
(−0.23,−0.06) − 0.11 (−0.24, 0.01)
0.01
(−0.10, 0.12) − 0.12 (−0.24,−0.003)
0.05
(−0.05, 0.14) − 0.01 (−0.11, 0.10)
Diabetes duration (year)
- - −0.18
(−0.32,−0.04) 0.04
(−0.13, 0.21) − 0.18
(−0.34,−0.02) − 0.03 (−0.24, 0.17)
- - -
-Health clinicc 0.93
(0.10, 1.76) − 0.95 (−2.32, 0.425)
1.44
(0.56, 2.32) − 0.46 (−2.02, 1.10)
1.95
(0.98, 2.93) − 0.78 (−2.56, 1.00)
- - 1.41
(0.32, 2.50) − 1.00 (−2.64, 0.64)
Mosleme - - - - −4.85
(−8.95,−0.75) 0.48 (−5.52, 6.32)
- - -
-Religiosityf 3.93 (1.86, 6.00)
3.07
(0.46, 5.67) − 2.37 (−3.60,−1.14)
3.22 (0.27, 6.18) 5.29 (2.85, 7.73) 4.76 (1.15, 8.36) - - -
-Not married - - - - −2.20
(−4.35,−0.06) − 2.11 (−4.62, 0.40)
- - −2.54
(−4.94,−0.15) − 2.82 (−5.39,−0.25)
Educational statusg
- - 3.25
(1.36, 5.14)
0.88 (−1.42, 3.17)
2.86 (0.76, 4.96)
0.76 (−1.83, 3.34)
- - -
-Employment
statush 1.41(0.03, 2.80) 2.08(0.43, 3.72) 2.93(1.46, 4.41) 2.34(0.46, 4.22) 2.59(0.93, 4.24) 1.31( −0.83, 3.45)
- - -
-Exercisei 1.61 (0.69, 2.53) 1.31 (0.32, 2.29) 1.01 (0.01, 2.00) 1.08 (−0.04, 2.20)
- - 2.61
(1.21, 4.00) 2.38 (0.93, 3.83) 2.05 (0.84, 3.26) 1.99 (0.69, 3.29)
BMI (kgm−2) - - - - 0.16
(0.0001, 0.31) 0.08 (−0.14, 0.29)
- - -
-SBP (mmHg) - - - 0.07
(0.01, 0.12)
0.07 (0.01, 0.13)
BP < 130/80 mmHg
- - −1.11
(−2.10,−0.13) − 1.43 (−3.37. 0.51)
- - -
-Hypertension (Yes)
- - −2.44
(−4.37,−0.50) − 1.73
(−4.05, 0.58) − 2.83
(−4.95,−0.71) − 1.97 (−4.58, 0.63)
2.96 (0.22, 5.70)
2.57 (−0.29, 5.42)
HDL-C (mmol/L) −3.82
(−6.34,−1.31) − 2.71
(−5.49, 0.06) − 7.17
(−9.86,−4.48) − 4.51
(−7.58,−1.44) − 3.96
(−6.94,−0.99) − 1.42 (−4.91, 2.07)
- - -
-Total-C (mmol/L) −0.72 (−1.40,−0.05)
−0.19 (−0.91, 0.54)
- - - - −1.09
(−2.11,−0.08) −0.63 (−1.65, 0.40)
−0.90 (−1.80,−0.01)
−1.04 (−1.94,−0.15)
Dyslipidaemia
(Yes) −
2.18
(−3.71,−0.65) − 1.53
(−3.52, 0.46) − 1.98 (−3.61,−0.34)
0.32
(−1.96, 2.59) − 4.75
(−6.54,−2.96) − 3.14 (−5.78,−0.50)
- - −3.76
(−5.75,−1.76) − 2.78 (−4.48,−0.07)
MicroCx (Yes) - - - - −3.28
(−6.66, 0.003)
−0.07 (−2.78, 2.64)
- - −4.34
(−7.99,−0.70) −1.40 (−4.28, 1.48)
MacroCx (Yes) −4.31
(−7.38,−1.23) − 4.98
(−8.56,−1.40) − 4.45
(−7.77,−1.13) − 3.50
(−7.36, 0.37) − 4.80
(−8.45,−1.14) − 4.45 (−9.42, 0.52)
- - −4.44
(−8.51,−0.38) − 4.38 (−8.30,−0.46)
OHA (Yes) 3.02 (0.41, 5.63)
1.56 (−1.40, 4.51)
3.42 (0.62, 6.21)
3.82 (0.43, 7.21)
- - 5.37
(1.42, 9.31)
3.01 (−1.24, 7.26)
-
-APA (Yes) −2.73 (−5.10,−0.37)
0.13
(−2.56, 2.81) − 3.35
(−5.89,−0.81) − 1.53
(−4.65, 1.59) − 5.28
(−8.08,−2.49) − 0.15 (−3.73, 3.42)
- - -
-Bs are unstandardized coefficients
OQOLoverall quality of life,PQOLphysical quality of life,YQOLpsychological quality of life,SRQOLsocial relationships quality of life,EQOLenvironment quality of life,AHAanti-hypertensive agent,APAanti-platelet agent,BCoefficients,CBGcasual blood glucose,BMIbody mass index,CIconfidence interval,DDSdiabetes distress scale,MacroCxmacrovascular complication,MicroCxmicrovascular complication,OHAoral hypoglycaemic agent,PHQpatient health questionnaire,SBPsystolic blood pressure,Total-Ctotal cholesterol
a
Total DDS scores range from 17 to 102
b
Total PHQ-9 scores range from 0 to 27
c
Health clinic = Seri Kembangan (1), Dengkil (2), Salak (3)
d
Non-Malay as reference
e
Non-Moslem as reference
f
Non-religious as reference
g
Educational status = never (0), primary & secondary (1), tertiary and above (2)
h
Employment status = unemployed (0), retired (1), employed (2)
i
Exercise = no (0), at most three times per week (1), more than three times per week (2)
Health
and
Quality
of
Life
Outcomes
(2015) 13:187
Page
10
of
especially on the YQOL (Table 2). DS showed more con-sistent, negative and independent effects across all the domains of HRQoL in comparison with DRD.
Discussion
This study examined the HRQoL and its determinants in adults with T2D at the primary care level. WHOQOL-BREF was used instead of the disease-specific measure in order to determine the wider life impacts of T2D on pa-tients which was rarely studied in the past. Nevertheless, in addition to the DS assessment a disease specific meas-ure for distress, the DDS-17, was included in the present study.
It was disturbing to find that the mean score for PQOL was the lowest followed by YQOL. PQOL which repre-sented physical functions, disability and needs showed that adult patients with T2D required much care for their pain, sleep and mobility. They also lacked of support from others to satisfactorily perform their daily activities. Phys-ical problems such as pain, discomfort, and diet restric-tions were also known to cause major problems in adult patients with T2D who were treated at primary care level in Singapore [50]. Perhaps more practical and psycho-logical supports are needed to alleviate their perception on the burden of taking medication in order to improve their confidence when performing house chores and working. The findings on the YQOL domain revealed that adult patients with T2D experienced negative feelings (blue moods, despair, anxiety etc.) at primary care level which resulted in the inability to concentrate or enjoy a meaningful life. These two domains of poor physical and mental health had also been reported to have caused a median of 2 (IQR 0–10) unhealthy days in the past month among Irish patients with diabetes mellitus [51].
The SRQOL was the least affected among all the WHOQOL-BREF domains, and this was probably due to the prevalent of social support [52], culture [53], and family values such as filial piety in this country and re-gion [54, 55]. However, these findings and values are not restricted to this study and region [25]. The perception on the quality of environment, living conditions, and ac-cess to transport and healthcare was categorised as mod-erate to good, and this was probably due to modmod-erate ways of living and the culture of accepting current situa-tions or fates. Although these personal attitudes and vir-tues could pose real barriers to diabetes care [56], it was uncertain whether having these qualities would help the patients to face life challenges and contribute to the high (about one third) responses of neither good nor dissatis-fied in the first two items of WHOQOL-BREF.
Socio-demographic profile and quality of life
Men with T2D were generally experienced lower HRQoL and significantly so in SRQOL except in PQOL. It was
possible that these men were almost inherently the bread-winners of their families and were required to be out-and-about, and were less likely to complain or per-ceive themselves to be in need of basic help (just like men in most cultures). Hence, there was no association between these men and the physical domain of HRQoL [57]. In relation to men’s emotional ability [58], it was noted that they experienced the poorest SRQOL that re-quired emotional skills for interpersonal relationships and the management of emotions. These findings were in contrast to the men with T2D from multi-ethnic backgrounds (non-Hispanic whites, African-Americans, Asian-Indians, and Hispanics) in Texas, United States (US) who were reported to have better diabetes-specific HRQoL compared to the women [55]. In another study, women who perceived living with diabetes as predomin-antly stressful intermingled with depressive feelings were required to be constantly vigilant about healthy eating, self-concern, and fatigue [3]. In this study, it was noted that HRQoL was better perceived by women because T2D had more adverse impacts on men, or the men’s perception could be limited by their emotional ability [58]. However, future studies are needed to confirm this and to examine the causes of low HRQoL among men with T2D.
Compared to other ethnic groups, Malay patients had a significantly better perception of their HRQoL in the univariable analyses. It was only statistically significant in the EQOL after the other covariates were adjusted and was negatively associated with the PQOL and YQOL domains (not reaching statistical significance). It was believed that this is closer to the actual states found in adults with T2D compared to the previous studies that reported positive association between Malays and their emotional and mental health status [59–61]. These past studies were limited by inadequate adjustments [59], loss of data quality due to the heterogeneity of the population (not specific to T2D), categorization of con-tinuous outcome data and data-driven analysis [60, 61]. The Malays experienced better HRQoL, and this could be due to being more religious and having better social support network when faced with the external challenges of living with T2D [53, 60]. Nevertheless, self-care is pa-tently a personal issue, and the impacts of changed life routines due to T2D are irrespective of ethnicity as evi-denced by the non-significant differential effects of eth-nicity on many HRQoL domains in the multivariable analyses.
discovered that women who were older, had diabetes for a longer duration and were unmarried were the predic-tors of impaired HRQoL [32]. Similar results were also reported from a Turkish setting where diabetes-specific HRQoL assessment tool was used (DQoL) [62], and T2D patients who were older than 40 year old, men, un-married, had diabetes for more than 5 years, suffered from complications or prior hospitalization, and had HbA1c > 7 %, a significantly poorer overall HRQoL. It was possible that T2D patients who were older or had diabetes for a longer duration had higher cardiovascular risk, were prescribed more medications (and insulin), had more scheduled visits to different medical specialists, suffered from more co-morbidities, and complications which had reduced HRQoL [63]. It was unfortunate that although social care and support were available [25], the older patients found themselves inadequate for acceptable quality of life.
Amongst all the socio-demographic variables, being a religious person was noted to be the most potent deter-minant for HRQoL. The salutogenic effects of religiosity could be linked to the privileged relationship with the Higher or Supreme Being, stronger spirituality, and hav-ing a sense of purpose in life, social network and healthy lifestyles [64–66]. The ability to adhere to one’s religion and its way of life is defined as religiosity in this study. A patient must have had some physical agility that en-abled him/her to attend places of worship and to partici-pate in ceremonies or rites. Success in fulfilling these religious requirements might greatly ease any sense of guilt and improve spiritual well-being that could further induce a sense of harmony with the Supreme Being and psychological wellness [67, 68], which indeed is an in-ternal resource for the self-management of T2D [69, 70]. Spirituality and spiritual support were the constructs that could relate to DS and affect HRQoL in T2D pa-tients [71–73]. However, more research is needed to understand the independent associations of religiosity and the differential effects of the different religions, on HRQoL.
Also, it was reassuring to find that being employed and engaged in high frequency exercise per week con-tributed to better HRQoL. Most likely active employ-ment provided economic security and social status, and the absence of either one or both factors would be detri-mental to many aspects of human living and quality of life. Since active employment was generally equated to higher socio-economic status and education, the effects of these factors on HRQoL were also reported elsewhere [30, 32, 33]. In a more optimistic note, patients who were in active vocations might feel more fulfilled when completing their jobs or attending job-related engage-ments which could be lacking if they were in the retire-ment phase.
Exercise and HRQoL have a level and multi-dimensional association, and the effects are beneficial to patients with T2D [74]. In a nationwide survey in the US, it was observed that a self-reported exercise was the only significant self-management behaviour to predict HRQoL after controlling the demographic and medical variables [26]. Physiologically, exercise or physical activ-ity stimulates the release of endorphin that induces and facilitates a sense of elation, relaxation, and well-being [75]. Psychologically, when T2D patients adhere closely to the advice to exercise regularly, this may encourage a sense of compliance and harmonious relationship with their healthcare professionals and significant others [9]. In return, regular and increased frequency of exercise could also increase the social connectivity between the patients, their family members and friends, and also improve their physical health [76].
Clinical parameters and quality of life
The negative and independent effects of MacroCx on OQOL were not unexpected because the consequences of IHD and stroke on patients’ daily life activities are known to many [29, 77]. In contrast, the more subtle and minimal the impacts of the early stages of MicroCx would explain the lack of its effects on HRQoL. Similar findings were also reported with diabetes patients at pri-mary care from the Nordic countries [28], Greece [32] and Malaysia [61]. Although many different QoL mea-sures were used in these studies, the results showed consistency and strong negative effects of MacroCx, espe-cially coronary heart disease on HRQoL while weaker pre-dictors were MicroCx, older age, women, lower education, lower income, normotensive and high HbA1c [28].
not uncommon to find the non-association between these biomarkers and HRQoL, or psychosocial variables such as social support, self-esteem and psychological well-being [78–80] in past literature. This discrepancy might be due to the different HRQoL measures used in the different studies [22].
It is difficult to hypothesise the negative effects of lower SBP, HDL-C, and OHA use on WHOQOL-BREF. For the BP target and HDL-C, it was possible to learn that that patients who had healthy diets and exercised regularly faced the physical and external barriers repre-sented in the PQOL and EQOL domains. In the case of OHA use and better PQOL, it might be that the use of OHA had ameliorated the physical symptoms of uncon-trolled diabetes mellitus leading to improved physical functioning of daily activities, sleep and concentration. Similar observations were reported in newly diagnosed Dutch patients in general practices who showed im-proved vitality scores and HRQoL following the first year treatment for their diabetes [81]. A recent systematic re-view suggested that a greater HRQoL could be gained if insulin or newer injectable agents (glucagon-like peptide agonists and analogues, amylin analogues) were added to the patient’s medication regimen rather than another OHA (e.g., adding sitagliptin or pioglitazone to metfor-min only) [82]. Unobserved determetfor-minants could probably explain the associations between treatment targets and HRQoL, particularly the SBP and its positive effects on the EQOL, such as the different geographic and social factors [83], dispositional optimistic personality and goal adjustment [84]. Also, being less critical to other people’s comments and having a could-not-care-less attitude to-wards one’s health [85, 86]. Alternatively, it is also pos-sible that the indicators of the disease control and health were relatively less important as compared to MacroCx and/or MicroCx. the outcomes of poor disease control, on HRQoL [87] and hence resulted in the diverged asso-ciations between them.
Diabetes-related distress, depressive symptoms and quality of life
Both DRD and DS were associated with lower HRQoL, especially on the YQOL. A Chinese study reported that emotional distress was the most important explanatory factor for quality of life which amounted to 28.7–53.8 % of the total variance [88]. However, this study showed that DS instead of DRD had a more consistent, negative, and independent effect across all the domains of HRQoL. Similar patterns of association were also reported by Carper et al. who stated that DS severity (assessed with Montgomery Asberg Depression Rating Scale) was as-sociated with poorer HRQoL (measured with Quality of Life Inventory), specifically on the achievement, psychosocial growth and environment domains while
DRD was associated with poorer HRQoL on the achieve-ment domain [89]. The results of the present study sug-gested that DRD and DS were related, but were distinct constructs [47] associated with the various aspects of HRQoL that were beyond demographic and clinical factors.
Sundaram et al. reported the pervasive effects of DS among adult patients with T2D on a number of QoL measures that included the generic health status (12-item Short-Form Health Survey [SF-12] and EQ-5D) and diabetes-specific QoL (Audit of Diabetes Dependent Quality of Life) [90]. The degree of diabetes-specific QoL perception was reported to be associated with the severity of DS (r= 0.503;p< 0.001) among Brazilian patients with T2D [78]. Similarly, DS (measured with SF-12 Mental Component Score) among the elderly German patients with T2D was one of the independent predictors for HRQoL [91]. Besides DS, other mental disorders such as anxiety and schizophrenia had also been reported to be significant predictors for poorer diabetes-specific QoL [92].
These findings confirm the past reports on the preva-lent and intimate relationships between the domains of HRQoL and emotions (DRD and DS), psychological well-being, and social functioning in adult patients with T2D [28]. By providing effective psychological support for DRD and DS, HRQoL may benefit to a large extent. Since evidence showed that DRD had preceded DS [93], and that DRD was both milder and more common in primary care as compared to DS [94], it would be a wise therapeutic and preventive opportunity to intervene for DRD in order to reduce the DS and its distal adverse ef-fects and complications. An intervention for a relatively non-complicated psychological disorder such as DRD could probably be addressed with a less complex programme and competently delivered by the paramedics.
Limitations and strengths
Adopting a generic measure for HRQoL would cause some limitations and bring different interpretations. It was possible for T2D patients to report high levels of HRQoL in general, but poor HRQoL meant the patients were impaired by diabetes [95]. During clinical consulta-tions, when opportunities arise to tailor the treatments of each T2D patient for the purpose of improving the patient’s HRQoL, it is essential to differentiate between the general QoL and disease-specific HRQoL because patient’s needs might go unnoticed if the general well-being or QoL are the only outcomes measured, and if it appeared to be good [96].
[97]. Another important strength of the present study is the use of a validated and specific measure of DRD.
Conclusions
The majority of adult patients with T2D at a primary care setting had a good overall HRQoL. The independent determinants for HRQoL concurred with many of the past studies. In addition, DRD was reported to have negative effects on HRQoL. Meanwhile, religiosity had positive in-fluences on HRQoL. Adult patients with T2D who were men, non-Malay, unmarried, unemployed, from older age group, had longer duration of diabetes, dyslipidaemia, MacroCx, did not engage in frequent exercises per week, had higher levels of Total-C, who experienced DRD and DS had lower HRQoL needed additional supports. Timely and less complex psychological intervention at primary care level could be prioritised for the right and most needy adult patients with T2D to improve their life experiences and HRQoL.
Abbreviations
AHA:Anti-hypertensive agents; BMI: Body mass index; DDS-17: 17-items diabetes distress; DK: Dengkil health clinic; DRD: Diabetes-related distress; DS: Depressive symptoms; EQOL: Environment quality of life; HDL-C: High density lipoprotein-cholesterol; HRQoL: Health-related quality of life; LDL-C: Low density lipoprotein-cholesterol; LLA: Lipid-lowering agents; MicroCx: Microvascular complications; MacroCx: Macrovascular complications; MREC: Medical Research Ethics Committee, Ministry of Health, Malaysia; OHA: Oral hypoglycaemic agents; OQOL: Overall quality of life; PHQ-9: 9-items Patient Health Questionnaire; PQOL: Physical quality of life; QoL: Quality of life; SK: Seri Kembangan health clinic; SL: Salak health clinic; SRQOL: Social relationships quality of life; TG: Triglyceride; T2D: Type 2 diabetes; WHOQOL-BREF: World Health Organization Quality of Life- Brief; YQOL: Psychological quality of life.
Competing interests
The researchers had declared that they have no competing interests. The study sponsor had no role in the design or conduct of the study, writing of this report, or the decision to submit it for publication.
Authors’contributions
The subject matter of this study was conceived by BHC. However, SMS contributed to the conception and design of the study. While, CBH contributed to the data collection. BHC was also involved in the analysis and interpretation of the data. Furthermore, BHC, SMS and SSG contributed to the drafting of the manuscript. All researchers whose names appeared as ‘authors’in this study contributed to the refinement of the manuscript, and approved the final manuscript for the purpose of publication.
Acknowledgements
This study received its funding from the Research University Grants Scheme 2 (RUGS/04-02-2105RU). The researchers would like to acknowledge WHO for the use of WHOQOL-BREF. They would also like to express their sincere appreciation to Polonsky et al. for giving their permission for the use of the English and Chinese versions of DDS-17, Sherina Mohd-Sidik and Xiaonan Yu for the use of the Malay and Chinese versions of PHQ-9 questionnaires, respectively, the Sepang and Petaling District Health Offices and officers for their support in this study and the Director of General Health for giving his permission to publish this report. Also, a heartfelt thanks to Dr. Firdaus Mukhtar, Dr. Nor-Kasmawati Jamaludin, Dr. Noor-Hasliza Hassan and Dr. Fuziah Paimin for their input during the planning of this study and their assistance in data collection. Lastly, the researchers are entirely grateful to all the staff in the three primary healthcare clinics for their efforts in facilitating the data collection.
Author details
1
Department of Family Medicine, Faculty of Medicine and Health Sciences, Universiti Putra Malaysia, 43400 Serdang, Selangor, Malaysia.2Department of Psychiatry, Faculty of Medicine and Health Sciences, Universiti Putra Malaysia, Serdang 43400Selangor, Malaysia.
Received: 17 February 2015 Accepted: 17 November 2015
References
1. Hinder S, Greenhalgh T.“This does my head in”. Ethnographic study of self-management by people with diabetes. BMC Health Serv Res. 2012;12:83. 2. Weaver RR, Lemonde M, Payman N, Goodman WM. Health capabilities and
diabetes self-management: the impact of economic, social, and cultural resources. Soc Sci Med. 2014;102:58–68.
3. Koch T, Kralik D, Sonnack D. Women living with type II diabetes: the intrusion of illness. J Clin Nurs. 1999;8:712–22.
4. Stuckey HL, Mullan-Jensen CB, Reach G, Kovacs-Burns K, Piana N, Vallis M, et al. Personal accounts of the negative and adaptive psychosocial experiences of people with diabetes in the Second Diabetes Attitudes, Wishes and Needs (DAWN2) Study. Diabetes Care. 2014;37(9):2466–74. 5. Nicolucci A, Kovacs Burns K, Holt RI, Comaschi M, Hermanns N, Ishii H, et al.
Diabetes Attitudes, Wishes and Needs second study (DAWN2): cross-national benchmarking of diabetes-related psychosocial outcomes for people with diabetes. Diabet Med. 2013;30:767–77.
6. Naranjo D, Hessler DM, Deol R, Chesla CA. Health and psychosocial outcomes in U.S. adult patients with diabetes from diverse ethnicities. Curr Diab Rep. 2012;12:729–38.
7. Schabert J, Browne JL, Mosely K, Speight J. Social stigma in diabetes: a framework to understand a growing problem for an increasing epidemic. Patient. 2013;6:1–10.
8. Low LL, Tong SF, Low WY. Mixed feelings about the diagnosis of type 2 diabetes mellitus: a consequence of adjusting to health related quality of life. Coll Antropol. 2014;38:11–20.
9. West C, McDowell J. The distress experienced by people with type 2 diabetes. Br J Community Nurs. 2002;7:606–13.
10. Rasmussen NH, Smith SA, Maxson JA, Bernard ME, Cha SS, Agerter DC, et al. Association of HbA1c with emotion regulation, intolerance of uncertainty, and purpose in life in type 2 diabetes mellitus. Prim Care Diabetes. 2013;7:213–21.
11. Kneckt MC, Keinanen-Kiukaanniemi SM, Knuuttila ML, Syrjala AM. Self-esteem as a characteristic of adherence to diabetes and dental self-care regimens. J Clin Periodontol. 2001;28:175–80.
12. Kovacs Burns K, Nicolucci A, Holt RI, Willaing I, Hermanns N, Kalra S, et al. Diabetes Attitudes, Wishes and Needs second study (DAWN2): cross-national benchmarking indicators for family members living with people with diabetes. Diabet Med. 2013;30:778–88.
13. Rosland AM, Heisler M, Piette JD. The impact of family behaviors and communication patterns on chronic illness outcomes: a systematic review. J Behav Med. 2012;35:221–39.
14. Browne JL, Ventura A, Mosely K, Speight J.‘I call it the blame and shame disease’: a qualitative study about perceptions of social stigma surrounding type 2 diabetes. BMJ Open. 2013;3:e003384.
15. Harvey JN, Lawson VL. The importance of health belief models in determining self-care behaviour in diabetes. Diabet Med. 2009;26:5–13. 16. Das-Munshi J, Stewart R, Ismail K, Bebbington PE, Jenkins R, Prince MJ.
Diabetes, common mental disorders, and disability: findings from the UK National Psychiatric Morbidity Survey. Psychosom Med. 2007;69:543–50. 17. Gentili P, Maldonato A, Grieco R, Santini A. Influence of patients’
representations and beliefs about diabetes and its treatment on their adherence to therapy. Diabetes Nutr Metab. 2001;14:140–52. 18. Rose M, Fliege H, Hildebrandt M, Schirop T, Klapp BF. The network of
psychological variables in patients with diabetes and their importance for quality of life and metabolic control. Diabetes Care. 2002;25:35–42. 19. Ismail K, Sloggett A, De Stavola B. Do common mental disorders increase
cigarette smoking? Results from five waves of a population-based panel cohort study. Am J Epidemiol. 2000;152:651–7.
21. Bradley C, Speight J. Patient perceptions of diabetes and diabetes therapy: assessing quality of life. Diabetes Metab Res Rev. 2002;18 Suppl 3:S64–9. 22. Speight J, Reaney MD, Barnard KD. Not all roads lead to Rome-a review
of quality of life measurement in adults with diabetes. Diabet Med. 2009;26:315–27.
23. Rubin RR, Peyrot M. Quality of life and diabetes. Diabetes Metab Res Rev. 1999;15:205–18.
24. Imayama I, Plotnikoff RC, Courneya KS, Johnson JA. Determinants of quality of life in adults with type 1 and type 2 diabetes. Health Qual Life Outcomes. 2011;9:115.
25. Misra R, Lager J. Predictors of quality of life among adults with type 2 diabetes mellitus. J Diabetes Complications. 2008;22:217–23.
26. Glasgow RE, Ruggiero L, Eakin EG, Dryfoos J, Chobanian L. Quality of life and associated characteristics in a large national sample of adults with diabetes. Diabetes Care. 1997;20:562–7.
27. Wexler D, Grant R, Wittenberg E, Bosch J, Cagliero E, Delahanty L, et al. Correlates of health-related quality of life in type 2 diabetes. Diabetologia. 2006;49:1489–97.
28. Wandell PE. Quality of life of patients with diabetes mellitus. An overview of research in primary health care in the Nordic countries. Scand J Prim Health Care. 2005;23:68–74.
29. Solli O, Stavem K, Kristiansen IS. Health-related quality of life in diabetes: the associations of complications with EQ-5D scores. Health Qual Life Outcomes. 2010;8:18.
30. Huang MC, Hung CH. Quality of life and its predictors for middle-aged and elderly patients with type 2 diabetes mellitus. J Nurs Res. 2007;15:193–201. 31. Bourdel-Marchasson I, Druet C, Helmer C, Eschwege E, Lecomte P, Le-Goff M, et al. Correlates of health-related quality of life in French people with type 2 diabetes. Diabetes Res Clin Pract. 2013;101:226–35.
32. Papadopoulos AA, Kontodimopoulos N, Frydas A, Ikonomakis E, Niakas D. Predictors of health-related quality of life in type II diabetic patients in Greece. BMC Public Health. 2007;7:186.
33. Kiadaliri AA, Najafi B, Mirmalek-Sani M. Quality of life in people with diabetes: a systematic review of studies in Iran. J Diabetes Metab Disord. 2013;12:54.
34. Al Hayek AA, Robert AA, Al Saeed A, Alzaid AA, Al Sabaan FS. Factors associated with health-related quality of life among Saudi patients with type 2 diabetes mellitus: a cross-sectional survey. Diabetes Metab J. 2014;38:220–9.
35. WHO Consultation. Definition, diagnosis and classification of diabetes mellitus and its complications. In: Part 1: diagnosis and classification of diabetes mellitus. Geneva: World Health Organization; 1999. Report no. 99.2.
36. Ministry of Health Malaysia. Management of Type 2 Diabetes Mellitus. Putrajaya: Technology, Health Section, Assessment Division, Medical Development; 2009.
37. American Diabetes Association. Standards of medical care in diabetes—2015. Diabetes Care. 2015;38:S1–93.
38. The WHOQOL Group. Development of the World Health Organization WHOQOL-BREF quality of life assessment. Psychol Med. 1998;28:551–8. 39. Skevington SM, Lotfy M, O’Connell KA. The World Health Organization’s
WHOQOL-BREF quality of life assessment: psychometric properties and results of the international field trial. A report from the WHOQOL group. Qual Life Res. 2004;13:299–310.
40. Hasanah CI, Naing L, Rahman AR. World Health Organization quality of life assessment: brief version in Bahasa Malaysia. Med J Malaysia. 2003;58:79–88.
41. Polonsky WH, Fisher L, Earles J, Dudl RJ, Lees J, Mullan J, et al. Assessing psychosocial distress in diabetes: development of the diabetes distress scale. Diabetes Care. 2005;28:626–31.
42. El Achhab Y, Nejjari C, Chikri M, Lyoussi B. Disease-specific health-related quality of life instruments among adults diabetic: a systematic review. Diabetes Res Clin Pract. 2008;80:171–84.
43. Chew BH, Mukhtar F, Sherina MS, Paimin F, Hassan NH, Jamaludin NK. The 17-items diabetes distress scale: translation and validation of the Malay version. Malays Fam Physician. 2015;10(2):22–34. [In Press]
44. Ting RZ, Nan H, Yu MW, Kong AP, Ma RC, Wong RY, et al. Diabetes-related distress and physical and psychological health in Chinese type 2 diabetic patients. Diabetes Care. 2011;34:1094–6.
45. Kroenke K, Spitzer RL, Williams JB. The PHQ-9: validity of a brief depression severity measure. J Gen Intern Med. 2001;16:606–13.
46. Sherina MS, Arroll B, Goodyear-Smith F. Criterion validity of the PHQ-9 (Malay version) in a primary care clinic in Malaysia. Med J Malaysia. 2012;67:309–15.
47. Fisher L, Mullan JT, Arean P, Glasgow RE, Hessler D, Masharani U. Diabetes distress but not clinical depression or depressive symptoms is associated with glycemic control in both cross-sectional and longitudinal analyses. Diabetes Care. 2010;33:23–8.
48. Yu X, Tam WW, Wong PT, Lam TH, Stewart SM. The Patient Health Questionnaire-9 for measuring depressive symptoms among the general population in Hong Kong. Compr Psychiatry. 2012;53:95–102.
49. van Bastelaar KM, Pouwer F, Geelhoed-Duijvestijn PH, Tack CJ, Bazelmans E, Beekman AT, et al. Diabetes-specific emotional distress mediates the association between depressive symptoms and glycaemic control in Type 1 and Type 2 diabetes. Diabet Med. 2010;27:798–803.
50. Shim YT, Lee J, Toh MP, Tang WE, Ko Y. Health-related quality of life and glycaemic control in patients with Type 2 diabetes mellitus in Singapore. Diabet Med. 2012;29:e241–8.
51. Clifford EL, Collins MM, Buckley CM, Fitzgerald AP, Perry IJ. Unhealthy days and quality of life in Irish patients with diabetes. PLoS One. 2013;8:e81102. 52. Chew BH, Khoo EM, Chia YC. Social support and glycemic control in adult
patients with type 2 diabetes mellitus. Asia Pac J Public Health. 2011. [Epub ahead of print].
53. Chew BH, Khoo EM, Chia YC. Does religious affiliation influence glycaemic control in primary care patients with type 2 diabetes mellitus? Ment Health Fam Med. 2011;8:21–8.
54. Lee YK, Low WY, Ng CJ. Exploring patient values in medical decision making: a qualitative study. PLoS One. 2013;8:e80051.
55. Misra R, Lager J. Ethnic and gender differences in psychosocial factors, glycemic control, and quality of life among adult type 2 diabetic patients. J Diabetes Complications. 2009;23:54–64.
56. Simmons D, Weblemoe T, Voyle J, Prichard A, Leakehe L, Gatland B. Personal barriers to diabetes care: lessons from a multi-ethnic community in New Zealand. Diabet Med. 1998;15:958–64.
57. Koch T, Kralik D, Taylor J. Men living with diabetes: minimizing the intrusiveness of the disease. J Clin Nurs. 2000;9:247–54.
58. Kring AM, Gordon AH. Sex differences in emotion: expression, experience, and physiology. J Pers Soc Psychol. 1998;74(3):686–703.
59. Cheah WL, Lee PY, Lim PY, Fatin Nabila AA, Luk KJ, Nur Irwana AT. Predictors of health related quality of life in older people with non-communicable diseases attending three primary care clinics in Malaysia. Malays Fam Physician. 2012;7:21–30.
60. Sazlina SG, Zaiton A, Nor Afiah MZ, Hayati KS. Predictors of health related quality of life in older people with non-communicable diseases attending three primary care clinics in Malaysia. J Nutr Health Aging. 2012;16:498–502.
61. Tan MC, Ng OC, Wong TW, Hejar AR, Anthony J, Sintonen H. The association of cardiovascular disease with impaired health-related quality of life among patients with type 2 diabetes mellitus. Singapore Med J. 2014;55:209–16.
62. Akinci F, Yildirim A, Gozu H, Sargin H, Orbay E, Sargin M. Assessment of health-related quality of life (HRQoL) of patients with type 2 diabetes in Turkey. Diabetes Res Clin Pract. 2008;79:117–23.
63. Koopmanschap M. Coping with Type II diabetes: the patient’s perspective. Diabetologia. 2002;45:S18–22.
64. Coruh B, Ayele H, Pugh M, Mulligan T. Does religious activity improve health outcomes? A critical review of the recent literature. Explore (NY). 2005;1:186–91.
65. Oleckno WA, Blacconiere MJ. Relationship of religiosity to wellness and other health-related behaviors and outcomes. Psychol Rep. 1991;68:819–26. 66. Ellison CG, George LK. Religious involvement, social ties, and social support
in a Southeastern Community. J Sci Study Religion. 1994;33:46–61. 67. Landis BJ. Uncertainty, spiritual well-being, and psychosocial adjustment to
chronic illness. Issues Ment Health Nurs. 1996;17:217–31.
68. Narayanasamy A. Spiritual coping mechanisms in chronically ill patients. Br J Nurs. 2002;11:1461–70.
69. Shaw JL, Brown J, Khan B, Mau MK, Dillard D. Resources, roadblocks and turning points: a qualitative study of American Indian/Alaska Native adults with type 2 diabetes. J Community Health. 2013;38:86–94.
70. Dye CJ, Haley-Zitlin V, Willoughby D. Insights from older adults with type 2 diabetes: making dietary and exercise changes. Diabetes Educ. 2003;29:116–27.