R E S E A R C H M E T H O D S
Open Access
A new weighted injury severity scoring
system: better predictive power for adult
trauma mortality
Junxin Shi
1,2, Jiabin Shen
1,2, Motao Zhu
1,2,3, Krista K. Wheeler
1,2, Bo Lu
4, Brian Kenney
1,5, Kathryn E. Nuss
3and
Henry Xiang
1,2,6*Abstract
Background:An accurate injury severity measurement is essential in the evaluation of trauma care and in outcome research. The traditional Injury Severity Score (ISS) does not consider the differential risks of the Abbreviated Injury Scale (AIS) from different body regions, and the three AIS involved in the calculation of ISS are given equal weights. The objective of this study was to develop a weighted injury severity scoring (wISS) system for adult trauma patients with better predictive power than the traditional Injury Severity Score (ISS).
Methods:The 2007–2014 National Trauma Data Bank (NTDB) Research Datasets were used. We identified adult trauma patients from the NTDB and then randomly split it into a study sample and a test sample. Based on the association between mortality and the Abbreviated Injury Scale (AIS) from each of the six ISS body regions in the study sample, we evaluated 12 different sets of weights for the component AIS scores used in the calculation of ISS and selected one best set of weights. Discrimination (areas under the receiver operating characteristic curve, sensitivity, specificity, positive predictive value, negative predictive value, concordance) and calibration were compared between the wISS and ISS.
Results:The areas under the receiver operating characteristic curves from the wISS and ISS are all 0.83, and 0.76 vs. 0.73 for patients with ISS = 16–74 and 0.68 vs. 0.53 for patients with ISS = 25–74. The wISS showed higher specificity, positive predictive value, negative predictive value, and concordance when they were compared at similar levels of sensitivity. The wISS had better calibration than the ISS.
Conclusions:By weighting the AIS from different body regions, the wISS had significantly better predictive power for mortality than the ISS, especially in critically injured adults.
Keywords:Injury severity score, Weighting, Adult, Trauma, Mortality
Key points
Question
Will a weighted Injury Severity Score (wISS) better predict mortality in adult trauma patients when compared with the traditional Injury Severity Score (ISS)?
Findings
By weighting the Abbreviated Injury Scores (AIS) from different body regions, the wISS showed better predictive ability than the ISS, especially in critically injured adults (ISS in the range of 25–74).
Meaning
The weighted ISS is a better alternative to ISS to predict mortality in adult trauma patients.
Background
An accurate injury severity measurement is essential for evaluating trauma care and outcome research. Over the past
© The Author(s). 2019Open Access This article is distributed under the terms of the Creative Commons Attribution 4.0 International License (http://creativecommons.org/licenses/by/4.0/), which permits unrestricted use, distribution, and reproduction in any medium, provided you give appropriate credit to the original author(s) and the source, provide a link to the Creative Commons license, and indicate if changes were made. The Creative Commons Public Domain Dedication waiver (http://creativecommons.org/publicdomain/zero/1.0/) applies to the data made available in this article, unless otherwise stated.
* Correspondence:Henry.Xiang@NationwideChildrens.org
1Center for Pediatric Trauma Research, The Abigail Wexner Research Institute
at Nationwide Children’s Hospital, 700 Children’s Drive, Columbus, OH 43205, USA
2Center for Injury Research and Policy, The Abigail Wexner Research Institute
four decades, the Injury Severity Score (ISS), developed by Susan Baker and colleagues in 1974 (Baker et al.1974), has been the most commonly used injury severity measurement (Tohira et al.2012). ISS is based on the severity score of the Abbreviated Injury Scale (AIS), which is an anatomically based consensus-derived severity scoring system that classi-fies each injury by body region and relative severity. A nu-merical scale of injury severity ranging from 1 (minor) to 6 (maximal severity) is assigned for each injury from six body regions ([1] Head/neck, [2] Face, [3] Chest, [4] Abdomen or pelvic contents, [5] Extremities or pelvic girdle, and [6] External) (Committee on Medical Aspects of Automotive Safety (CMAAS) 1971). An ISS (ranging from 1 to 75) is computed by summation of the squares of the three highest AIS scores from the most severely injured body regions. Any AIS score of 6 is assigned an ISS of 75, which suggests an un-survivable injury.
Although ISS is the most commonly used severity measurement, it has a critical limitation: it is weighted equally across all six body regions without consideration of the differing mortality risks from injuries in different body regions, leading to an inconsistent correlation between an ISS and mortality (Copes et al. 1988, Osler et al.1996, Aharonson-Daniel et al.2006). In our previ-ous study, we developed a weighted Injury Severity Scoring system for pediatric blunt trauma as a proof of concept (Shi et al. 2018). The weighted ISS showed much better ability in predicting mortality in critically injured children (ISS≥25). Because the first weighted ISS was developed in pediatric trauma patients, it is not clear if in adults, different weighting should be applied and whether weighting would then produce meaningful improvements in mortality prediction.
Since the inception of the ISS scoring system, a num-ber of new injury severity scoring tools have been devel-oped, including the New ISS (NISS) (Osler et al. 1997), the Trauma and Injury Severity Score (TRISS) (Champion et al.1983), and the International Classification of Diseases (ICD)-based Injury Severity Score (ICISS) (Osler et al., 1996). However, these have not replaced the commonly used ISS. In the conclusion of a recent review paper, the authors report that the evidence is not consistent to support which score is superior (Tohira et al., 2012). The traditional ISS is still the only comprehensive injury severity measurement used in important national databases, such as the National Trauma Databank (NTDB) (American College of Surgeons 2007–2014) and the Nationwide Emergency Department Sample (NEDS) (The Healthcare Cost and Utilization Project (HCUP)2006–2014).
In the pediatric paper, we used the NTDB for score development and the NEDS data to test the score. The majority of trauma patients included in NEDS data, especially the major trauma patients could be the same patients included in the NTDB data. So the sample for
developing of the pediatric wISS and the sample for test-ing of the wISS most likely included many of the same patients. In this current adult paper, we have resolved this issue.
This study used a two-step procedure to accomplish its objective to develop and validate a new weighted ISS scoring system for adult trauma. We randomly split trauma patients identified from NTDB into a study sample and a test sample. We used the study sample to develop the best set of AIS weights for a weighted ISS. We then applied this set of weights to the test sample data to calculate the weighted ISS and compare the weighted ISS and the traditional ISS in terms of predict-ing mortality.
Methods
Data source
The 2007–2014 National Trauma Data Bank (NTDB) Research Datasets were used. The NTDB contains stan-dardized trauma registry data from more than 900 trauma centers in the United States each year, and is the largest aggregation of U.S. trauma registry data (American College of Surgeons2007–2014).
Study population
Data analysis
Death was the main outcome and it included deaths occurring in the emergency department (ED) or during the hospital stay. All the analyses were done using SAS Enterprise Guide, Version 7.11 HF3 (SAS Institute Inc., Cary, NC, USA). There were two major steps in the data analysis:
Step one: developing the weighted ISS
The weights for the AIS from the six ISS body regions should reflect the strength of the relationship between the AIS and mortality. We explored 12 sets of weights which can be divided into four weighting groups: Group A was based on the highest mortality of all AIS severity scores from each body region; Group B was based on overall mortality of injuries from each body region; Group C was based on the AUC (the area under the receiver operating characteristic curve); Group D was based on the concordance. Concordance is defined as the proportion of pairs where the observation with the event (death in this study) has a higher predicted prob-ability (higher severity score) than the observation of non-event (survival) among all possible combinations of one event and one non-event. We further used two data transformations (the logarithm and square root). The choice of these two transformations is arbitrary. Although the two data transformation methods are commonly used in statistics, we do not know a priori whether these will generate optimal weights. The details are described as follows:
(1) We identified the six maximum AIS severity scores (maxAIS) corresponding to the six ISS body regions from AIS scores included in the database (file: RDS_AIS98PCODE).
(2) For each body region, we selected those patients with the maxAIS from that body region as the
“principal injury,”and those patients with higher or equal maxAIS from other body regions were excluded temporarily in this score development step. For example, patients with a maximum head AIS of 3 and an abdominal AIS score of 3 or higher would be excluded when evaluating the relationship between head AIS and mortality in the
development step. We calculated mortality rates correlated with each specific maxAIS value for each ISS body region and overall mortality rates for each ISS body region. For example, head injuries with maxAIS equal to 1, 2, 3, 4, 5, the mortality rates were 0.23, 0.76, 2.34, 5.45, and 40.81%, respectively in the study sample. The highest mortality rate was 40.81%, but the overall mortality rate for these patients was 7.84%. We fitted six logistic models with death as the outcome, and each of the six
maxAIS as predictors to get the c statistic and the concordance (Since logistic regression is a
monotonic transformation of the severity score, the c statistic from the logistic regression model is equivalent to the AUC calculated from the raw score). Compared to concordance, the c statistic takes into account those pairs where severity scores are equal for the pair of event and non-event (in other words, it includes adjustment by the ties).
(3) We generated 12 sets of weights. Specifically,
A1: Highest mortality; A2: LOG (Highest mortality); A3: SQRT (Highest mortality);
B1: Overall mortality; B2: LOG (Overall mortality); B3: SQRT (Overall mortality);
C1: 100 × (AUC-0.5); C2: LOG(100 × (AUC-0.5)); C3: SQRT (100 × (AUC-0.5));
D1: Concordance; D2: LOG (Concordance); and D3: SQRT (Concordance).
LOG was the natural logarithmic function, and SQRT was the square root function. For the C1, C2, and C3 weighting methods, we subtracted 0.5 from the AUC to get a“net”discrimination (AUC = 0.5 is considered with-out any discrimination and just by chance).
(4) We applied (multiplied) the weights to the six maxAIS scores. We then squared the three largest numbers and added them together to get a
weighted ISS. We also calculated the traditional ISS without applying weights.
(5) Selected the best set of weights by comparing AUCs.
Discrimination in this study is the ability of the score to separate the patients who survived and those who did not. In a Receiver Operating Characteristic (ROC) curve, the true positive rate (sensitivity) is plotted as a function of the false positive rate (1-specificity) for different cut-off points (Zweig and Campbell, 1993). The area under ROC curve (AUC) equal to 1 represents perfect discrimination; an AUC equal to 0.5 indicates no discriminative power. We compared the AUCs of all 12 weighting methods against the traditional ISS among various ranges of ISS. Ultimately, we chose the weighting method that maximized the AUC in major trauma (ISS 16–74). In this study, A3 (square root of the highest mortality) was chosen as the final weighting method.
Step two: validating the weighted ISS (wISS) in the test sample
Discrimination comparisons
in the test sample. In SAS, the comparison of AUCs im-plements the nonparametric approach of DeLong, DeLong, and Clarke-Pearson (DeLong et al. 1988). We also calculated sensitivity, specificity, positive predictive value (PPV), negative predictive value (NPV), and con-cordance with each individual score as the cutoff value in the range of ISS 1–74, major trauma (ISS 16–74), and in critically injured patients (ISS 25–74).
Calibration comparisons
Calibration is the ability of predictors to correctly predict an outcome over the entire range of risk. Calibration can be assessed graphically by plotting the actual outcome against the predictors. In our study, the ISS had 43 individual values while the wISS had over 1000 individual values. The smoothness of the curved line of the mortality rates in cor-respondence with the severity scores depends on the num-ber of patients in each score group. If sample sizes for the groups were small, the line representing the mortality rates would oscillate wildly. If the number of groups was made smaller (i.e., the number of patients in each group will then be larger), the mortality rates tend to be stabilized. We gen-erated scatter plots of mortality probabilities against wISS for different score groupings (i.e., on the original scale, with unit = 100, unit = 200, and by 5 groups: 0–400, 400–600, 600–1000, 1000–1400, 1400+). For the purpose of compari-son, we generated similar graphs for the ISS, on the original scale and by 5 groups (1–3, 4–8, 9–15, 16–24, 25–74).
With the assumption that logistic regression accurately describes the relationship between mortality and the se-verity score, we examined the calibration indirectly by comparing the Hosmer and Lemeshow Goodness_of Fit Chi-square, with a smaller value indicating better fit.
Results
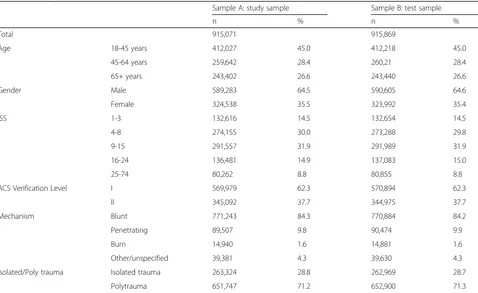
A total of 4,777,423 adult trauma patients were identi-fied in the 2007–2014 NTDB. We excluded in the fol-lowing order, patients without AIS (27%), not treated in ACS Level I or Level II trauma centers (45.4%), trans-ferred out (2.6%), arrival with no sign of life (0.6%), or ISS = 75 (0.2%). The final sample was 1,830,940. Females were 35%, and the average age was 49 years. Major trauma (ISS 15–74) patients were 24% of the sample, and 9% were critically injured (ISS 25–74). The mortality rate was 3.9% for the overall group, 4.5% for major trauma, and 26.2% for the critically injured patients. (Additional file1: Table S1, Tables1and3). In the study sample, the weighting method A3 (square root of the highest mortality) provided the highest discriminative power in the ISS range of 16–74, so we chose the weights from A3 as the final weights. The final weights were as follows: head/neck = 6.39; face = 4.18; chest = 4.80; abdomen/pelvic contents = 4.76; extremities = 5.65; external = 7.93 (Table2). For the purpose of comparison,
we have also listed the weights we generated in our pediatric blunt injury study in Table 2(Shi et al.,2018). The other 11 sets of weights are shown in Additional file 1: Table S2, and the related AUCs from the study sam-ple are shown in Additional file1: Table S3.
Discrimination comparisons
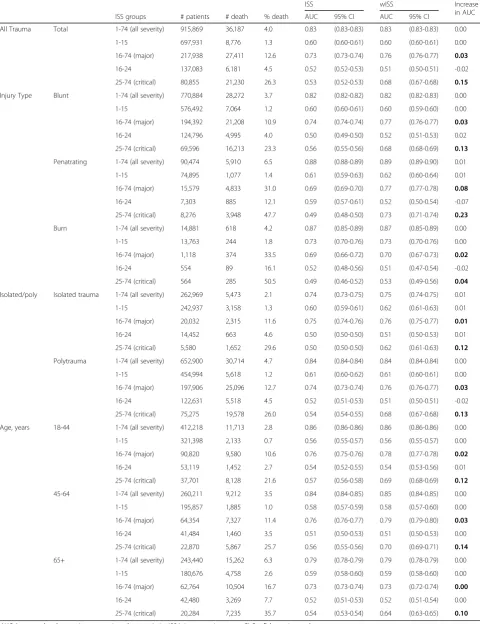
All the subsequently described analyses are based on the test sample data. In patients with ISS 1–74, the AUCs from the weighted ISS and the traditional ISS are all 0.83. But in the ISS range of 16–74 (major trauma), the AUC from the weighted ISS is 0.76 while the AUC from the traditional ISS being 0.73; these two numbers are 0.68 vs. 0.53 in the range of ISS 25–74. The improve-ment in discrimination increased in the more severely injured patients. To study the potential generalization of the weighted ISS, we compared the AUCs in subgroups: Injury type (blunt trauma, penetrating trauma, burns), Isolated/poly (isolated trauma, polytrauma), and age groups (18–44, 45–64, 65+). In all subgroup analyses, similar patterns were seen, although the differences were smallest in burn patients and greatest for patients with penetrating trauma (Table3).
Figure1 shows that with similar sensitivity, the specifi-city, positive predictive value, negative predictive value, and concordance were all higher for the wISS when com-pared with ISS in the major trauma group (ISS 16–74) and in critically injured patients (ISS 25–74).
Calibration comparisons
and Lemeshow statistics. Assuming the logistic regression models were correct, we can state that the wISS has a stronger association with mortality than ISS in trauma patients across the entire range of injury severity, but espe-cially in critically injured patients.
Discussion
We developed a weighted Injury Severity Score (wISS) by applying data derived weights to AIS scores to calcu-late the ISS. In a large sample of adult trauma patients, the wISS predicted mortality more accurately than the traditional ISS, especially in critically injured patients.
In the present study, we explored 12 weighting methods. The results confirmed our previous study developing a weighted ISS score for use in pediatric blunt trauma as well as other researchers’ results demonstrating that injuries from different body region should be given different weights while calculating ISS score (Copes et al., 1988, Cooper et al.1994, Schneier et al.2006, Brown et al.2017, Shi et al. 2018). In pediatric patients, head injuries are weighted more than injuries from other body regions, but in our adult sample, the external injuries were given greater weighting than the head/neck injuries. Our current study results suggest that the weighting method to calculate ISS should be age specific, and at the very least children and adults should be treated differently. The weights developed in pediatric sample cannot be applied to adult sample, and vice versa.
The AUC is the most commonly used measurement of discrimination (Tohira et al., 2012). Most studies have included patients with all levels of injury severity, and the majority of the injured patients have minor injuries. Given this patient mix, the AUCs from many scoring systems tend to be high. In a study conducted by Meredith and colleagues, they compared nine scoring algorithms in predicting mortality, and their conclu-sion was that the differences in performance were relatively small (Meredith et al. 2002). In their study, the AUC for ISS was 0.867. The AUC can be Table 2Comparison of weights chosen for a pediatric
(blunt trauma only) sampleaand the current adult sample (blunt, penetrating, and burns)
Pediatric (Blunt trauma)a Adult
Max AIS of head/neck 1.87 6.39
Max AIS of face 0.13 4.18
Max AIS of chest 1.52 4.80
Max AIS of abdomen/pelvic contents 0.98 4.76
Max AIS of extremities 0.15 5.65
Max AIS of external 0.33 7.93
a
Source: Shi J, Shen J, Caupp S, Wang A, Nuss KE, Kenney B, Wheeler KK, Lu B, Xiang H. A new weighted injury severity scoring system: Better predictive power for pediatric trauma mortality. J Trauma Acute Care Surg. 2018;85(2):334-40 Table 1Demographic and injury characteristics of the sample
Sample A: study sample Sample B: test sample
n % n %
Total 915,071 915,869
Age 18-45 years 412,027 45.0 412,218 45.0
45-64 years 259,642 28.4 260,21 28.4
65+ years 243,402 26.6 243,440 26.6
Gender Male 589,283 64.5 590,605 64.6
Female 324,538 35.5 323,992 35.4
ISS 1-3 132,616 14.5 132,654 14.5
4-8 274,155 30.0 273,288 29.8
9-15 291,557 31.9 291,989 31.9
16-24 136,481 14.9 137,083 15.0
25-74 80,262 8.8 80,855 8.8
ACS Verification Level I 569,979 62.3 570,894 62.3
II 345,092 37.7 344,975 37.7
Mechanism Blunt 771,243 84.3 770,884 84.2
Penetrating 89,507 9.8 90,474 9.9
Burn 14,940 1.6 14,881 1.6
Other/unspecified 39,381 4.3 39,630 4.3
Isolated/Poly trauma Isolated trauma 263,324 28.8 262,969 28.7
Table 3Area Under the ROC Curve for ISS and wISS in the test sample (NTDB 2007-2014)
ISS wISS Increase
in AUC
ISS groups # patients # death % death AUC 95% CI AUC 95% CI
All Trauma Total 1-74 (all severity) 915,869 36,187 4.0 0.83 (0.83-0.83) 0.83 (0.83-0.83) 0.00
1-15 697,931 8,776 1.3 0.60 (0.60-0.61) 0.60 (0.60-0.61) 0.00
16-74 (major) 217,938 27,411 12.6 0.73 (0.73-0.74) 0.76 (0.76-0.77) 0.03
16-24 137,083 6,181 4.5 0.52 (0.52-0.53) 0.51 (0.50-0.51) -0.02
25-74 (critical) 80,855 21,230 26.3 0.53 (0.52-0.53) 0.68 (0.67-0.68) 0.15
Injury Type Blunt 1-74 (all severity) 770,884 28,272 3.7 0.82 (0.82-0.82) 0.82 (0.82-0.83) 0.00
1-15 576,492 7,064 1.2 0.60 (0.60-0.61) 0.60 (0.59-0.60) 0.00
16-74 (major) 194,392 21,208 10.9 0.74 (0.74-0.74) 0.77 (0.76-0.77) 0.03
16-24 124,796 4,995 4.0 0.50 (0.49-0.50) 0.52 (0.51-0.53) 0.02
25-74 (critical) 69,596 16,213 23.3 0.56 (0.55-0.56) 0.68 (0.68-0.69) 0.13
Penatrating 1-74 (all severity) 90,474 5,910 6.5 0.88 (0.88-0.89) 0.89 (0.89-0.90) 0.01
1-15 74,895 1,077 1.4 0.61 (0.59-0.63) 0.62 (0.60-0.64) 0.01
16-74 (major) 15,579 4,833 31.0 0.69 (0.69-0.70) 0.77 (0.77-0.78) 0.08
16-24 7,303 885 12.1 0.59 (0.57-0.61) 0.52 (0.50-0.54) -0.07
25-74 (critical) 8,276 3,948 47.7 0.49 (0.48-0.50) 0.73 (0.71-0.74) 0.23
Burn 1-74 (all severity) 14,881 618 4.2 0.87 (0.85-0.89) 0.87 (0.85-0.89) 0.00
1-15 13,763 244 1.8 0.73 (0.70-0.76) 0.73 (0.70-0.76) 0.00
16-74 (major) 1,118 374 33.5 0.69 (0.66-0.72) 0.70 (0.67-0.73) 0.02
16-24 554 89 16.1 0.52 (0.48-0.56) 0.51 (0.47-0.54) -0.02
25-74 (critical) 564 285 50.5 0.49 (0.46-0.52) 0.53 (0.49-0.56) 0.04
Isolated/poly Isolated trauma 1-74 (all severity) 262,969 5,473 2.1 0.74 (0.73-0.75) 0.75 (0.74-0.75) 0.01
1-15 242,937 3,158 1.3 0.60 (0.59-0.61) 0.62 (0.61-0.63) 0.01
16-74 (major) 20,032 2,315 11.6 0.75 (0.74-0.76) 0.76 (0.75-0.77) 0.01
16-24 14,452 663 4.6 0.50 (0.50-0.50) 0.51 (0.50-0.53) 0.01
25-74 (critical) 5,580 1,652 29.6 0.50 (0.50-0.50) 0.62 (0.61-0.63) 0.12
Polytrauma 1-74 (all severity) 652,900 30,714 4.7 0.84 (0.84-0.84) 0.84 (0.84-0.84) 0.00
1-15 454,994 5,618 1.2 0.61 (0.60-0.62) 0.61 (0.60-0.61) 0.00
16-74 (major) 197,906 25,096 12.7 0.74 (0.73-0.74) 0.76 (0.76-0.77) 0.03
16-24 122,631 5,518 4.5 0.52 (0.51-0.53) 0.51 (0.50-0.51) -0.02
25-74 (critical) 75,275 19,578 26.0 0.54 (0.54-0.55) 0.68 (0.67-0.68) 0.13
Age, years 18-44 1-74 (all severity) 412,218 11,713 2.8 0.86 (0.86-0.86) 0.86 (0.86-0.86) 0.00
1-15 321,398 2,133 0.7 0.56 (0.55-0.57) 0.56 (0.55-0.57) 0.00
16-74 (major) 90,820 9,580 10.6 0.76 (0.75-0.76) 0.78 (0.77-0.78) 0.02
16-24 53,119 1,452 2.7 0.54 (0.52-0.55) 0.54 (0.53-0.56) 0.01
25-74 (critical) 37,701 8,128 21.6 0.57 (0.56-0.58) 0.69 (0.68-0.69) 0.12
45-64 1-74 (all severity) 260,211 9,212 3.5 0.84 (0.84-0.85) 0.85 (0.84-0.85) 0.00
1-15 195,857 1,885 1.0 0.58 (0.57-0.59) 0.58 (0.57-0.60) 0.00
16-74 (major) 64,354 7,327 11.4 0.76 (0.76-0.77) 0.79 (0.79-0.80) 0.03
16-24 41,484 1,460 3.5 0.51 (0.50-0.53) 0.51 (0.50-0.53) 0.00
25-74 (critical) 22,870 5,867 25.7 0.56 (0.55-0.56) 0.70 (0.69-0.71) 0.14
65+ 1-74 (all severity) 243,440 15,262 6.3 0.79 (0.78-0.79) 0.79 (0.78-0.79) 0.00
1-15 180,676 4,758 2.6 0.59 (0.58-0.60) 0.59 (0.58-0.60) 0.00
16-74 (major) 62,764 10,504 16.7 0.73 (0.73-0.74) 0.73 (0.72-0.74) 0.00
16-24 42,480 3,269 7.7 0.52 (0.51-0.53) 0.52 (0.51-0.54) 0.00
25-74 (critical) 20,284 7,235 35.7 0.54 (0.53-0.54) 0.64 (0.63-0.65) 0.10
intuitively understood in this way: if there is a pair of patients where one is randomly selected from the non-survival group and the other is randomly selected from the survival group, the AUC is equivalent to the prob-ability of correctly identifying the non-surviving pa-tient as the one with a higher severity score and the surviving patient as the one with a lower severity score (correctly classifying the two patients in the random pair). In this situation, if the majority of patients have minor injuries, it is not too difficult to correctly guess which one has a higher risk of death and which one has lower risk if you knew the scores of the pair, since the difference in terms of severity between these two patient pools is large. This is why many researchers
previously have tried to develop alternative severity scores but ultimately failed to“improve” on the already very high AUC of the traditional ISS. Most studies did not focus on severe injured patients. The real challenge for a score is to discriminate among injured patients with high risk of mortality, and our weighted ISS per-formed much better than the traditional ISS in critically injured patients (ISS≥25). In this ISS range, the ISS had very limited discrimination (AUC = 0.53) while the weighted ISS had an AUC 0.68. The improvement in dis-crimination and calibration strongly support our statement that the weighted ISS significantly improves upon the pre-dictive capacity of mortality in critically injured patients when compared with the traditional ISS.
The results from our study have implications for risk adjustment in trauma outcome research and trauma program evaluation. The wISS could be used to risk-ad-just in quality improvement efforts. The weighted ISS is a better alternative to ISS to predict mortality in adult trauma patients, especially when evaluating mortality risk of the most severe patients.
Study limitations
Although this study successfully developed a new weighted ISS scoring system for adult trauma that performed better than the traditional ISS, our study has several limitations. First, we did not search all possible combinations of weights to optimize the prediction abil-ity of the new score. The choice of the two methods of data transformations was arbitrary. Second, we did not compare the wISS with other scoring systems. Whether the wISS is better than other score is not yet known. Currently, ISS is the most commonly used severity measurement. As we indicated in above discussion, ISS is the only severity score used in two national databases (NTDB and NEDS). So, comparing with ISS is an im-portant step and should be the first step when develop-ing a new score. Finally, the calculation of the weighted ISS is more cumbersome than the traditional ISS, and most often will require the use of a computer and statis-tical programming. However, the computer algorithm could be provided upon request and that could then eas-ily be incorporated into calculations.
Conclusions
In summary, by weighting AIS scores from different body regions, the final weighted ISS had significantly
better predictive power for mortality than the traditional ISS in critically injured adult trauma patients. This study demonstrates that consideration of the differing mortal-ity risks from injuries in different body regions improves severity scoring. A wISS should be used in the evaluation of adult trauma care and in outcome research, since it is a significantly better predictor of mortality.
Additional file
Additional file 1:Table S1.Mortality rates by ISS in adult trauma, NTDB 2007-2014.Table S2.Weights used by various weighting methods.Table S3.AUC comparisons between traditional ISS and 12 weighting methods in different ranges of ISS. (DOCX 2392 kb)
Abbreviations
AIS:Abbreviated Injury Scores; AUC: The Area under the Receiver Operating Characteristic curve; ICISS: International Classification of Diseases (ICD)-based Injury Severity Score; ISS: Injury Severity Score; NISS: New Injury Severity Score; NPV: Negative predictive value; NTDB: National Trauma Databank; PPV: Positive predictive value; ROC: Receiver Operating Characteristic; TRISS: Trauma and Injury Severity Score; wISS: weighted Injury Severity Score
Acknowledgements
Not applicable.
Authors’contributions
Literature search (JShi), study design (JShi), data analysis (JShi, and JShen), data interpretation (all authors), writing (JShi: 1st draft), critical revision (all authors), and final approval (all authors). All authors read and approved the final manuscript.
Funding
The study was partly supported by Agency for Healthcare Research and Quality (grant #1R01 HS24263–01).
Availability of data and materials
The SAS programs generated the results are available to readers upon request.
Ethics approval and consent to participate
All the patient data used in this study are from National Trauma Data Bank, which are public available and de-identified. The need for approval was waived by the Nationwide Children’s Hospital Institutional Review Board.
Consent for publication
All authors consented for this publication.
Competing interests
The authors declare that they have no competing interests.
Author details
1Center for Pediatric Trauma Research, The Abigail Wexner Research Institute
at Nationwide Children’s Hospital, 700 Children’s Drive, Columbus, OH 43205, USA.2Center for Injury Research and Policy, The Abigail Wexner Research
Institute at Nationwide Children’s Hospital, Columbus, OH, USA.3The Ohio
State University College of Medicine, Columbus, OH, USA.4Department of
Emergency Medicine, Nationwide Children’s Hospital, Columbus, OH, USA.
5Division of Biostatistics, The Ohio State University College of Public Health,
Columbus, OH, USA.6Department of Pediatric Surgery, The Ohio State
University College of Medicine, Columbus, OH, USA.
Received: 18 March 2019 Accepted: 20 August 2019
References
Aharonson-Daniel L, Giveon A, Stein M, Israel Trauma G, Peleg K. Different AIS triplets: different mortality predictions in identical ISS and NISS. J Trauma. 2006;61(3):711–7.
American College of Surgeons (2007-2014). NTDB Research Data Set.
Committee on Trauma American College of Surgeons. Resources for the optimal care of the injured patient 2014. Chicago: American College of Surgeons; 2014.
Baker SP, O’Neill B, Haddon W Jr, Long WB. The injury severity score: a method for describing patients with multiple injuries and evaluating emergency care. J Trauma. 1974;14(3):187–96.
Brown JB, Gestring ML, Leeper CM, Sperry JL, Peitzman AB, Billiar TR, Gaines BA. The value of the injury severity score in pediatric trauma: time for a new definition of severe injury? J Trauma Acute Care Surg. 2017;82(6):995–1001. Champion HR, Sacco WJ, Hunt TK. Trauma severity scoring to predict mortality.
World J Surg. 1983;7(1):4–11.
Committee on Medical Aspects of Automotive Safety (CMAAS). Rating the severity of tissue damage. I. the abbreviated scale. JAMA. 1971;215(2):277–80. Cooper A, Barlow B, DiScala C, String D. Mortality and truncal injury: the pediatric
perspective. J Pediatr Surg. 1994;29(1):33–8.
Copes WS, Champion HR, Sacco WJ, Lawnick MM, Keast SL, Bain LW. The injury severity score revisited. J Trauma. 1988;28(1):69–77.
DeLong ER, Delong DM, Clarke-Pearson DL. Comparing the areas under two or more correlated receiver operating characteristic curves: a nonparametric approach. Biometrics. 1988;44:837–45.
MacKenzie EJ, Rivara FP, Jurkovich GJ, Nathens AB, Frey KP, Egleston BL, Salkever DS, Scharfstein DO. A national evaluation of the effect of trauma-center care on mortality. N Engl J Med. 2006;354(4):366–78.
Meredith JW, Evans G, Kilgo PD, MacKenzie E, Osler T, McGwin G, Cohn S, Esposito T, Gennarelli T, Hawkins M, Lucas C, Mock C, Rotondo M, Rue L, Champion HR. A comparison of the abilities of nine scoring algorithms in predicting mortality. J Trauma. 2002;53(4):621–8 discussion 628-629. Osler T, Baker SP, Long W. A modification of the injury severity score that both
improves accuracy and simplifies scoring. J Trauma. 1997;43(6):922–5. Osler T, Rutledge R, Deis J, Bedrick E. ICISS: an international classification of
disease-9 based injury severity score. J Trauma. 1996;41(3):380–6 discussion 386-388.
Schneier AJ, Shields BJ, Hostetler SG, Xiang H, Smith GA. Incidence of pediatric traumatic brain injury and associated hospital resource utilization in the United States. Pediatrics. 2006;118(2):483–92.
Shi J, Shen J, Caupp S, Wang A, Nuss KE, Kenney B, Wheeler KK, Lu B, Xiang H. A new weighted injury severity scoring system: better predictive power for pediatric trauma mortality. J Trauma Acute Care Surg. 2018;85(2):334–40. The Healthcare Cost and Utilization Project (HCUP) (2006–2014).“The Nationwide
Emergency Department Sample (NEDS)”.
Tohira H, Jacobs I, Mountain D, Gibson N, Yeo A. Systematic review of predictive performance of injury severity scoring tools. Scand J Trauma Resusc Emerg Med. 2012;20:63.
Zweig MH, Campbell G. Receiver-operating characteristic (ROC) plots: a fundamental evaluation tool in clinical medicine. Clin Chem. 1993;39(4):561–77.
Publisher’s Note