R E S E A R C H
Open Access
Assessment of the influence of whole body
vibration on Cochlear function
Seyyed-Ali Moussavi-Najarkola
1, Ali Khavanin
1*, Ramazan Mirzaei
2, Mojdeh Salehnia
3and Mehdi Akbari
4Abstract
Background:Whole body vibration (WBV) is a potentially harmful consequence resulting from the dissipation of energy by industrial machineries. The result of WBV exposure on the auditory system remains unknown. The objective of the present research was to evaluate the influence of WBV on cochlear function, in particular outer hair cell function. It is hypothesized that WBV impairs cochlear function resulting in decreased Distortion Product Otoacoustic Emission (DPOAE) levels (Ldp) in rabbits subjected to WBV.
Methods:Twelve rabbits were equally divided into vibration and control groups. Animals in vibration group were exposed to 1.0 ms-2r.m.s vertical WBV at 4–8 Hz for 8 h/day during 5 consecutive days. Outer hair cell function was assessed by comparing repeated-measurements of DPOAE levels (Ldp) across a range of f2frequencies in rabbits both exposed and unexposed to WBV. DPOAE level shifts (LSdp) were compared across ears, frequencies, groups, and times.
Results:No differences were seen over time in DPOAE levels in the non-exposed rabbits (p = 0.082). Post-exposure Ldpin rabbits exposed to WBV were significantly increased at all test frequencies in both ears compared to baseline measures (p = 0.021). The greatest increase in Ldpfollowing exposure was seen at 5888.5 Hz (mean shift = 13.25 dB). Post-exposure Ldpin rabbits exposed to WBV were not significantly different between the right and left ears (p = 0.083).
Conclusion:WBV impairs cochlear function resulting in increased DPOAE responses in rabbits exposed to WBV. DPOAE level shifts occurred over a wide range of frequencies following prolonged WBV in rabbits.
Keywords:Cochlear function, Whole body vibration, Distortion product otoacoustic emissions, Rabbit's hearing, DPOAEs
Background
Many workers are unavoidably subjected to whole body vibration (WBV) due to the nature of assigned duties. WBV is frequently found in various industries and envir-onments. Whole-body vibration (WBV) is caused by vi-bration transmitted through the seat or the feet by workplace machines and vehicles with frequencies of concern ranging from 0.5 to 80 Hz [1].
General health and well-being effects of WBV expos-ure on the human body have been studied over a num-ber of years [2]. Both animal and human studies have shown that exposure to high levels of vibration can have
serious effects on the human body, causing damage to a variety of vital organs [3]. WBV exposure may result in musculoskeletal impairments, central or peripheral ner-vous disorders [4]. Moreover, sympathic and gastrointes-tinal disorders are reported due to WBV [5].
Occupational deafness may be caused or aggravated by the additive effects of several environmental factors, es-pecially vibration [6]. A paucity of studies has been con-ducted on the assessment of the influence of WBV exposure on cochlear function at non-realistic levels typ-ically found in industrial settings. Okada et al. (1972) cited that temporary threshold shift (TTS) occurred after both 20 and 60 min of exposure to vibration with an ac-celeration of 500 cm/s and a frequency of 5 Hz, which is regarded as a resonance frequency of human body [7].
* Correspondence:[email protected]
1
Department of Occupational Health, School of Medical Sciences, Tarbiat Modares University (TMU), Tehran, Iran
Full list of author information is available at the end of the article
© 2012 Moussavi-Najarkola et al.; licensee BioMed Central Ltd. This is an Open Access article distributed under the terms of the Creative Commons Attribution License (http://creativecommons.org/licenses/by/2.0), which permits unrestricted use, distribution, and reproduction in any medium, provided the original work is properly cited.
RETRACTED
Yokoyamaet al.(1974) showed that there was no signifi-cant change in threshold sensitivity after exposure to vi-bration alone [8]. While the literature on whole-body vibration is inconclusive, Hamernik et al. (1980) sug-gested that vibration may induce or increase hearing loss or cochlear damages. Based on their opinion, low fre-quencies (<100 Hz), although relatively ineffective in initiating an auditory response, can vibrate the mem-branous labyrinth if levels are high enough [9]. Hamer-nik et al. (1981) reported that vibration alone had essentially no effect on threshold [10]. While, Hamernik et al.(1989) showed that only stronger vibration expos-ure conditions (30-Hz, 3 g r.m.s) can alter the dependent measures of hearing and can alter the shape of the per-manent threshold shift (PTS) audiogram [11]. Soliman et al.(2003) reported that the exposure to vibration only led to enhancement of both DPOAE amplitude and sig-nal to noise ratio [12]. Bochniaet al.(2005) showed that vibration-induced damages to the inner ear structures may cause a worsening of hearing, especially at low and medium frequencies [13]. Therefore, a significant gap is evident in understanding the result of WBV exposure on cochlear function at realistic levels typically found in in-dustrial settings.
Distortion Product Otoacoustic Emissions (DPOAEs) are sounds measured in the ear canal that reflect mech-anical activity of outer hair cells [14]. In animals, DPOAEs can be used to screen hearing by providing an objective means of confirming healthy cochlear function [15]. DPOAEs are measured in response to two simul-taneously presented primary tones, f1and f2, where f2is slightly higher in frequency and at a level equal to or less than f1[16]. DPOAEs are likely generated from at least two locations on the basilar membrane, the overlapping region between f1and f2, nearer to the f2place, and the cubic distortion place (2f1-f2) [17]. DPOAEs are most commonly measured as Distortion Product diagrams (DP-grams) that depict DPOAE levels (Ldp) as a function of f2 for a selected combination of primary-tone levels L1and L2[18,19].
The objective of the present study was to evaluate the influence of WBV on cochlear function, in particular outer hair cell function. It is hypothesized that WBV impairs cochlear function resulting in decreased DPOAE levels (Ldp) in rabbits subjected to WBV.
Materials and methods
Laboratory animal model and animal house condition Three months old, healthy male New Zealand White rabbits (weighing from 1800 to 2200 g; mean 2000 g) selected from Pasture Institute of Iran were divided into two groups as control (C) and vibration (WBV) groups. The sample size for the minimal effect size was calcu-lated to be 5, while 10% should be added for probable
death [20]. Thereby, total sample size was calculated at 5.5 and rounded to 6 (for each group). In the present study, 12 healthy rabbits were selected among 15 rabbits based on their hearing ability measured by DPOAE responses and were divided into two groups. Rabbits were maintained in a conditioned animal house at 20-22°C temperature, 30-70% relative humidity, and 10 times/h air exchange. Animals were kept on a 12-h light/12-h dark cycle. Required space for each rabbit by 2000 g body weight was considered about 0.14 m2 according to toxicology reference conditions [20]. Rabbits were allowed free access to food (Pars laboratory animal chow) and tap water. "General Principles of Helsinki Law related to Laboratory Animal" were followed.
Exposure protocol
Experimental animals were subjected to 1.0 ms-2 r.m.s (root mean square) WBV in z-axis at 4–8 Hz for 8 h per day during 5 consecutive days by putting them into an exposure chamber on a vibrating platform, while control animals were treated identically except exposure to WBV. Experimental protocol was set as: pre- DP-gram (baseline; day 0), rest periods (3 days on days 1 to 3), ex-posure periods (only for vibration rabbits; WBV expos-ure on days 4 to 8), first post- DP-gram (immediately following WBV exposure); rest period (3 days; days 9 through 11), and second post- DP-gram (72 h following WBV exposure).
WBV exposure chamber
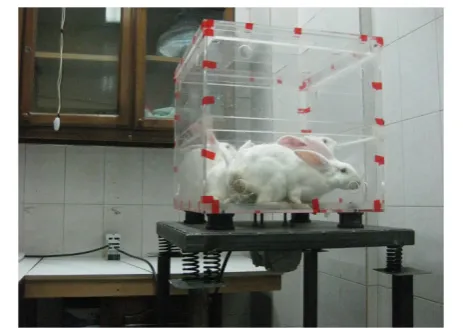
Six experimental rabbits were exposed to vertical WBV with definite characteristics by putting them into a 50 × 50 × 50 cm transparent poly carbonate Plexiglas chamber on a self constructed vibrating platform (Figure 1). Vertical vibration (in z-axis) was chosen to
Figure 1Plexiglas exposure chamber inserted on a vibrating platform.The vibrating system consisted of mass, stiffness (spring and shock absorbers), and damping, with a total mass of 45 kilograms.
RETRACTED
achieve a larger pathway, longer stability and more im-pact for passing WBV along the body and implemented according to ISO-2631 (1997). Like other general vibrat-ing systems, this system also consisted of three compo-nents including mass (total mass of chamber, 8 spring shock absorbers, metal plate dimensioned 50 × 50 cm, mounts, rabbits' weights, and 4 compressed plastic shock absorbers was equal to around 45 kg), stiffness (spring and shock absorbers), and damping. Vibrating platform was formed from a three-phase body vibrator (Model M3/65, ITAL VIBREH Company; Italy) for gen-erating vibration and an inverter (Model 0.37 KW IG5A-4; LG Company; Korea) to obtain to desired char-acteristics of WBV. Air displacement was about 10 times/h by allocating 20 openings with a 3 cm diameter at the lateral faces and floor as well as 2 windows dimensioned 10 × 15 cm at the ceiling. Laboratory back-ground noise was monitored systematically during experiments with a Casella CEL-490 sound level meter located near the exposure chamber. Background noise in the animal house and lab was found to be below 20±2 dBA SPL.
DPOAE examinations
At the end of the exposure period, rabbits were anaesthe-tized by intramuscular injection of 60% Ketamine (40 mg/kg, i.m.) and 40% Xylazine (10 mg/kg, i.m.) mix-ture. Before DPOAE measurement, animals were exam-ined otologically to exclude any infection and/or remove ear channel blocking wax. At the time of DPOAE record-ings, middle ear function was examined by tympanome-try test (226-Hz tympanometympanome-try, with an 85 dB sound pressure level: SPL, and 400 daPa/s; Madsen-Zodiac 901; GN Otometrics, Münster Company, Germany). The cri-teria for normal middle-ear function were set as Type-A tympanogram, middle ear pressure values between−100 and +50 daPa, and middle ear compliance values be-tween 0.3 and 2.0 ml. DPOAE analyzer (DPOAE 4000 I/ O Model; made of HOMOTH Company; Germany) were used for recording the outer hair cells function in both ears of the animals. DPOAEs were measured in an acous-tic room with background noise level less than 3 dBA SPL. Two pure primary tones (L1= 75 and L2= 65 dB SPL; L1-L2= 10 dB SPL) with f2/f1= 1.25 were used to measure DPOAEs at f2frequencies ranging from 500 Hz to 10 kHz. Ten f2frequencies were measured as the best auditory sensitivity responses in NZW rabbits due to classical conditioning of the nictitating membrane (NM) response [21]. The criterion for normal DPOAE was defined so that the difference between the emission level and the noise-floor levels (SNR) was above 6 dB SPL. Be-fore DPOAEs, signal levels were calibrated in the ear canal by an emission probe microphone. The contents of stimuli were summed, and the summed energy in the
2f1–f2 frequency buffer was served to estimate DPOAE amplitudes. DPOAE levels (Ldp) on three occasions were examined, and their respective level shifts (LSdp) were compared between control and WBV groups. Constant body temperature was controlled during the DPOAE examinations for avoiding intervention in measurements.
Statistical analysis
Two-sample Kolmogorov-Smirnov analysis was used to assess the normality of collected data. Power analysis was used to calculate the minimum sample size required to get a significant result (H0:x=6). Repeated measures analysis of variance (ANOVA) was used to compare Ldp across test sessions within each group. One-way ANOVA was used to compare Ldp between groups at each test session, and post-hoc comparisons were adjusted when necessary using Tukey’s Honestly Signifi-cant Difference. Paired-sample T-test was used to com-pare Ldp between the right and left ears. Independent-Sample T-test was used to compare Ldp across pre- and post-exposure times. Differences were considered signifi-cant with p<0.05.
Results
Collected data was confirmed to be normal in both the control and WBV groups (C.I. = 0.95; Z = 328; p<0.001). The sample size of the study design was adequate to achieve significance at an effect size of 83.6% of the nor-mal signal.
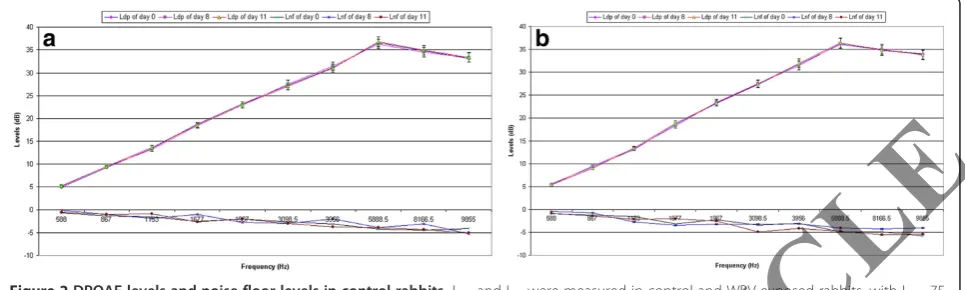
Pre- and post-exposure DPOAE analyses revealed that no differences were seen over time in DPOAE levels (Ldp) in the non-exposed rabbits (F = 4.72; p = 0.082) (Figure 2a,b). Ldp were not significantly different between the right and left ears (t = 3.13; p = 0.076), nor were they different across frequencies (F = 6.21; p = 0.063).
DPOAE level (Ldp) analyses showed that the pre-exposed Ldp of rabbits in WBV group were found to be equal to those measured in control rabbits (p = 0.089) (Figure 3a,b), while post-exposure Ldpin rabbits exposed to WBV were significantly increased at all test frequen-cies in both ears as compared to the respective controls (t = 3.48; p = 0.035) or in rabbits prior to exposure (t = 5.25; p = 0.021). The greatest post-exposure Ldp was seen at 5888.5 Hz (mean Ldp,day 8= 49.72 dB; mean Ldp,
day 11= 46.19 dB). Post-exposure Ldp in rabbits exposed to WBV were not shown to be significantly different be-tween the right and left ears (t = 5.78; p = 0.083).
First and second DPOAE level shifts (LSdp) in WBV rabbits were found to be significantly different from those measured in the respective controls (p = 0.019 and p = 0.023 respectively) (Figure 4a,b). LSdp following ex-posure to WBV were significantly different across times (F = 4.77; p = 0.031). The greatest first and second LSdp (the greatest increases in Ldp, day 8 and Ldp, day 11) in
RETRACTED
rabbits following exposed to WBV were shown at 5888.5 Hz (mean first level shift = 13.25 dB, mean sec-ond level shift = 10.8 dB). LSdp in rabbits subjected to WBV were not significantly different between the right and left ears (p = 0.075).
Discussion
DPOAE levels (Ldp) in vibration rabbits were increased at a vast range of frequencies, mostly at mid-to-high fre-quencies (i.e., Ldp increased slowly from 588 Hz to 5888.50 Hz, then decreased steeply to 9855 Hz). There are, therefore, two important findings in this study: 1) WBV resulted in DPOAE level (Ldp) increases, and; 2) the greatest change in DPOAE level (Ldp) occurred at 5888.5 Hz. Consistently, Soliman et al. (2003) showed that 4-weeks-exposure to vibration only in guinea pigs led to enhancement of DPOAE amplitudes [12]. Martin et al.(1977) reported that NZW rabbits’auditory sensi-tivity is maximal in the mid-to-high frequency range and rapidly decreased in the lower and higher frequencies due to the conditional nictitating membrane (NM) re-sponse [21]. Deviating from our finding, Soliman et al. (2003) found the maximum DPOAE response ampli-tudes in WBV guinea pigs at 1006 Hz [12]. Brown (1987) believed that DPOAE levels (Ldp) tend to be
largest at the frequency of the highest hearing sensitivity in the animal species [22]. Soliman et al. (2003) con-cluded that more damage to the inner hair cells than the outer hair cells is the reason for increased DPOAE amplitudes in WBV exposed animals [12]. These incre-ments were believed to be related to the affected IHCs by loss of afferent input which reduced the activity in the efferent olivocochlear bundle as well as the presence of normal OHCs that amplified the generation of DPOAEs [12]. Similar studies proposed different effects of WBV exposure on the cochlear function through a variety of causes. Okadaet al.(1972) reported temporary threshold shift (TTS) after vibration exposure, which were suggested to occur at the resonance frequency of human body [7]. Temkin (1973) showed that vibration is responsible for increasing cochlear damage from noise exposure in mice [10]. Hamerniket al.(1989) found that histological changes in the extent of the outer hair cell loss were responsible for the cochlear function shifts that occurred following vibration exposure conditions [11]. Bochnia et al. (2005) asserted that vibration-induced changes were seen in all the examined inner ear areas, whereas hair-cell damage was more often seen in the apex, spreading gradually to the base and from the circumference (outer hair cells of the third row) to the
Figure 3DPOAEs levels and noise floor levels in WBV exposed rabbits.Experimental conditions are identical to those described in Figure 2.
Figure 2DPOAE levels and noise floor levels in control rabbits.Ldpand Lnfwere measured in control and WBV exposed rabbits, with L1= 75
dBA, L2= 65 dBA and a f2/f1ratio of 1.25.a:right ear;b:left ear. Each point represents mean±1 SD from 6 rabbits.
RETRACTED
modiolus [13]. Hamernik et al. (1980) found that a damaged cochlea and vibrated membranous labyrinth were the main causes for vibration-induced cochlear function changes after low-frequency vibration [9]. Con-sistent with the results of this study, several factors were found to be associated with the enhanced DPOAE re-sponse amplitudes such as hypoxia [23], low frequency electromagnetic fields [24,25], and induced labyrinthitis [26,27], and some ototoxic drugs [26]. By contrast, some other studies reported that the DPOAE response ampli-tudes were significantly depressed following a number of factors including the administration of ototoxic drugs [28,29], acoustic trauma or noise overexposure [29,30], Meniere’s disease [31], sudden idiopathic sensorineural hearing loss [32], acoustic neuroma [33], presbycusis [34], and hereditary hearing disorders [35].
DPOAE levels (Ldp) were found to change with the time after exposure. Ldp was elevated on day 8, then decreased to a level slightly higher than baseline on day 11. Similar reversible and temporary differences were reported after interrupting the exposure to different noxious agents such as noise overexposure or acoustic trauma [30], ototoxic drugs [28], sudden idiopathic sen-sorineural hearing loss [32], and thermoprobe lesioning [36]. These increases in DPOAE levels (Ldp) might be attributed to the temporary and reversible effect of the vibration exposure as a basal cochlear lesion progressed through the frequency region being monitored. Consist-ently, other data confirm that the temporary increase in DPOAE amplitudes occurring before reductions can be interpreted as an improvement of the general condition of the exposed rabbits over time [26,37]. This could be interpreted that with continued DPOAE monitoring, the emissions would eventually return to baseline values as indicted by the decrease in the LSdpbetween days 8 and 11. This also may be related to the presence of a lesion more basal than the frequency region being monitored [26] and the reversible recovery from temporary OHCs fatigue [12]. This released OHCs from the suppression
leads to DPOAE amplification, so that DPOAE some-what returns to the normal values after recovery from vibration, coinciding with disappearance of vacuolation from IHCs. This will results in the return of olivoco-chlear bundle activity, with normalization of OHC activ-ity [12].
DPOAE levels (Ldp) in vibration-exposed rabbits were not found to be significantly different across the ears. The same vibration exposure, as well as the presence of a little distance between the rabbit's seat and the vibra-tion generator seemed to be the main reason for the identical findings on two ears. Consistent with this re-sult, some studies confirmed that DPOAE amplitudes were the same on right and left ears [2,3,12]. Contrary to this finding, pitch discrepancy (binaural diplacusis) were reported across the ears while presenting the same fre-quency stimulus [38], and tone-evoked DPOAE ampli-tudes were somewhat larger in the left ear [39]. Efferent activity seemed to be involved in the systematic binaural discrepancies of DPOAE response magnitudes on right and left ears in humans [40].
First and second DPOAE level shifts (LSdp) in rabbits subjected to vibration were found to be distinctly larger than those measured in rabbits not exposed to vibration. Similar finding appeared in guinea pigs at LSdpfollowing a 4-week vibration exposure that could be attributed to the normal OHCs, severely vacuolated IHCs, and edema-tous and vacuolated supporting cells [12].
Conclusion
WBV impairs cochlear function resulting in increased DPOAE responses in rabbits. DPOAE level shifts oc-curred over a wide range of frequencies following pro-longed WBV. WBV caused first DPOAE level shifts on day 8 which transformed to second DPOAE level shifts on day 11 because of partial reversible recovery follow-ing interruption of exposure. Increased understandfollow-ing of the physiology of enhanced DPOAE levels (Ldp) in rab-bits will require a parallel histological study.
Figure 4First and second DPOAEslevel shifts (LSdp) in control and WBV exposed rabbits. a: right ear;b: left ear.
RETRACTED
Competing interests
The authors declare that they have no competing interests.
Authors' contributions
SAMN, AK, RM and MS contributed to the conception, design and drafting of this manuscript. SAMN also carried out the audiometry tests, participated in the sequence alignment of the drafted manuscript, performed experiments and analyzed audiometry data. MA performed the calibration and setting of the DPOAEs device prior to audiometry test. All authors read and approved the final manuscript.
Acknowledgement
We would like to specially thank Professor Roger P. Hamernik for sincerely and friendly critical comments and technical support. We gratefully thank Professor Richard D. Kopke for helpful comments in early steps of starting this project. This study was supported by the Tarbiat Modares University.
Author details
1Department of Occupational Health, School of Medical Sciences, Tarbiat
Modares University (TMU), Tehran, Iran.2Department of Occupational Health, Health promotion research center, Zahedan University of Medical Sciences (ZUMS), Zahedan, Iran.3Department of Anatomical Sciences, School of Medical Sciences, Tarbiat Modares University (TMU), Tehran, Iran.
4
Department of Audiology, School of Rehabilitation, Iran University of Medical Sciences (IUMS), Tehran, Iran.
Received: 16 August 2011 Accepted: 4 May 2012 Published: 21 June 2012
References
1. South T:Managing noise and vibration at work: A practical guide to assessment, measurement and control. 1st edition. Oxford: Elsevier Butterworth-Heinemann; 2004:149–150.
2. Seidel H, Harazin B, Pavlas K, Sroka C, Richter J, Blüthner R, Erdmann U, Grzesik J, Hinz B, Rothe R:Isolated and combined effects of prolonged exposures to noise and whole body vibration on hearing, vision and strain.Int Arch Occup Environ Health1988,61:95–106.
3. Pyykko I, Pekkarinen J, Stark J:Sensory-neural hearing loss during combined noise and vibration exposure: An analysis of risk factors.Arch. Occup. Environ. Health1987,38:439–454.
4. Starck J, Pekkarinen J, Pyykko I:Impulse noise and hand-arm vibration in relation to sensory neural hearing loss.Scand J Work Environ Heal1988,
14:265–271.
5. Jauhiainen T, Kohonen A, Tarkanen J, Kaimio M:The effect of whole body vibration on the cochlea.Laryngoscope1969,79:1950–1955.
6. Seo S:A study of the effect of vibration on the organ of hearing.Fukuoka Acta Medica1955,46:943.
7. Okada A, Miyaki H, Yamamura K, Minami M:Temporary hearing loss induced by noise and vibration.J Acoust Soc Am1972,51:1240–1248. 8. Yokoyama T, Osako S, Yamamoto K:Temporary threshold shifts produced
by exposure to vibration, noise, and vibration-plus-noise.Acta Oto-Laryngologica1974,78:207–212.
9. Hamernik RP, Henderson D, Coling D, Slepecky N:The interaction of whole body vibration and impulse noise.J Acoust Soc Am1980, 67
(3):928–934.
10. Hamernik RP, Henderson D, Coling D, Salvi R:Influence of vibration on asymptotic threshold shift produced by impulse noise.Audiology1981,
20:259–269.
11. Hamernik RP, Ahroon WA, Davis RI:Noise and vibration interactions: Effects on hearing.J Acoust Soc Am1989,86(6):2129–2137.
12. Soliman S, El-Atreby M, Tawfik S, Holailc E, Iskandarb N, Abou-Setta A:The interaction of whole body vibration and noise on the cochlea.Int Congr Ser2003,1240:209–216.
13. Bochnia M, Morgenroth K, Dziewiszek W, Kassner J:Experimental vibratory damage of the inner ear.European Archives of Oto-Rhino-Laryngology2005,
262:307–313.
14. Kemp DT:Otoacoustic Emissions: Concepts and Origins. InActive processes and otoacoustic emissions in hearing. 1st edition. Edited by Manley GA, Fay RR, Popper AN. New York: Springer Science & Business Media, LLC.; 2008:1–38.
15. Uchida Y, Ando F, Nakata S, Ueda H, Nakashima T, Niino N, Shimokata H:
Distortion product otoacoustic emissions and tympanometric measurements in an adult population-based study.Auris Nasus Larynx
2006,33:397–401.
16. Kemp DT:Otoacoustic emissions, traveling waves and cochlear mechanisms.Hear Res1986,22:95–104.
17. Janssen T, Müller J:Otoacoustic emissions as a diagnostic tool in a clinical context. InActive Processes and Otoacoustic Emissions in Hearing. 1st edition. Edited by Manley GA, Fay RR, Popper AN. New York: Springer Science & Business Media, LLC.; 2008:421–460.
18. Lonsbury-Martin BL, Martin GK, Probst R, Coats AC:Acoustic distortion products in rabbit ear canal. I. Basic features and physiological vulnerability.Hear Res1987,28:173–189.
19. Martin GK, Lonsbury-Martin BL, Probst R, Scheinin SA, Coats AC:Acoustic distortion products in rabbit ear canal. II. Sites of origin revealed by suppression contours and pure-tone exposures.Hear Res1987,
28:191–208.
20. Williams PL, James RC, Roberts SM:Principles of toxicology: environmental and industrial applications. New York: Wiley; 2000.
21. Martin GK, Lonsbury-Martin BL, Kimm J:Auditory sensitivity in the rabbit determined by a conditional nictitating of membrane response.J Acoust Soc Am1977,62:S88–S88.
22. Brown AM:Acoustic distortion from rodent ears: a comparison of responses from rats, guinea pigs and gerbils.Hear Res1987,
31:25–38.
23. Kaul DK, Hebbel RP:Hypoxia/reoxygenation causes inflammatory responses in transgenic sickle mice but not in normal mice.J Clin Invest
2000,106:411–420.
24. Budak B, Budak GG, Öztürk GG, Muluk NB, Apan A, Seyhan N:Effects of extremely low frequency electromagnetic fields on distortion product otoacoustic emissions in rabbits.Auris Nasus Larynx2009,
36:255–262.
25. Budak GG, Muluk NB, Budak B, Öztürk GG, Apan A, Seyhan N:Effects of GSM-like radiofrequency on distortion product otoacoustic emissions of rabbits: Comparison of infants versus adults.Int J Pediatr Otorhinolaryngol
2009,73:1143–1147.
26. Kakigi A, Hirakawa H, Harel N, Mount RJ, Harrison RV:Basal cochlear lesions result in increased amplitude of otoacoustic emissions.Audiol Neurootol
1998,3:361–372.
27. Suzuki M, Harris JP:Expression of intercellular adhesion molecule-1 during inner ear inflammation.Annals of Otol. Rhinol. & Laryngology1995,
104:69–75.
28. Katbamna B, Homnick DN, Marks JH:Effects of chronic tobramycin treatment on distortion product otoacoustic emissions.Ear Hear1999,
20:393–402.
29. Anderson SD, Kemp DT:The evoked cochlear mechanical response in laboratory primates. A preliminary report.Arch Oto Laryngol,
224:47–54.
30. Engdahl BO, Kemp DT:The effects of noise exposure on details of distortion-product otoacoustic emissions in humans.J Acoust Soc Am
1996,99:1573–1587.
31. Harris FP, Probst R:Transiently evoked otoacoustic emissions in patients with Ménière’s disease.Acta Otolaryngol1992,112:36–44.
32. Sakashita T, Minowa Y, Hachikawa K, Kubo T, Nakai Y:Evoked otoacoustic emissions from ears with idiopathic sudden deafness.Acta Otolaryngol Suppl1991,486:66–72.
33. Telischi FF, Roth J, Lonsbury-Martin BL, Balkany TJ:Patterns of evoked otoacoustic emissions associated with acoustic neuromas.Laryngoscope
1995,105:675–682.
34. Stover L, Norton SJ:The effects of aging on otoacoustic emissions.J Acoust Soc Am1993,94:2670–2681.
35. Cohn ES, Kelley PM, Fowler TW, Gorga MP, Lefkowitz DM, Kuehn JH, Schaefer GB, Gobar L, Hahn FJ, Harris DJ, Kimberling WJ:Clinical studies of families with hearing loss attributable to mutations in the connexin 26 gene.Pediatrics1999,103:546–550.
36. Raveh E, Mount RJ, Harrison RV:Increased otoacoustic-emission amplitude secondary to cochlear lesions.J Otolaryngol1998,27:354–360.
37. Zorowka P, Schmitt HJ, Eckel HE, Lippert KL, Schonberger W, Merz E:Serial measurements of transient evoked otoacoustic emissions (TEOAEs) in
healthy newborns and in newborns with perinatal infection.Int J Pediatr Otorhinolaryngol1993,27:245–254.
RETRACTED
38. van den Brink G:Experiments in binaural diplacusis and tonal perception. InFrequency analysis and periodicity detection in hearing. 1st edition. Edited by Plomp R, Smoorenburg GF. Sijthoff AW: Leiden; 1970:362–374. 39. Sininger Y, Cone-Wesson B:Asymmetric cochlear processing mimics
hemispheric specialization.Science2004,305:1581.
40. Sato H, Sando I, Takahashi H:Sexual dimorphism and development of the human cochlea: Computer 3-D measurement.Acta Otolaryngol1991,
111:1037–1040.
doi:10.1186/1745-6673-7-12
Cite this article as:Moussavi-Najarkolaet al.:Assessment of the influence of whole body vibration on Cochlear function.Journal of Occupational Medicine and Toxicology20127:12.
Submit your next manuscript to BioMed Central and take full advantage of:
• Convenient online submission
• Thorough peer review
• No space constraints or color figure charges
• Immediate publication on acceptance
• Inclusion in PubMed, CAS, Scopus and Google Scholar
• Research which is freely available for redistribution
Submit your manuscript at www.biomedcentral.com/submit