S Y S T E M A T I C R E V I E W
Open Access
Elusive search for effective provider
interventions: a systematic review of
provider interventions to increase
adherence to evidence-based treatment
for depression
Eric R. Pedersen
1*, Lisa Rubenstein
1,3,4, Ryan Kandrack
2, Marjorie Danz
1, Bradley Belsher
5,6, Aneesa Motala
1,
Marika Booth
1, Jody Larkin
2and Susanne Hempel
1Abstract
Background:Depression is a common mental health disorder for which clinical practice guidelines have been developed. Prior systematic reviews have identified complex organizational interventions, such as collaborative care, as effective for guideline implementation; yet, many healthcare delivery organizations are interested in less resource-intensive methods to increase provider adherence to guidelines and guideline-concordant practices. The objective of this systematic review was to assess the effectiveness of healthcare provider interventions that aim to increase adherence to evidence-based treatment of depression in routine clinical practice.
Methods:We searched five databases through August 2017 using a comprehensive search strategy to identify English-language randomized controlled trials (RCTs) in the quality improvement, implementation science, and behavior change literature that evaluated outpatient provider interventions, in the absence of practice redesign efforts, to increase adherence to treatment guidelines or guideline-concordant practices for depression. We used meta-analysis to summarize odds ratios, standardized mean differences, and incidence rate ratios, and assessed quality of evidence (QoE) using the GRADE approach.
Results:Twenty-two RCTs promoting adherence to clinical practice guidelines or guideline-concordant practices met inclusion criteria. Studies evaluated diverse provider interventions, including distributing guidelines to providers, education/training such as academic detailing, and combinations of education with other components such as targeting implementation barriers. Results were heterogeneous and analyses comparing provider interventions with usual clinical practice did not indicate a statistically significant difference in guideline adherence across studies. There was some evidence that provider interventions improved individual outcomes such as medication prescribing and indirect comparisons indicated more complex provider interventions may be associated with more favorable outcomes. We did not identify types of provider interventions that were consistently associated with improvements across indicators of adherence and across studies. Effects on patients’health in these RCTs were inconsistent across studies and outcomes.
(Continued on next page)
* Correspondence:[email protected]
1RAND Corporation, 1776 Main Street, PO Box 2138, Santa Monica, CA 90407, USA
Full list of author information is available at the end of the article
(Continued from previous page)
Conclusions:Existing RCTs describe a range of provider interventions to increase adherence to depression guidelines. Low QoE and lack of replication of specific intervention strategies across studies limited conclusions that can be drawn from the existing research. Continued efforts are needed to identify successful strategies to maximize the impact of provider interventions on increasing adherence to evidence-based treatment for depression. Trial registration:PROSPERO recordCRD42017060460on 3/29/17
Keywords:Depression, Provider intervention, Guidelines, Evidence-based, Major depressive disorder, Primary care, Specialty care
Background
Depression is one of the most common mental health disorders worldwide, affecting about 7% of the adult popu-lations in the USA and the European Union [1,2]. Depres-sion is associated with poor quality of life and significantly decreased psychosocial functioning [3]; high societal costs related to patient care, unstable or unproductive employ-ment, marital and relationship disruption [4–6]; and mortality [7, 8]. Depression is most often identified by practitioners in primary care settings [9,10]. Collaborative care interventions in primary care can significantly and cost-effectively improve depression care outcomes [11–14] and can improve adherence to clinical guidelines for effective psychological and pharmacological treatments for depression [15–17]. However, collaborative care inter-ventions require major commitment to organizational change, including commitment by mental health special-ists to support the revamped system. Levels of organizational [18] and provider [19] readiness signifi-cantly influence any potential positive effect of collabora-tive care on outcomes. Given that not all organizations will have the resources or readiness to implement large system redesign efforts, it is important to understand how and whether less intensive intervention efforts that may be easier to adopt can influence provider behavior.
Although most complex interventions that aim to im-prove depression care include some elements related to guideline-based education [20–24], further research is needed to evaluate the comparative effects of different educational interventions, which do not require organization change, on specific provider behaviors. Knowledge transfer is a burgeoning field that seeks to reduce the gap between research on evidence-based in-terventions and use of these inin-terventions by generating, sharing, and applying research knowledge in practice [25]. However, knowledge transfer work is only begin-ning to systematically address methods for achieving clinical guideline-based provider behavior change. Based on conclusions that passive dissemination in educational and quality assurance interventions (e.g., mailing guide-lines to providers with no reminders or follow-up) is generally ineffective [20], researchers have emphasized system-level strategies that require restructuring care
processes, extensive time for planning, financial reorganization, and establishing new clinics and staff [26, 27]. Yet, education and dissemination interventions may have greater feasibility than large-scale organizational change, may be necessary for promoting organizational and provider readiness, and are often critical components of the broader system-level interventions. In addition, in settings outside of primary care, there is still much reli-ance on direct knowledge transfer paradigms. Adoption of evidence-based care and fidelity to manualized treatment are among the biggest challenges in specialty care settings [28,29].
In this systematic review, we synthesize estimates of the effects of provider interventions, with a specific focus on behavioral health provider change, to promote adherence to evidence-based treatments for depression. We purposefully focus on RCTs with provider outcomes as the primary outcome, and we include both specialty and primary care settings, given the large number of be-havioral change strategies that have been proposed to encourage providers to adopt evidence-based treatments for depression in practice [30,37–39]. We also examine whether provider intervention effects vary across pro-vider target of the intervention (i.e., a sole propro-vider or a team of providers).
Methods
Registration
The review is based on a registered systematic review protocol (PROSPERO record CRD42017060460).
Search strategy
In August 2017, we searched the databases PubMed, PsycINFO, the Cumulative Index of Nursing and Allied Health Literature, the Cochrane Central Register of Controlled Trials, and the Cochrane Database of System-atic Reviews to identify English-language reports of RCTs that evaluated the effects of provider interventions. Searches included depression terms (e.g., depress$, mood dysregulation), general terms for knowledge transfer and organizational quality improvement (e.g., evidence-based guideline, research to practice) [40], terms related to provider interventions for clinical practice guidelines and implementation strategies (e.g., academic detailing, re-minder systems), approaches for continuous quality im-provement (e.g., CQI; quality manage$, model for improvement), terms for continuous professional educa-tion (e.g., continuing educaeduca-tion, learning collaborative), and behavior change terms (e.g., reframing, incentive) [24, 41–43] (see Additional file1: Appendix A for full search strategy). We also searched bibliographies of existing sys-tematic reviews and included studies.
Eligibility
Eligibleparticipantswere healthcare providers responsible for patient care in the outpatient setting (e.g., primary care physicians, psychiatrists, mental health professionals, nurse practitioners, other general practitioners such as physician assistants). Eligible interventions aimed to increase adherence to depression guidelines and guideline-concordant practice (e.g., continuing educa-tion, quality improvement projects, and financial, organizational, or regulatory interventions that used knowledge translation strategies). To determine the ef-fect of interventions on provider behavior change, we excluded studies that primarily assessed the effects of
large system redesign efforts, such as collaborative care, where new clinics are established, care is reorganized (e.g., implementing dedicated care managers), and training of existing providers is only a minor component of the larger intervention. We also included interventions aimed at improving depression treatment and excluded studies focused solely on improving screening/assessment or referral behavior. Eligible comparators were no inter-vention, usual care practice (UCP), wait list control, or other provider interventions (e.g., organizational system redesign or an out of scope intervention).Outcomes docu-mented the adherence of providers to guidelines or to guideline-concordant practices. We evaluated observable, objective changes in provider behavior because they are better markers of intervention success than are provider knowledge, attitudes, satisfaction, or perceived changes, which occur earlier in the change process [44], and while they are often precursors to change, they may not progress to the observable changes in behavior necessary for impacting patient outcomes. Timing involved any inter-vention duration and any follow-up period, and setting was any outpatient healthcare delivery facility or other physician practice setting. The review was restricted to RCT study design, with studies randomizing provider participants or practice sites to interventions. We aimed to identify the presence and absence of evidence from this robust research design, which allows for the development of the confident evidence statements de-sired for policy changes.
Data extraction and critical appraisal
We used a standardized approach for systematic reviews with detailed instructions for reviewers to reduce ambi-guities. Following a pilot session to ensure similar inter-pretation of the inclusion and exclusion criteria, two reviewers independently screened all titles and abstracts of retrieved citations. Citations judged as potentially eli-gible by one or both reviewers were obtained as full text. The reviewers then both screened full-text publications against the specified inclusion and exclusion criteria, ab-stracted data from those studies that met the inclusion criteria, and assessed their risk of bias. All disagreements were resolved through author discussions. Critical ap-praisal assessments included the Cochrane Risk of Bias tool [45] and the Quality Improvement Minimum Quality Criteria Set (QI-MQCS) [46] to address internal validity and study-design independent criteria for inter-ventions aiming to improve healthcare.
Analytic plan
interval (CI). Tests of heterogeneity were performed using theI2statistic [47]. Values ofI2of 30–60% possibly represent moderate heterogeneity, 50–90% substantial heterogeneity, and 75–100% considerable heterogeneity [48]. We assessed the quality of evidence (QoE) using the Grades of Recommendation, Assessment, Develop-ment, and Evaluation (GRADE) approach.
The identified studies assessed a variety of study-specific outcomes. To facilitate comparisons across stud-ies with the available data, we selected a dichotomous, continuous, and incidence rate variable as the main indi-cations of adherence to depression guidelines or guideline-concordant practices (see Table 1). The lead author reviewed the intervention content and selected these main indicators of adherence from a list of all re-ported outcomes in the study. A content expert checked the selection. To avoid bias, the specific outcomes were selected before analyses. We also analyzed individual pro-vider behavior change outcomes that were reported in more than one study: medication prescribing, contact with patients, specific intervention adherence, and referral to mental healthcare specialists offered to patients. We analyzed the effects on patient outcomes when available. We differentiated comparators as UCP (e.g., no interven-tion or interveninterven-tions not aimed at depression treatment), practice redesign efforts (e.g., introduction of a nurse dis-ease manager or a continuous quality improvement team), or other active provider interventions (e.g., training pro-viders in a specific type of behavioral therapy, such as mo-tivational interviewing [49]).
Results
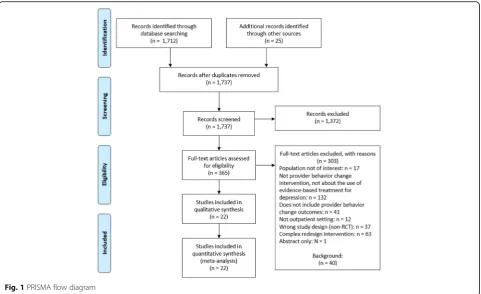
The literature search results are documented in a PRISMA [50] literature flow diagram (see Fig. 1). We reviewed 1737 titles and abstracts, and, of these, we reviewed full texts for 365 citations, identifying 22 eli-gible studies reported in 34 publications. Studies took place in nine countries and included 2149 providers and 239,477 patients. Twenty studies took place in primary care settings, ranging from primary care offices and aca-demically affiliated primary care practices to family medicine research network practices and continuing medical education groups. Two studies took place in specialty care settings: a private psychiatry practice and a managed behavioral health care organization. Two studies included teams of providers and 20 included a single provider only: 16 studies with primary care physi-cians, two studies with mental health care providers, and two studies with other general practitioners or clinicians. Duration of the interventions, duration of the imple-mentation periods, and the time points of outcome as-sessment following the end of the implementation phase were all variable. Studies evaluated many types of pro-vider interventions, ranging from simply disseminating
depression guidelines to education strategies such as academic detailing and multi-component strategies in-volving education plus additional components (e.g., re-minders or strategies tailored to individual providers) (see Table1).
The methodological rigor of the included studies was variable; however, all studies were rated high risk of per-formance bias related to the lack of blinding of interven-tion providers. It was generally impossible for a provider to be blinded to delivery of the interventions of interest. With respect to the potential for contamination (i.e., both groups sharing material meant for the intervention group), only three out of the 22 studies were judged to be high risk of contamination bias. Half of the included studies described the context and organizational readi-ness for quality improvement, while the other half did not meet these criteria. Twelve studies met the criterion for reach/penetration domain and described the number of providers or departments that participated in the study compared to the number of available and poten-tially eligible participants or departments. Only one study addressed the sustainability of the intervention. Details for all critical appraisal domains are shown in Additional file1: Appendix B.
Main indications of adherence to depression guidelines
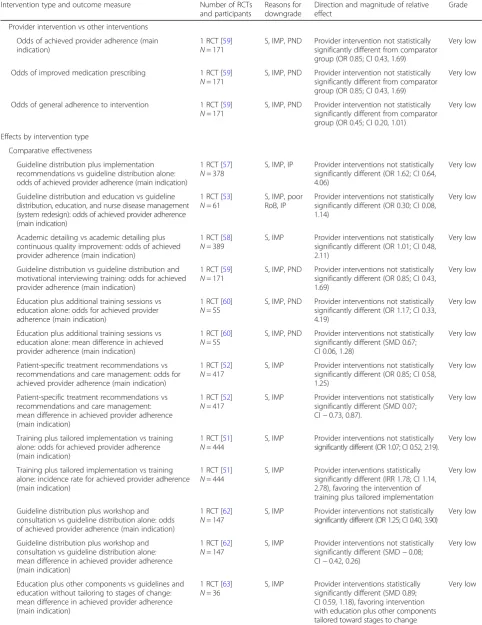
Table1 outlines the findings from individual studies and Table2 summarizes the evidence for the pooled analyses that utilized the available dichotomous, continuous, and IRR adherence outcomes. Additional file 1: Appendix C includes a summary of findings table with quality of evi-dence details. Thirteen studies with 3158 participants re-ported on the odds of achieving provider adherence by comparing a provider intervention to UCP (Fig.2). Pooled analyses did not indicate a statistically significant differ-ence in the main guideline adherdiffer-ence outcomes across studies (OR 1.60; CI 0.76, 3.37; 13 RCTs;I282%; moderate QoE). Pooled analyses of nine studies, with 1236 participants, using a continuous outcome also did not show a statistically significant difference compared to UCP (SMD 0.17; CI−0.16, 0.50;I286%; low QoE) (Fig.3). Four studies reporting IRRs also showed no difference be-tween intervention and control groups (IRR 1.16; CI 0.63, 2.15;I291%; low QoE). However, all analyses showed sub-stantial heterogeneity. Lastly, three studies with 867 participants reported on the odds of achieving provider adherence by comparing a provider intervention to prac-tice redesign efforts; the difference was not statistically sig-nificant (OR 0.81; CI 0.30, 2.19;I220%).
Medication prescribing
Table
1
Evidence
table
of
included
studies
(Continued)
Study
details
Participants
Interven
tion
and
treatme
nt
Outcom
es
and
results
–
EMR
—
active
care
vs
EMR
—
usual
car
e,
MD
−
0.91
(95%
CI
not
calculable)
–
EMR
—
passive
care
vs
EMR
—
usual
care,
MD
−
0.69
(95%
CI
not
calculable)
≥
3
cont
acts
with
usual
PCP
at
6
mont
hs
–
EMR
—
active
care
vs
EMR
—
usual
car
e,
OR
1.58
(95%
CI
1.
12,
2.21)
–
EMR
—
passive
care
vs
EMR
—
usual
care,
OR
1.50
(95%
CI
1.
06,
2.11)
Antide
press
ant
medi
cation
not
offe
red
at
6
mont
hs
–
EMR
—
active
care
vs
EMR
—
usual
car
e,
OR
1.48
(95%
CI
0.
93,
2.36)
–
EMR
—
passive
care
vs
EMR
—
usual
care,
OR
1.45
(95%
CI
0.
92,
2.29)
Antide
press
ant
meds
baseline
regimen
continu
ed
with
out
mod
ification
at
6
mont
hs
–
EMR
—
active
care
vs
EMR
—
usual
car
e,
OR
2.43
(95%
CI
0.
68,
8.76)
–
EMR
—
passive
care
vs
EMR
—
usual
care,
OR
2.66
(95%
CI
0.
75,
9.38)
Antide
press
ant
meds
suggested/pre
scribed
or
basel
ine
regim
en
mod
ified
at
6
mon
ths
–
EMR
—
active
care
vs
EMR
—
usual
car
e,
OR
1.14
(95%
CI
0.
83,
1.56)
–
EMR
—
passive
care
vs
EMR
—
usual
care,
OR
1.11
(95%
CI
0.
81,
1.52)
Dep
ression
me
ntioned
in
≥
3
contac
ts
with
usual
PCP
at
6
mont
hs
–
EMR
—
active
care
vs
EMR
—
usual
car
e,
OR
1.74
(95%
CI
0.
91,
3.31)
–
EMR
—
passive
care
vs
EMR
—
usual
care,
OR
1.77
(95%
CI
0.
94,
3.35)
Dep
ression
me
ntioned
in
an
y
contac
t
with
usual
PCP
at
6
mont
hs*
–
EMR
—
active
care
vs
EMR
—
usual
car
e,
OR
1.07
(95%
CI
0.
88,
1.29)
–
EMR
—
passive
care
vs
EMR
—
usual
care,
OR
1.17
(95%
CI
0.
99,
1.40)
Dep
ression
tre
atmen
t
menti
oned
in
≥
3
contac
ts
with
usual
PCP
at
6
month
s
–
EMR
—
active
care
vs
EMR
—
usual
car
e,
OR
1.33
(95%
CI
0.
67,
2.63)
–
EMR
—
passive
care
vs
EMR
—
usual
care,
OR
1.29
(95%
CI
0.
65,
2.56)
Menta
l
heal
th
refe
rral
sugge
sted
at
6
mont
hs
–
EMR
—
active
care
vs
EMR
—
usual
car
e,
OR
0.75
(95%
CI
0.
44,
Table 1 Evidence table of included studies (Continued) Study details Participants Interven tion and treatme nt Outcom es and results – EMR — passive care vs EMR — usual care, OR 1.01 (95% CI 0. 64, 1.59) PCP coun sels patie nt for de press ion at 6 mont hs – EMR — active care vs EMR — usual car e, OR 1.19 (95% CI 0. 63, 2.25) – EMR — passive care vs EMR — usual care, OR 0.95 (95% CI 0. 49, 1.87) Patien t health outcom es: HRS-D score at 3 mont hs – EMR — active care vs EMR — usual car e, MD − 1.50 (95% CI not calculable) – EMR — passive care vs EMR — usual care, MD 0. 50 (95% CI not calc ulable) HRS-D score at 6 mont hs – EMR — active care vs EMR — usual car e, MD − 1.50 (95% CI not calculable) – EMR — Passive care vs EMR — usual car e, MD − 1.50 (95% CI not calculable) Recov ery rate (HR S-D ≤ 7) at 6 mon ths – EMR — active care vs EMR — usual car e, OR 0.98 (95% CI 0. 50, 1.91) – EMR — passive care vs EMR — usual care, OR 1.05 (95% CI 0. 55, 2.00) Shiraz i [ 63 ]; Shiraz i, 2009 [ 95 ] Count ry: Iran Setting : primary care office Rand omization unit: provi der Numb er of site s: NR Provide rs: 192 (96 interve ntion, 96 cont rol) PCPs Patien ts: 10 SPs Diagnosis: othe r depression diagno sis (SPs with de press ive symptom s) Interven tion: continu ing me dical educ ation course tai lored toward self-reported st age of chang e. Guidelines generate d by researchers bas ed on lite rature review Comparat or: othe r (guidelines an d ed ucation witho ut tailori ng to stage of chang e) Timin g of follow-up: 2 month s Provi der behaviors : Perf ormance score on app ropri ate treat ment (pres cription, lab tests, refe rrals) at 2 mon ths* – Interven tion — large group vs contro l — large gro up, MD − 24 .00 (95% CI − 44.08, − 3.92 ) – Interven tion — small group vs contro l — small group, MD − 36.00 (95% CI − 46.76, − 25 .24) – Tailored education vs cedu cation, MD − 27.00 (95% CI − 35.6 0, − 18.40) Patien t health outcom es: NR Simon [ 52 ] Count ry: USA Setting : primary care office Rand omization unit: patien t Numb er of site s: 5 Provide rs: numbe r NR ; PCPs Numb er of pat ients: 613 patie nts at particip ating five primary care cl inics who ha d rece ived new prescrip tions for antide pressan ts, with “ new ” defined as no antide press ant use in the previou s 120 days Diagnosis: de press ion (cli nical dia gnosi s) Interven tion: receipt of de tailed patien t report and treat ment recom mendat ions bas ed on a compu terized algorithm. Guidelines not specifie d Main dicho tomous out come: patie nts who rece ive adequ ate pharm acothe rapy (low do se, > 90 days) Comparat or: U C, other (feed back interve ntion plu s care manageme nt) Timin g of follow-up: 6 month s Provi der behaviors : Menta l heal th vis its to non-pre scrib ing provi der at 6 mont hs – Feedback onl y vs feed back plus care manageme nt, MD − 0.10 (95% CI − 0.93 ,
0.73) –Feedback
Table 1 Evidence table of included studies (Continued) Study details Participants Interven tion and treatme nt Outcom es and results – Feedback onl y vs feed back plus care manageme nt, MD − 0.04 (95% CI − 0.48 ,
0.40) –Feedback
Table
1
Evidence
table
of
included
studies
(Continued)
Study
details
Participants
Interven
tion
and
treatme
nt
Outcom
es
and
results
Treat
ment
with
me
dication
at
12
mont
hs
OR
1.60
(95%
CI
1.
28,
1.98)
Patien
t
health
outcom
es:
Improve
d
PHQ-9
,
if
history
of
depre
ssion
at
12
mont
hs
OR
1.24
(95%
CI
0.86,
1.79
)
Improve
d
PHQ-9
,
if
postpartum
depression
was
dia
gnosed
at
12
mont
hs
O
R
1.10
(95%
CI
0.77
,
1.56)
Note:
*
indicates
a
selected
main
adherence
provider
outcome;
#
number
of;
1selected
main
adherence
provider
outcome
not
able
to
be
included
in
analyses
due
to
no
reported
standard
deviation.
APA
American
Psychiatric
Association;
ASTROPU
Age,
Sex
and
Temporary
Resident
Originated
Prescribing
Units;
DDD
defined
daily
doses;
TCA
Tricyclic
antidepressant
s
;
UC
usual
care;
NR
not
reported;
GP
general
practitioner;
PCP
primary
care
physician/provider;
IRR
incident
rate
ratio;
OR
odds
ratio;
MD
mean
difference;
CI
confidence
interval;
AD
academic
detailing;
PHQ-9
Patient
Health
Questionnaire-9;
PRIME-MD
PRIMary
care
Evaluation
of
Mental
Disorders;
WHODAS-II
World
Health
Organization
Disability
Assessment
Schedule;
4DSQ
The
Four-Dimensional
Symptom
Questionnaire;
HDRS/HAM-D
Hamilton
Depression
Rating
Scale;
CES-D
Center
for
Epidemiologic
Studies
Depression
effect favoring the intervention compared to UCP (OR 1.42; CI 1.04, 1.92; I253%). Intervention providers were more likely to prescribe according to clinical practice guidelines. Three studies with 414 participants did not indicate a statistically significant effect in reporting on a continuous outcome (SMD 0.15; CI−0.48, 0.79;I237%). Three studies reporting on IRRs did not show a differ-ence between intervention and control groups (IRR 1.02; CI 0.44, 2.36;I290%). Two studies with 1738 participants with a practice redesign comparator showed conflicting results, and pooled results were not statistically significant (OR 0.96; CI 0.18, 5.08; I2 0%). Additional file 1: Appendix C contains further details of these analyses and analyses for all other individual outcomes summarize below.
Contact with patients
Three studies with 710 participants reported on the odds of increased patient contacts in studies comparing a pro-vider intervention with UCP. The pooled analysis showed no statistically significant difference between intervention and control groups (OR 6.40; CI 0.13, 322.40;I275%). Similarly, three studies comparing a pro-vider intervention with UCP, with 225 participants, also did not report a statistically significant difference using continuous outcomes (SMD 0.17; CI −0.84, 1.19; I2 56%). One study [51] with 444 participants reported IRR data on the number of provider consultations at 6-month follow-up. This study reported a significant
effect favoring the intervention, which consisted of train-ing on guidelines and consultations from experts to ad-dress personal barriers to implementing guidelines (IRR 1.78; CI 1.14, 2.78). The only study reporting outcomes on contact with patients compared to a system redesign effort was a small study of 24 participants [52]; the study found no difference for the outcome (SMD 0.07; CI−0.73, 0.87). Providers in this study intervention group received a de-tailed report on their patients that contained treatment recommendations based on a computerized algorithm, while the system redesign group received this feedback enhanced with care management of patients by care managers who helped to implement the physicians’ recommendations.
Specific intervention adherence
Table 2Summary of findings
Intervention type and outcome measure Number of RCTs and participants
Reasons for downgrade
Direction and magnitude of relative effect
Grade
Effects of provider intervention on healthcare professional behavior
Provider intervention vs UCP
Odds of achieved provider adherence (main indication) 13 RCTs [51,52, 57,58,60–62,64, 78–83] N= 3158
H Provider interventions not statistically significantly different from comparator groups (OR 1.60; CI 0.76, 3.37)
Moderate
Mean difference in achieved provider adherence (main indication)
9 RCTs [52,60,62, 63,83–87,92,93] N= 1236
H, DE Provider interventions not statistically significantly different from comparator groups (SMD 0.17; CI−0.16, 0.50)
Low
Incidence rate of achieved provider adherence (main indication)
4 RCTs [51,65, 78,93] N= 63,588
H, IMP Provider interventions not statistically significantly different from comparator groups (IRR 1.16; CI 0.63, 2.14)
Low
Odds of improved medication prescribing 11 RCTs [51,52, 57,58,60–62,64, 78,81,82] N= 4116
H, IMP Provider interventions statistically significantly different from comparator groups (OR 1.42; CI 1.04, 1.92) favoring the intervention
Low
Mean difference in improved medication prescribing 3 RCTs [86] N= 414
DE, IMP Provider interventions not statistically significantly different from comparator groups (SMD 0.15; CI−0.48, 0.79)
Low
Incidence rate of improved medication prescribing 3 RCTs [65,78,93] N= 63,144
H, IMP Provider interventions not statistically significantly different from comparator group (IRR 1.02; CI 0.44, 2.36)
Low
Odds for increased contact with patients 3 RCTs [61,64,82] N= 710
H, IMP Provider interventions not statistically significantly different from comparator groups (OR 6.40; CI 0.13, 322.40)
Low
Mean difference in contact with patients 3 RCTs [52,60,62] N= 225
IMP Provider interventions not statistically significantly different from comparator groups (SMD 0.17; CI−0.84, 1.19)
Moderate
Incidence rate of number of consultations (contact with patients)
1 RCT [51] N= 444
S Provider intervention statistically significantly different from comparator group (IRR 1.78; CI 1.14, 2.78) favoring the intervention
Very low
Odds of general adherence to intervention 6 RCTs [57,61, 64,79,82,83] N= 1375
H, IMP Provider interventions not statistically significantly different from comparator groups (OR 2.26; CI 0.50, 10.28)
Low
Mean difference in general adherence to intervention 3 RCTs [63,84,86] N= 597
H, DE, IMP Provider interventions not statistically significantly different from comparator groups (SMD 0.23; CI−1.42, 1.89)
Very low
Odds of referral offered to patient 4 RCTs [51,61,62,81] N= 896
IMP Provider interventions not statistically significantly different from comparator groups (OR 1.11; CI 0.33, 3.70)
Moderate
Provider intervention vs practice redesign
Odds of achieved provider adherence (main indication) 3 RCTs [52,53, 58]
N= 867
IMP Provider interventions not statistically significantly different from comparator groups (OR 0.81; CI 0.30, 2.19)
Moderate
Mean difference in achieved provider adherence (main indication)
1 RCT [52] N= 24
S Provider intervention not statistically significantly different from comparator group (SMD 0.07; CI−0.73, 0.87)
Low
Odds of improved medication prescribing 2 RCTs [52,58] N= 1738
DE, IMP Provider interventions not statistically significantly different from comparator groups (OR 0.96; CI 0.18, 5.08)
Low
Mean difference in contact with patients 1 RCT [52] N= 24
S Provider intervention not statistically significantly different from comparator group (SMD 0.07; CI−0.73, 0.87)
Low
Odds of general adherence to intervention 1 RCT [53] N= 61
Poor RoB, IP, S
Provider interventions not statistically significantly different from comparator groups (OR 0.30; CI 0.08, 1.14)
Table 2Summary of findings(Continued)
Intervention type and outcome measure Number of RCTs and participants
Reasons for downgrade
Direction and magnitude of relative effect
Grade
Provider intervention vs other interventions
Odds of achieved provider adherence (main indication)
1 RCT [59] N= 171
S, IMP, PND Provider intervention not statistically significantly different from comparator group (OR 0.85; CI 0.43, 1.69)
Very low
Odds of improved medication prescribing 1 RCT [59] N= 171
S, IMP, PND Provider intervention not statistically significantly different from comparator group (OR 0.85; CI 0.43, 1.69)
Very low
Odds of general adherence to intervention 1 RCT [59] N= 171
S, IMP, PND Provider intervention not statistically significantly different from comparator group (OR 0.45; CI 0.20, 1.01)
Very low
Effects by intervention type
Comparative effectiveness
Guideline distribution plus implementation recommendations vs guideline distribution alone: odds of achieved provider adherence (main indication)
1 RCT [57] N= 378
S, IMP, IP Provider interventions not statistically significantly different (OR 1.62; CI 0.64, 4.06)
Very low
Guideline distribution and education vs guideline distribution, education, and nurse disease management (system redesign): odds of achieved provider adherence (main indication)
1 RCT [53] N= 61
S, IMP, poor RoB, IP
Provider interventions not statistically significantly different (OR 0.30; CI 0.08, 1.14)
Very low
Academic detailing vs academic detailing plus continuous quality improvement: odds of achieved provider adherence (main indication)
1 RCT [58] N= 389
S, IMP Provider interventions not statistically significantly different (OR 1.01; CI 0.48, 2.11)
Very low
Guideline distribution vs guideline distribution and motivational interviewing training: odds for achieved provider adherence (main indication)
1 RCT [59] N= 171
S, IMP, PND Provider interventions not statistically significantly different (OR 0.85; CI 0.43, 1.69)
Very low
Education plus additional training sessions vs education alone: odds for achieved provider adherence (main indication)
1 RCT [60] N= 55
S, IMP, PND Provider interventions not statistically significantly different (OR 1.17; CI 0.33, 4.19)
Very low
Education plus additional training sessions vs education alone: mean difference in achieved provider adherence (main indication)
1 RCT [60] N= 55
S, IMP, PND Provider interventions not statistically significantly different (SMD 0.67; CI 0.06, 1.28)
Very low
Patient-specific treatment recommendations vs recommendations and care management: odds for achieved provider adherence (main indication)
1 RCT [52] N= 417
S, IMP Provider interventions not statistically significantly different (OR 0.85; CI 0.58, 1.25)
Very low
Patient-specific treatment recommendations vs recommendations and care management: mean difference in achieved provider adherence (main indication)
1 RCT [52] N= 417
S, IMP Provider interventions not statistically significantly different (SMD 0.07; CI−0.73, 0.87).
Very low
Training plus tailored implementation vs training alone: odds for achieved provider adherence (main indication)
1 RCT [51] N= 444
S, IMP Provider interventions not statistically significantly different (OR 1.07; CI 0.52, 2.19).
Very low
Training plus tailored implementation vs training alone: incidence rate for achieved provider adherence (main indication)
1 RCT [51] N= 444
S, IMP Provider interventions statistically significantly different (IRR 1.78; CI 1.14, 2.78), favoring the intervention of training plus tailored implementation
Very low
Guideline distribution plus workshop and consultation vs guideline distribution alone: odds of achieved provider adherence (main indication)
1 RCT [62] N= 147
S, IMP Provider interventions not statistically significantly different (OR 1.25; CI 0.40, 3.90)
Very low
Guideline distribution plus workshop and consultation vs guideline distribution alone: mean difference in achieved provider adherence (main indication)
1 RCT [62] N= 147
S, IMP Provider interventions not statistically significantly different (SMD−0.08; CI−0.42, 0.26)
Very low
Education plus other components vs guidelines and education without tailoring to stages of change: mean difference in achieved provider adherence (main indication)
1 RCT [63] N= 36
S, IMP Provider interventions statistically significantly different (SMD 0.89; CI 0.59, 1.18), favoring intervention with education plus other components tailored toward stages to change
Table 2Summary of findings(Continued)
Intervention type and outcome measure Number of RCTs and participants
Reasons for downgrade
Direction and magnitude of relative effect
Grade
Guideline distribution (passive) vs guideline distribution (active): odds of achieved provider adherence (main indication)
1 RCT [61] N= 138
S, IMP, IP Provider interventions not statistically significantly different (OR 1.76; CI 0.64, 4.86)
Very low
Indirect comparison
Meta-regression education only vs education plus for odds of achieved provider adherence (main indication)
10 RCTs [51,52, 58,60,62,64, 78,79,82,83] N= 2957
I, IMP No systematic effect detected (p= 0.574) Very low
Meta-regression education only vs education plus for mean difference in achieved provider adherence (main indication)
8 RCTs [52,60, 62,63,84, 85–87,92,93] N= 712
I, IMP No systematic effect detected (p= 0.238) Very low
Meta-regression unidimensional vs multidimensional for odds of achieved provider adherence
(main indication)
13 RCTs [52,57,58, 60–63,78–83,92] N= 2953
I, IMP No systematic effect detected (p= 0.707) Very low
Meta-regression unidimensional vs multidimensional for mean difference in achieved provider adherence (main indication)
9 RCTs [52,60,62, 63,83–87,92,93] N= 1236
I, IMP No systematic effect detected (p= 0.055) Very low
Meta-regression unidimensional vs multidimensional for odds of improved medical prescribing
12 RCTs [51,52, 57–62,64,78, 81,82] N= 2678
I, IMP No systematic effect detected (p= 0.317) Very low
Meta-regression unidimensional vs multidimensional for odds of referral offered to patients
4 RCTs [51,61, 62,81] N= 896
I, IMP No systematic effect detected (p= 0.195) Very low
Meta-regression intervention intensity for odds of achieved provider adherence (main indication)
13 RCTs [51,52, 57,58,60–62,64, 78–83] N= 3158
I, IMP No systematic effect detected (p= 0.973) Very low
Meta-regression intervention intensity for mean difference in achieved provider adherence (main indication)
9 RCTs [52,60,62, 63,83–87,92,93] N= 1236
I, IMP The analysis suggested that the intensity of the intervention is associated with the effect size (p= 0.033)
Very low
Meta-regression intervention intensity for odds of improved medical prescribing
12 RCTs [51,52, 57–62,64,78, 81,82] N= 2678
I, IMP No systematic effect detected (p= 0.414) Very low
Meta-regression intervention intensity for odds of general adherence to intervention
8 RCTs [53,57,59, 61,64,79,82,83] N= 2411
I, IMP No systematic effect detected (p= 0.542) Very low
Subgroup analyses by intervention type
Guideline distribution only: odds of achieved provider adherence (main indication)
3 RCTs [57,61,81] N= 683
IMP Provider interventions not statistically significantly different from comparator groups (OR 1.28; CI 0.75, 2.19)
Low
Guideline distribution only: mean difference for achieved provider adherence (main indication)
1 RCT [86] N= 281
S, IMP, PND Provider intervention statistically significantly different from comparator group (SMD−0.44; CI−0.68,−0.20), favoring the comparator
Very low
Guideline distribution only: odds of improved medication prescribing
4 RCTs [57,59, 61,81] N= 854
H, IMP Provider interventions not statistically significantly different from comparator groups (OR 1.52; CI 0.60, 3.86)
Low
Guideline distribution only: odds of increased provider contact with patients
1 RCT [61] N= 130
S, IMP, IP Provider intervention statistically significantly different from comparator group (OR 2.71; CI 1.24, 5.94)
Very low
Guideline distribution only: odds of general adherence to intervention
3 RCTs [57,59,61]
Table 2Summary of findings(Continued)
Intervention type and outcome measure Number of RCTs and participants
Reasons for downgrade
Direction and magnitude of relative effect
Grade
N= 679 Provider interventions not statistically significantly different from comparator groups (OR 0.95; CI 0.17, 5.17)
Education only: odds of achieved provider adherence (main indication)
3 RCTs [79,82,83] N= 338
H, IMP Provider interventions not statistically significantly different from comparator groups (OR 3.04; CI 0.01, 756.17)
Low
Education only: mean difference in achieved provider adherence (main indication)
3 RCTs [86] N= 414
IMP Provider interventions not statistically significantly different from comparator groups (SMD 0.15; CI−0.48, 0.79)
Moderate
Education only: odds of improved medication prescribing
1 RCT [82] N= 48
S, IMP Provider intervention not statistically significantly different from comparator group (OR 2.78; CI 0.80, 9.59)
Very low
Education only: odds of increased provider contact with patients
1 RCT [82]) N= 48
S, IMP Provider intervention statistically significantly different from comparator group (OR 6.42; CI 1.78, 23.18)
Very low
Education only: odds of general adherence to intervention
4 RCTs [53,79, 82,83] N= 399
H, IMP Provider interventions not statistically significantly different from comparator groups (OR 2.03; CI 0.06, 73.30)
Very low
Education plus other components: odds for achieved provider adherence (main indication)
7 RCTs [51,52, 58,60,62,64,78] N= 2090
IMP Provider interventions not statistically significantly different from comparator groups (OR 1.17; CI 0.62, 2.18)
Moderate
Education plus other components: mean difference in achieved provider adherence (main indication)
5 RCTs [52,60, 62,63,84] N= 938
H, IMP Provider interventions not statistically significantly different from comparator groups (SMD 0.37; CI−0.16, 0.90)
Low
Education plus other components: odds of improved medical prescribing
7 RCTs [51,52, 58,60,62,64,78] N= 1710
H Provider interventions not statistically significantly different from comparator groups (OR 1.21; CI 0.85, 1.71)
Low
Education plus other components: odds of increased provider contact with patients
1 RCT [64] N= 483
S, IMP Provider interventions statistically significantly different from comparator group (OR 101.34; CI 6.17, 1664.08)
Very low
Education plus other components: odds of general adherence to intervention
1 RCT [64] N= 482
S Provider interventions statistically significantly different from comparator group (OR 2.56; CI 1.65, 3.97)
Very low
Effects by provider type
Meta-regression single provider vs team for odds of achieved provider adherence (main indication)
13 RCTs [51,52, 57,58,60–62,64, 78–83] N= 3158
I, IMP The analysis suggested that the type of provider is associated with the effect size (p= 0.034); however, the analysis is based on only 1 team intervention
Very low
Subgroup analysis by provider type
Single provider interventions: odds for achieved provider adherence (main indication)
12 RCTs [51,52, 57,58,60–62, 78–83] N= 1334
H, IMP Provider interventions not statistically significantly different from comparator groups (OR 1.42; CI 0.74, 2.73)
Low
Team provider interventions: odds of achieved provider adherence (main indication)
1 RCT [64] N= 482
S, IMP Provider intervention statistically significantly different from comparator group (OR 101.34, CI 6.17, 1664.08), favoring the intervention
Very low
Effect by setting
Meta-regression primary care vs specialty care setting for mean difference in achieved adherence (main indication)
9 RCTs [52,60,62, 63,83–87,92,93] N= 1236
I, IMP No systematic effect detected (p= 0.385); however, the analysis is based on only 2 specialty care interventions
Very low
Patient outcomes
not indicate a statistically significant difference (SMD 0.23; CI−1.42, 1.89;I296%). No study reported on IRR outcomes. One small, high risk of bias study [53] re-ported on a measure of intervention adherence where a provider intervention was compared to practice re-design. There was no statistically significant difference between comparator and intervention, which offered education and distribution of practice guidelines to pri-mary care providers (OR 0.30; CI 0.08, 1.14).
Referral offered to patients
Four studies with 896 participants and a UCP compara-tor reported on the odds of improved referral offered to patients by providers. The pooled analysis did not indi-cate a systematic intervention effect (OR 1.11; CI 0.33,
3.70; I241%). No identified studies reported on continu-ous or IRR outcomes on referral outcomes compared to practice redesign.
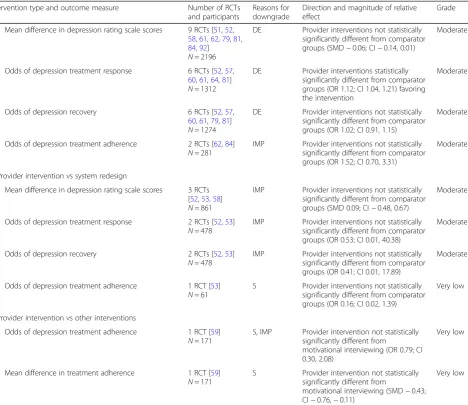
Patient outcomes
We identified 14 studies that reported patient out-comes. Specifically, these studies reported changes in depression rating scale scores, depression treatment re-sponse (i.e., proportion of patients with improvement, including remission), depression recovery (i.e., proportion of patients in remission/not meeting depression criteria at follow-up), and treatment adherence (e.g., medication ad-herence). Nine studies with 2196 participants reported on the mean difference in patient depression rating scales, such as the Hamilton Rating Scale for Depression [54] or Table 2Summary of findings(Continued)
Intervention type and outcome measure Number of RCTs and participants
Reasons for downgrade
Direction and magnitude of relative effect
Grade
Mean difference in depression rating scale scores 9 RCTs [51,52, 58,61,62,79,81, 84,92] N= 2196
DE Provider interventions not statistically significantly different from comparator groups (SMD−0.06; CI−0.14, 0.01)
Moderate
Odds of depression treatment response 6 RCTs [52,57, 60,61,64,81] N= 1312
DE Provider interventions statistically significantly different from comparator groups (OR 1.12; CI 1.04, 1.21) favoring the intervention
Moderate
Odds of depression recovery 6 RCTs [52,57, 60,61,79,81] N= 1274
DE Provider interventions not statistically significantly different from comparator groups (OR 1.02; CI 0.91, 1.15)
Moderate
Odds of depression treatment adherence 2 RCTs [62,84] N= 281
IMP Provider interventions not statistically significantly different from comparator groups (OR 1.52; CI 0.70, 3.31)
Moderate
Provider intervention vs system redesign
Mean difference in depression rating scale scores 3 RCTs [52,53,58] N= 861
IMP Provider interventions not statistically significantly different from comparator groups (SMD 0.09; CI−0.48, 0.67)
Moderate
Odds of depression treatment response 2 RCTs [52,53] N= 478
IMP Provider interventions not statistically significantly different from comparator groups (OR 0.53; CI 0.01, 40.38)
Moderate
Odds of depression recovery 2 RCTs [52,53] N= 478
IMP Provider interventions not statistically significantly different from comparator groups (OR 0.41; CI 0.01, 17.89)
Moderate
Odds of depression treatment adherence 1 RCT [53] N= 61
S Provider interventions not statistically significantly different from comparator groups (OR 0.16; CI 0.02, 1.39)
Very low
Provider intervention vs other interventions
Odds of depression treatment adherence 1 RCT [59] N= 171
S, IMP Provider intervention not statistically significantly different from
motivational interviewing (OR 0.79; CI 0.30, 2.08)
Very low
Mean difference in treatment adherence 1 RCT [59] N= 171
S Provider intervention not statistically significantly different from
motivational interviewing (SMD−0.43; CI−0.76,−0.11)
Very low
the Center for Epidemiologic Studies Depression Scale [55]. A pooled analysis comparing provider interventions to UCP did not indicate a difference in patient outcomes associated with the intervention (SMD −0.06; CI−0.14, 0.01; I2 0%). Six studies with 1312 participants reported on depression treatment response (e.g., a score less than 11 on the Beck Depression Inventory [56]). The pooled analysis indicated a statistically significant effect favoring the provider interventions when compared to UCP (OR 1.12; CI 1.04, 1.21; I2 0%). Six studies with 1274 partici-pants reported on patient recovery from depression; the pooled analysis did not indicate a statistically significant effect of the provider intervention when compared to UCP (OR 1.02; CI 0.91, 1.15;I20%). Two studies involving 281 participants and a UCP comparator reported on pa-tient treatment adherence as indicated by the number or proportion of patients who took prescribed antidepres-sants as indicated. The pooled analysis did not indicate a statistically significant difference between the provider intervention and UCP (OR 1.52; CI 0.70, 3.31; I2 0%). Lastly, three studies with 861 participants reported on the mean difference in patient depression rating scales as
compared to practice redesign efforts. The pooled analysis did not indicate a statistically significant difference be-tween the provider intervention and practice redesign (SMD 0.09; CI−0.48, 0.67;I252%). Two studies with 478 participants and a practice redesign comparator reported on depression treatment response; the analysis did not in-dicate a statistically significant difference (OR 0.53; CI 0.01, 40.38;I226%).
Findings by type of intervention
group that received provider training in guidelines plus tailored implementation for the incidence risk for achieving provider adherence (IRR 0.85; CI 0.43, 1.69). The other study reporting a significant difference [63], involving 389 participants, found a statistically signifi-cant mean difference between intervention and com-parator groups (SMD 0.89; CI 0.59, 1.18). The intervention consisted of a 2-day continuing medical education course focused on treatment and differential diagnosis of depression disorders. Providers were assigned to groups in which the education component was tailored to the providers’ self-reported stage of change. The comparator group also received education on treatment and diagnosis of depression disorders (including the same 2-day continuing medical education course), but the education was not tailored to the pro-viders’stage of change.
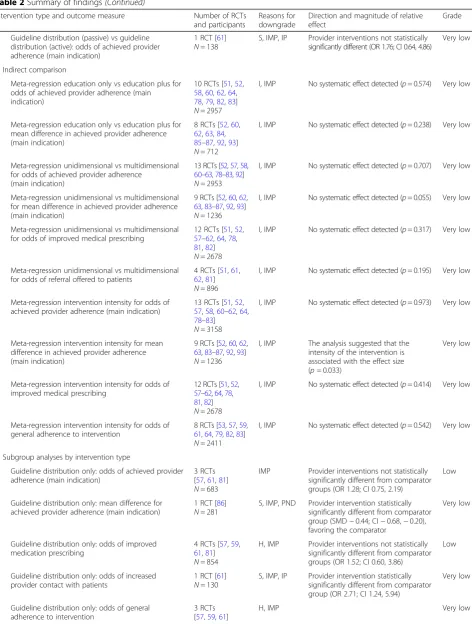
Indirect comparisons using meta-regression deter-mined whether within the range of eligible provider in-terventions, those that combined education with other components, such as tailored implementation strategies, reported better results than education-only interventions. The analyses did not indicate that inter-ventions classified as education only systematically reported different effects than interventions with
additional components (dichotomous outcomesp= 0.574, continuous outcomesp= 0.238). We also compared unidi-mensional and multidiunidi-mensional interventions. We found no statistically significant effect for dichotomous out-comes (p= 0.707), but the equivalent analysis for studies reporting continuous outcomes approached statistical sig-nificance (p= 0.055). To explore this finding further, we rated the intensity of the intervention on a 3-point scale. A meta-regression for the dichotomous adherence out-come did not show an effect (p= 0.973); however, the analysis of the continuous adherence outcome sug-gested that the intensity of the intervention was associ-ated with the effect size (i.e., the greater the intensity, the greater the adherence; p= 0.033). The analysis should be interpreted with caution because of the small number of studies contributing to individual intensity rating categories.
indication of adherence outcomes within these broad subgroups. All three subgroups still reported no statis-tically significant differences between the intervention and the comparator groups. There was no statistically significant intervention effect in studies that simply dis-tributed treatment guidelines (OR 1.28; CI 0.75, 2.19; 3 RCTs; I2 0%; SMD −0.44; CI −0.68, −0.20; 1 RCT). Three studies evaluated an education intervention and showed conflicting results (OR 3.04; CI 0.01, 756.17;I2 95. SMD 0.15; CI−0.48, 0.79;I237%). The pooled ana-lysis of studies of education plus other components also did not indicate a statistically significant intervention effect (OR 1.17; CI 0.62, 2.18; I2 44%, 7 RCTs. SMD 0.37; CI−0.16, 0.90;I280%; 5 RCTs).
Findings by provider target
We did not identify any studies directly comparing ef-fects for different types of healthcare providers. We in-directly compared the 20 interventions that targeted single providers and the two that targeted teams. For the dichotomous adherence outcome, a meta-regression in-dicated that the intervention effect systematically varied by the type of provider targeted (p= 0.034); yet, the ana-lysis should be interpreted with caution because only one of the team studies contributed data to this [64]. The effect was not replicated in an analysis based on IRR data that compared the other team intervention [65] with the three sole provider interventions that had count outcomes (p= 0.352).
For subgroup analyses, we stratified the results by inter-ventions on single providers versus teams of providers (see Additional file 1: Appendix C). Pooled analyses of studies of interventions that targeted single providers did not report a statistically significant intervention effect on the main adherence outcome (OR 1.42; CI 0.74, 2.73; 12 RCTs;I280%). One study [64] compared a team interven-tion to a control, and the effect for provider follow-up with patients was significant in favor of the intervention group at 12-month follow-up (OR 101.34, CI 6.17, 1664.08). Given the wide confidence interval, we looked at another main adherence outcome (i.e., whether the patient received medication plus counseling) and similarly found an effect favoring the team intervention (OR 1.50; CI 0.83, 2.73).
Findings by setting
We did not identify any studies directly comparing the effects of the setting. To assess whether effects varied by setting, we compared two studies conducted in specialty care settings with 20 conducted in primary care settings (see Additional file 1: Appendix C). A meta-regression on the main continuous adherence outcome did not sug-gest any systematic effects of the setting (p= 0.385), but
the result should be interpreted with caution as only two studies provided data on specialty care settings.
Discussion
This systematic review compiles research evidence on the effects of healthcare provider interventions on ad-herence to guidelines or guideline-concordant behavior for depression treatment. We excluded system redesign efforts as interventions for our purposes (e.g., collabora-tive care where infrastructures are re-organized) and tar-geted studies that included provider behavior change outcomes. Our findings provide little support for the ef-fectiveness of currently tested provider education or dis-semination interventions on provider adherence to depression treatment guidelines; however, there was some evidence that provider interventions improved the outcomes of medication prescribing and patient depres-sion treatment response. Results also suggested that some interventions that were tailored to providers’needs and that went beyond simply distributing guidelines to providers may improve provider behavior and promote guideline adherence.
Our findings are important for several reasons. First, it is important for healthcare systems to know whether the approaches identified in our review, all of which are less costly to implement than major systems change inter-ventions, such as collaborative care, can change provider behavior. Second, few, if any, interventions including collaborative care for depression are undertaken without an education-focused component. This study can help focus efforts to better evaluate and improve this compo-nent. Third, provider education can be a critical step in promoting readiness to improve depression care and, if carried out effectively, may often be the best first imple-mentation step in depression care improvement initia-tives. This study provides a foundation for further development of provider education and dissemination methods for improving depression care.
personal implementation barriers) may be associated with more favorable outcomes. However, we did not identify subgroups of interventions that were consist-ently associated with significant changes in provider be-havior. The individual successful approaches observed for main adherence outcomes have not been investigated in more than one study, and findings have not been replicated across independent researcher groups. More studies are needed that attempt to isolate specific pro-vider interventions employed either within system rede-signs or in studies that evaluate provider interventions specifically. As described, the methodological rigor in in-cluded research studies varied, but none of our analyses were exclusively based on poor quality studies. We also found no indication of publication bias. In addition, be-cause the outcomes we were interested in were often not the primary outcome of the research studies (e.g., studies were often interested in the impact on patients), we are also more confident that estimates in our review are less likely to be affected by publication bias. Still, given the diversity of the interventions evaluated in individual studies, the heterogeneity in results, and results based on single studies, often with imprecision in effect esti-mates and with follow-up periods of 1 year or less, the quality of evidence remains very limited.
Though we did not identify statistically significant dif-ferences for the main adherence outcomes across the in-terventions compared to UCP, analyses showed heterogeneity and wide confidence intervals that support the possibility of a large range of potential intervention effects. A pooled analysis of 11 RCTs indicated increased odds of improved medication prescribing, which is argu-ably the aspect of depression care most under the healthcare providers’control. There was no indication of publication bias; however, we detected considerable het-erogeneity and not all studies favored the intervention. Therefore, we believe the finding to have low quality of evidence. Furthermore, no statistically significant differ-ence emerged in an analysis for improved medication prescribing utilizing a continuous operationalization of the outcome. One study [51] showed an increased rate of contact with patients following training and consulta-tions from experts on guidelines that incorporated per-sonal barriers to implementing the guidelines, compared to UCP. However, the result is based on a single study, and therefore, we have limited confidence in this finding. No other specific provider behavior outcome was found to be significant for provider interventions compared to any comparator.
Due to the small number of studies reporting team in-terventions or inin-terventions in specialty care, we did not find statistically robust evidence that intervention effects varied by targeted provider group or setting. Our review findings suggest that interventions targeting
multidisciplinary team members are more effective than interventions targeting only healthcare providers dir-ectly, but additional research studies are needed to confirm this finding. Given the lack of studies in specialty care settings, more studies conducted in spe-cialty care settings are also needed to understand how evidence-based interventions can best be adopted by providers outside of psychiatric research settings.
The review findings for effects on patient health were mixed. Although depression treatment response im-proved across the identified intervention, we did not find significant effects for other patient outcomes such as de-pression rating scale scores, dede-pression recovery, or treatment adherence. The findings for patient outcomes should be interpreted in context because we restricted the review to studies that reported on provider out-comes. Prior reviews have evaluated how provider inter-ventions affect patient outcomes and have concluded that multi-faceted and system redesign approaches were more effective in improving patient outcomes than sim-pler or single component interventions, such as distribu-tion of guidelines and educadistribu-tion alone [30, 31]. Yet, our review set out to identify interventions that can be im-plemented in healthcare organizations without practice redesign efforts and more studies are needed that report on both provider behavior change outcomes and patient outcomes in order to better understand whether pro-vider behavior is affected by the intervention and if the change in provider behavior is ultimately affecting pa-tient health.
non-randomized controlled studies, time-series, pre-post studies, and cohort studies [67–73]. Second, by includ-ing only studies that measure provider behavior and out-comes, we were able to judge whether the intervention is having the intended effects on the target of the inter-vention (i.e., the providers). Nonetheless, this restriction excluded a large number of existing research studies that do not report on provider behavior. Third, to be in-cluded, studies had to report on depression treatment. Effects on improving recognition, screening, or diagnosis of patients or on increasing referral behavior to specialty mental health care settings should be assessed in future systematic reviews. Lastly, the individual interventions and promoted depression practice guidelines varied across studies. Our review included studies using prom-inent guidelines such as the Agency for Health Research and Quality (AHRQ) treatment guidelines for depression in primary care [74], in addition to studies using treat-ment guidelines for which we could not verify whether the guidelines were evidence-based. The specific guide-lines utilized within the interventions themselves varied and ranged from the American Psychiatric Association Practice Guidelines for the Treatment of Psychiatric Dis-orders to the Dutch College of General Practitioners’ Practice Guideline for Depression to the Agency for Health Care Policy and Research Practice Guidelines for Depression [75–77]. Many of the studies did not specify in detail how lengthy or how much of a time commit-ment the guidelines were for providers, which could have accounted for the provider change behaviors find-ings described within the individual included studies. Some standardization across studies regarding which and how guidelines were utilized in practice appears needed. Such standardization could help account for confounding factors in research studies, but the field may also benefit from a single source of information on best treatment practices for depression.
Conclusions and future directions
Fourteen years ago, Gilbody and colleagues [30] reviewed organizational and educational interventions targeted at primary care providers treating depressed patients. Authors concluded that effective strategies to improve de-pression management in this setting were multi-faceted (e.g., system redesign approaches including screening for depression, providing education to patients, and realign-ment of professional roles in an organization). Sikorski and colleagues [31] similarly concluded that provider training alone does not seem to improve depression care. Our review shows that, despite new research, provider in-terventions focused primarily on guideline distribution or education only are unlikely to be effective in the absence of additional components. Our review did not identify subgroups or categories of interventions that were
consistently associated with increased adherence to de-pression guidelines or guideline-concordant practices. These findings underscore the need for further research to better understand how to effectively change provider be-havior in differential care settings without organizational redesigns. Innovations are needed to support healthcare organizations that want to improve guideline adherence but do not intend to invest in efforts to restructure how care is delivered. Research on provider interventions should be supported by a framework that allows for a more structured assessment to identify successful inter-vention approaches and the effects of individual interven-tion components.
Additional file
Additional file 1:Appendix A:Search strategy.Appendix B:Critical
appraisal ratings using the Cochrane Risk of Bias tool and the QI-MQCS.
Appendix C:Detailed quality of evidence and summary of findings.
(DOCX 707 kb)
Acknowledgements
We are grateful to the Cochrane Effective Practice and Organisation of Care group and Jeremy Grimshaw for input and resources that shaped the scope of this review. We also thank John Williams and Thomas Concannon for their helpful comments and Patty Smith for administrative assistance.
Funding
The review was funded by the Defense Centers of Excellence for Psychological Health and Traumatic Brain Injury (DCoE). The findings and conclusions in this manuscript are those of the authors and do not necessarily represent the views of the Department of Defense Centers of Excellence for Psychological Health and Traumatic Brain Injury.
Availability of data and materials
All data generated or analyzed during this study are included in this published article and its supplementary information files (see Additional file1: Appendices A–C).
Authors’contributions
All authors have made substantial contributions to conception and design (EP, LR, MD, BB, SH), acquisition of data (EP, RK, AM, JL, SH), and analysis and interpretation of data (EP, LR, RK, AM, MB, SH). All were involved in drafting the manuscript (EP, LR, SH) and providing revisions (EP, LR, RK, MD, BB, AM, MB, JL, SH). All authors have given final approval of this final version to be published. EP and SH are accountable for all aspects of the work in ensuring that questions related to the accuracy or integrity of any part of the work are appropriately investigated and resolved.
Ethics approval and consent to participate
All procedures for this review were approved by the RAND Human Subjects Review Committee.
Consent for publication
Not applicable
Competing interests
LR is on the editorial board ofImplementation Science. All authors declare no other financial or non-financial competing interests.
Publisher’s Note