Homeostasis Model Assessment Is More Reliable Than the Fasting
Glucose/Insulin Ratio and Quantitative Insulin Sensitivity Check Index
for Assessing Insulin Resistance Among Obese Children and Adolescents
Mehmet Keskin, MD*; Selim Kurtoglu, MD*; Mustafa Kendirci, MD*; M. Emre Atabek, MD*; and Cevat Yazici, MD‡
ABSTRACT. Objective. Simple fasting methods to
measure insulin resistance, such as the homeostasis model assessment (HOMA), fasting glucose/insulin ratio (FGIR), and quantitative insulin sensitivity check index (QUICKI) methods, have been widely promoted for adult studies but have not been evaluated formally among children and adolescents. The aim of this study was to compare the HOMA, FGIR, and QUICKI methods for measuring insulin resistance, expressed by oral glucose tolerance test (OGTT) results, among obese children and adolescents.
Methods. Fifty-seven pubertal obese children and ad-olescents (30 girls and 27 boys; mean age, 12.04 ⴞ 2.90 years; mean BMI: 29.57ⴞ5.53) participated in the study. All participants underwent an OGTT. Blood samples were obtained 0, 30, 60, 90, and 120 minutes after oral glucose administration for glucose and insulin measure-ments, and 2 separate groups were studied, according to the presence or absence of insulin resistance. HOMA, FGIR, and QUICKI methods were studied for validation of insulin resistance determined with the OGTT for these groups.
Results. The groups consisted of 25 obese children and adolescents with insulin resistance (14 girls and 11 boys; mean age: 12.88 ⴞ2.88 years; mean BMI: 31.29ⴞ 5.86) and 32 subjects without insulin resistance (16 girls and 16 boys; mean age: 11.38 ⴞ 2.79 years; mean BMI: 28.23 ⴞ 4.94). There were significant differences in the mean HOMA (6.06ⴞ4.98 and 3.42 ⴞ3.14, respectively) and QUICKI (0.313 ⴞ 0.004 and 0.339 ⴞ 0.004, retively) values between the 2 groups. Sensitivity and spec-ificity calculations based on insulin resistance with re-ceiver operating characteristic curve analysis indicated that HOMA had high sensitivity and specificity for mea-suring insulin resistance.
Conclusions. As a measure of insulin resistance among children and adolescents, HOMA is more reliable than FGIR and QUICKI. The present HOMA cutoff point for diagnosis of insulin resistance is 3.16. The HOMA cutoff point of >2.5 is valid for adults but not for adolescents. Pediatrics 2005;115:e500–e503. URL: www. pediatrics.org/cgi/doi/10.1542/peds.2004-1921; insulin re-sistance, children, adolescents.
ABBREVIATIONS. HOMA, homeostasis model assessment; OGTT, oral glucose tolerance test; FGIR, fasting glucose/insulin ratio; QUICKI, quantitative insulin sensitivity check index; ROC, receiver operating characteristic.
I
nsulin resistance is the greatest risk factor for the development of type 2 diabetes and is perhaps the greatest current health threat to our children. The prevalence of childhood obesity has more than doubled in the past 15 years in many regions of the world.1–5The marked increase in pediatric obesity in the past decade has resulted in unprecedented in-creases in the incidence of type 2 diabetes mellitus among children and adolescents. In these grossly obese children, both insulin resistance and impaired insulin secretion contribute to the increase in glucose levels, and the degree of obesity is related to cardio-vascular risk factors independent of insulin resis-tance.2–4The standard technique for assessment of insulin sensitivity is the hyperinsulinemic euglycemic clamp; it is often combined with the hyperglycemic clamp to determine the adequacy of compensatory -cell hy-persensitivity.6–9 Although clamp technology has been applied to the study of insulin sensitivity and insulin secretion during childhood, it is too invasive for general epidemiologic studies. Because no intra-venous access is needed, the oral glucose tolerance test (OGTT) is better suited for assessment of large populations. Although OGTTs are more difficult to perform than simple measurements of fasting glu-cose and insulin levels, the OGTT is a minimal-risk procedure that is applicable for large-scale screening and for repeat studies for individual subjects.10
In the quest for a noninvasive measurement tech-nique for insulin sensitivity, several fasting or “ho-meostatic” models have been proposed, and each has correlated reasonably well with clamp tech-niques.11–13 The homeostatic model assessment (HOMA), fasting glucose/insulin ratio (FGIR), and quantitative insulin sensitivity check index (QUICKI) methods have been the most frequently used tech-niques in clinical investigations. The fact that these tests require only a single venipuncture in the fasting state and do not call for concomitant intravenous access makes them particularly attractive to patients and clinicians alike.
The HOMA approach has been widely used in clinical research to assess insulin sensitivity.9,14
From the *Departments of Pediatrics and ‡Biochemistry, School of Medi-cine, Erciyes University, Kayseri, Turkey.
Accepted for publication Nov 8, 2004. doi:10.1542/peds.2004-1921 No conflict of interest declared.
Address correspondence to Mehmet Keskin, MD, Department of Pediatrics, School of Medicine, Erciyes University, 38039, Kayseri, Turkey.
Rather than using fasting insulin levels or FGIR, the product of the fasting concentrations of glucose pressed as milligrams per deciliter) and insulin (ex-pressed as milliunits per milliliter) is divided by a constant. The constant 405 should be replaced by 22.5 if the glucose concentration is expressed in Syste`me International units. Unlike insulin levels and the FGIR, the HOMA calculation compensates for fast-ing hyperglycemia.13The HOMA and insulin values increase for insulin-resistant patients, whereas the FGIR decreases.
The QUICKI method can be applied to normogly-cemic and hyperglynormogly-cemic patients. The index is de-rived by calculating the inverse of the sum of loga-rithmically expressed fasting glucose and insulin concentrations.13As insulin concentrations decrease, QUICKI values increase.
METHODS Research Design and Methods
Fifty-seven pubertal obese children and adolescents (30 girls and 27 boys; mean age: 12.04 ⫾2.90 years; mean BMI: 29.57⫾ 5.53) participated in the study. All children and adolescents were recruited from the Department of Pediatric Endocrinology of Er-ciyes University Faculty of Medicine. BMI was calculated as weight (in kilograms) divided by height (in meters) squared. All subjects had a BMI above the 95th percentile for age and gender and thus were classified as obese. On the basis of the year 2000 growth charts, this BMI category is referred to as overweight by the Centers for Disease Control and Prevention. Detailed medical and family histories were obtained for all subjects, and physical examinations were performed. All subjects were healthy and had normal thyroid function. Parents provided informed consent and children and adolescents provided informed assent before testing commenced.
We divided the subjects into groups with insulin resistance and without insulin resistance by using a cutoff point of the sum of insulin levels during the OGTT of 300U/mL.15,16After a 3-day,
high-carbohydrate diet (300 g/day) and an overnight fast, a stan-dard OGTT (1.75 g/kg or a maximum of 75 g of glucose) was performed for all subjects. Blood samples were obtained 0, 30, 60, 90, and 120 minutes after glucose administration, for glucose and insulin measurements. Plasma glucose levels were measured with the glucose oxidase method and a modified Trinder color reaction, catalyzed by the peroxidase enzyme, and insulin levels were measured with an immunoradiometric assay kit.
Indexes Derived From Fasting Blood Samples
The HOMA index, QUICKI, and FGIR were derived as esti-mates of insulin resistance. The HOMA index was calculated as fasting insulin concentration (U/mL)⫻fasting glucose concen-tration (mmol/L)/22.5, assuming that normal young subjects have an insulin resistance of 1. The QUICKI was calculated as 1/[log fasting insulin concentration (U/mL)⫹log glucose concentra-tion (mg/dL)].
Statistical Analyses
Analyses were performed with SPSS version 10 software for Windows (SPSS, Chicago, IL). Data are reported as means⫾SD and ranges. We compared groups by using independent-samplet
tests.P⬍.05 was considered significant for all data analyses. The optimal HOMA value for diagnosis of insulin resistance was established with a receiver operating characteristic (ROC) scatter plot. An alternative way to establish an optimal cutoff value for a test is to determine the optimal decision point from an ROC curve, whereby equal weight is given to the sensitivity and the specificity of the test. To calculate the sensitivity and specificity of diagnostic tests, we used this cutoff point. The sensitivity and specificity of insulin resistance indexes were estimated as true-positive results/ (true-positive results⫹false-negative results) and true-negative results/(true-negative results ⫹ false-positive results), respec-tively. In a ROC curve, the true-positive rate (sensitivity) is plotted as a function of the false-positive rate (1⫺specificity) for different cutoff points. Each point on the ROC plot represents a sensitivity/ specificity pair corresponding to a particular decision threshold. A test with perfect discrimination has a ROC plot that passes through the upper left corner (100% sensitivity and 100% speci-ficity). Therefore, the closer the ROC plot is to the upper left corner, the greater is the overall accuracy of the test.17,18
RESULTS
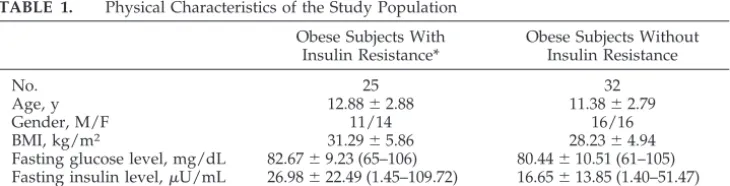
The groups consisted of 25 obese children and adolescents with insulin resistance (14 girls and 11 boys; mean age: 12.88⫾2.88 years; mean BMI: 31.29
⫾5.86) and 32 subjects without insulin resistance (16 girls and 16 boys; mean age: 11.38⫾2.79 years; mean BMI: 28.23 ⫾ 4.94) (Table 1). The mean fasting glu-cose level was 82.67 ⫾ 9.23 mg/dL (range: 65-106 mg/dL), the mean fasting insulin level was 26.98 ⫾ 22.49 U/mL (range: 1.45-109.72 U/mL), and the mean sum of insulin levels was 447.32 ⫾ 145.22 U/mL (range: 300.24-744.39U/mL) for the group with insulin resistance; the mean fasting glucose level was 80.44 ⫾ 10.51 mg/dL (range: 61-105 mg/ dL), the mean fasting insulin level was 16.65⫾13.85 U/mL (range: 1.40-51.47 U/mL), and the mean sum of insulin levels was 154.08 ⫾ 77.78 U/mL (range: 24.86-275.00 U/mL) for the group without insulin resistance (Table 1). There were significant differences in the mean HOMA (6.06⫾4.98 and 3.42
⫾3.14,P⬍.05) and QUICKI (0.313⫾0.004 and 0.339
⫾ 0.004,P⬍ .05), but not FGIR, values between the 2 groups (Table 2).
Sensitivity and specificity calculations were based on insulin resistance with ROC analysis. Each point on the ROC plot represents a sensitivity/specificity pair corresponding to a particular decision thresh-old. A test with perfect discrimination has a ROC plot that passes through the upper left corner (100% sensitivity and 100% specificity). The ROC plot for
TABLE 1. Physical Characteristics of the Study Population Obese Subjects With
Insulin Resistance*
Obese Subjects Without Insulin Resistance
No. 25 32
Age, y 12.88⫾2.88 11.38⫾2.79
Gender, M/F 11/14 16/16
BMI, kg/m2 31.29⫾5.86 28.23⫾4.94
Fasting glucose level, mg/dL 82.67⫾9.23 (65–106) 80.44⫾10.51 (61–105) Fasting insulin level,U/mL 26.98⫾22.49 (1.45–109.72) 16.65⫾13.85 (1.40–51.47) Sum of insulin levels,U/mL 447.32⫾145.22 (300.24–744.39) 154.08⫾77.78 (24.86–275.00) Data are expressed as mean⫾SD (range).
* During OGTT, sum of insulin levels of⬎300U/mL.
www.pediatrics.org/cgi/doi/10.1542/peds.2004-1921 at Viet Nam:AAP Sponsored on August 29, 2020 e501
HOMA is closer to the upper left corner, indicating greater overall accuracy of the test (Fig 1). The opti-mal HOMA value for diagnosis of insulin resistance was established on a ROC scatter plot by determin-ing the optimal decision point from the ROC curve, whereby equal weight is given to the sensitivity and the specificity of the test. The sum of the sensitivity and specificity values is highest at this point. To calculate the sensitivity and specificity of diagnostic tests, we used this cutoff point. HOMA had high sensitivity and specificity for measuring insulin re-sistance. The present HOMA cutoff point for diag-nosis of insulin resistance of 3.16 yielded a sensitivity of 76% and a specificity of 66%.
DISCUSSION
This study demonstrates that HOMA has high sen-sitivity and specificity for measuring insulin resis-tance. Previous studies evaluated simple indexes for assessing insulin sensitivity in a wide range of con-ditions associated with insulin resistance. This study was a unique presentation. HOMA, FGIR, and QUICKI for measuring insulin resistance expressed by OGTT results among obese children and adoles-cents were compared by using sensitivity and spec-ificity calculations based on insulin resistance with ROC analysis. ROC curves can be used to compare the diagnostic performance of ⱖ2 laboratory or di-agnostic tests.19
The FGIR was found to be a highly sensitive and specific measure of insulin sensitivity.11,20The mean FGIR value was⬍7 for the study group with insulin resistance, as we expected, but the difference be-tween the 2 groups was not statistically significant and the SD was large. One of the explanations for interpreting the FGIR might be higher basal insulin levels among obese pubertal children and
adoles-cents, and another might be emotional stress at the time of the blood test.11Therefore, we designed sta-tistical analyses with ROC plots to compare the di agnostic performance of diagnostic tests, and we found that HOMA had high sensitivity and specific-ity for measuring insulin resistance. We suggested that misclassification as insulin resistance with the HOMA was less.
The present study also demonstrated that the HOMA cutoff point for diagnosis of insulin resis-tance was 3.16. Insulin resisresis-tance was defined by Reinehr et al21 as a HOMA value of ⬎4 for adoles-cents. This point was determined to be 2.5 for adults.22
Insulin resistance is a state in which normal con-centrations of insulin produce a subnormal biologic response. There has been considerable interest in the childhood development of insulin resistance, hyper-lipidemia, ovarian hyperandrogenism, and early markers of adult diseases such as type 2 diabetes mellitus, hypertension, and cardiovascular disease. Patients with insulin resistance have hyperinsulin-emia together with normoglychyperinsulin-emia or hyperglyce-mia. Insulin resistance is commonly associated with obesity. The central role of insulin in the clustering of some cardiovascular risk factors was first suggested by reports of endogenous hyperinsulinemia and in-sulin resistance in essential hypertension. Inin-sulin is the central regulator of glucose and lipid homeosta-sis. Insulin decreased blood glucose concentrations by reducing hepatic gluconeogenesis and glycogen-olysis and by enhancing glucose uptake into striated muscles and adipocytes. Insulin also enhances tri-glyceride (triacylglycerol) synthesis in liver and adi-pose tissues, increases the breakdown of circulating lipoproteins by stimulating lipoprotein lipase
activ-Fig 1. ROC curves for indexes of insulin resis-tance.
TABLE 2. Indexes of Insulin Resistance Obese Subjects With
Insulin Resistance
Obese Subjects Without Insulin Resistance
No. 25 32
FGIR 6.64⫾11.76 (0.72–59.59) 8.66⫾8.47 (1.67–47.14) HOMA 6.06⫾4.98 (0.30–21.33)* 3.42⫾3.14 (0.23–12.70)* QUICKI 0.313⫾0.004 (0.254–0.475)* 0.339⫾0.004 (0.270–0.509)* Data are expressed as mean⫾SD (range).
ity in adipose tissues, and suppresses lipolysis both in adipose tissues and in muscles.23,24
CONCLUSIONS
Obesity and type 2 diabetes are globally increasing health problems for young people, with significant individual and public health ramifications with re-spect to associated morbidity and mortality rates.1–4 A simpler tool such as HOMA is more appropriate for large epidemiologic studies and is more reliable than FGIR and QUICKI as a measure of insulin re-sistance among children and adolescents. The use of HOMA is simpler, cheaper, less labor-intensive, less time-consuming, and more acceptable to young peo-ple than clamp studies. This study also demonstrates that the HOMA cutoff point for diagnosis of insulin resistance is 3.16 for adolescents. The HOMA cutoff point of ⬎2.5 is valid for adults but not for adoles-cents. Additional studies are needed to assess the HOMA cutoff point for adolescents.
REFERENCES
1. Rosenbloom AL, Joe JR, Young RS, Winter WE. Emerging epidemic of type 2 diabetes in youth.Diabetes Care.1999;22:345–354
2. Ebbeling CB, Pawlak DB, Ludwig DS. Childhood obesity: public health crisis, common sense cure.Lancet.2002;360:473– 482
3. Silink M. Childhood diabetes: a global perspective. Horm Res.2002; 57(suppl 1):S1–S5
4. Silverstein JH, Rosenbloom AL. Type 2 diabetes in children.Curr Diab Rep.2001;1:19 –27
5. Invitti C, Guzzaloni G, Gilardini L, Morabito F, Viberti G. Prevalence and concomitants of glucose intolerance in European obese children and adolescents.Diabetes Care.2003;26:118 –124
6. Conwell LS, Trost SG, Brown WJ, Batch JA. Indexes of insulin resistance and secretion in obese children and adolescents.Diabetes Care.2004;27: 314 –319
7. Gungor N, Saad R, Janosky J, Arslanian S. Validation of surrogate estimates of insulin sensitivity and insulin secretion in children and adolescents.J Pediatr.2004;144:47–55
8. Haymond MW. Measuring insulin resistance: a task worth doing. But how? [editorial].Pediatr Diabetes.2003;4:115–118
9. Cutfield WS, Jefferies CA, Jackson WE, Robinson EM, Hofman PL. Evaluation of HOMA and QUICKI as measures of insulin sensitivity in prepubertal children.Pediatr Diabetes.2003;4:119 –125
10. Yeckel CW, Weiss R, Dziura J, et al. Validation of insulin sensitivity indices from oral glucose tolerance test parameters in obese children and adolescents.J Clin Endocrinol Metab.2004;89:1096 –1101
11. Silfen ME, Manibo AM, McMahon DJ, Levine LS, Murphy AR, Ober-field SE. Comparison of simple measures of insulin sensitivity in young girl with premature adrenarche: the fasting glucose to insulin ratio may be a simple and useful measure. J Clin Endocrinol Metab. 2001;86: 2863–2868
12. Laakso M. How good a marker is insulin level for insulin resistance?
Am J Epidemiol.1993;137:959 –965
13. Quon MJ. Limitations of the fasting glucose to insulin ratio as an index of insulin sensitivity.J Clin Endocrinol Metab.2001;85:4615– 4617 14. Wallace TM, Matthews DR. The assessment of insulin resistance in man.
Diabetic Med.2002;19:527–534
15. Maruhama Y, Abe R. A familial form of obesity without hyperinsulin-ism at the outset.Diabetes.1981;30:14 –18
16. Zannolli R, Rebeggiani A, Chiarelli F, Morgese G. Hyperinsulinism as a marker in obese children.Am J Dis Child.1993;147:837– 841
17. Metz CE. Basic principles of ROC analysis.Semin Nucl Med.1978;8: 283–298
18. Zweig MH, Campbell G. Receiver-operating characteristic (ROC) plots: a fundamental evaluation tool in clinical medicine.Clin Chem.1993;39: 561–577
19. Griner PF, Mayewski RJ, Mushlin Al, Greenland P. Selection and inter-pretation of diagnostic tests and procedures.Ann Intern Med.1981;94: 555– 600
20. Vuguin P, Saenger P, Dimartino-Nardi J. Fasting glucose insulin ratio: a useful measure of insulin resistance in girls with premature adrenarche.
J Clin Endocrinol Metab.2001;86:4618 – 4621
21. Reinehr T, Andler W. Changes in the atherogenic risk factor profile according to degree of weight loss.Arch Dis Child.2004;89:419 – 422 22. Matthews DR, Hosker JP, Rudenski AS, Naylor BA, Treacher DF,
Turner RC. Homeostasis model assessment: insulin resistance and-cell function from fasting plasma glucose and insulin concentrations in man.Diabetologia.1985;28:412– 419
23. Decsi T, Molnar D: Insulin resistance syndrome in children [editorial].
Pediatr Drugs.2003;5:291–299
24. Galli-Tsinopoulou A, Karamouzis M, Arvanitakis SN. Insulin resistance and hyperinsulinemia in prepubertal obese children.J Pediatr Endocrinol Metab.2003;16:555–560
www.pediatrics.org/cgi/doi/10.1542/peds.2004-1921 at Viet Nam:AAP Sponsored on August 29, 2020 e503
DOI: 10.1542/peds.2004-1921 originally published online March 1, 2005;
2005;115;e500
Pediatrics
Yazici
Mehmet Keskin, Selim Kurtoglu, Mustafa Kendirci, M. Emre Atabek and Cevat
Assessing Insulin Resistance Among Obese Children and Adolescents
Glucose/Insulin Ratio and Quantitative Insulin Sensitivity Check Index for
Homeostasis Model Assessment Is More Reliable Than the Fasting
Services
Updated Information &
http://pediatrics.aappublications.org/content/115/4/e500
including high resolution figures, can be found at:
References
http://pediatrics.aappublications.org/content/115/4/e500#BIBL
This article cites 24 articles, 6 of which you can access for free at:
Subspecialty Collections
http://www.aappublications.org/cgi/collection/obesity_new_sub
Obesity
http://www.aappublications.org/cgi/collection/diabetes_mellitus_sub
Diabetes Mellitus
http://www.aappublications.org/cgi/collection/endocrinology_sub
Endocrinology
following collection(s):
This article, along with others on similar topics, appears in the
Permissions & Licensing
http://www.aappublications.org/site/misc/Permissions.xhtml
in its entirety can be found online at:
Information about reproducing this article in parts (figures, tables) or
Reprints
http://www.aappublications.org/site/misc/reprints.xhtml
DOI: 10.1542/peds.2004-1921 originally published online March 1, 2005;
2005;115;e500
Pediatrics
Yazici
Mehmet Keskin, Selim Kurtoglu, Mustafa Kendirci, M. Emre Atabek and Cevat
Assessing Insulin Resistance Among Obese Children and Adolescents
Glucose/Insulin Ratio and Quantitative Insulin Sensitivity Check Index for
Homeostasis Model Assessment Is More Reliable Than the Fasting
http://pediatrics.aappublications.org/content/115/4/e500
located on the World Wide Web at:
The online version of this article, along with updated information and services, is
by the American Academy of Pediatrics. All rights reserved. Print ISSN: 1073-0397.
the American Academy of Pediatrics, 345 Park Avenue, Itasca, Illinois, 60143. Copyright © 2005 has been published continuously since 1948. Pediatrics is owned, published, and trademarked by Pediatrics is the official journal of the American Academy of Pediatrics. A monthly publication, it
at Viet Nam:AAP Sponsored on August 29, 2020 www.aappublications.org/news