www.nat-hazards-earth-syst-sci.net/17/685/2017/ doi:10.5194/nhess-17-685-2017
© Author(s) 2017. CC Attribution 3.0 License.
Stand-alone tsunami alarm equipment
Akio Katsumata1, Yutaka Hayashi1, Kazuki Miyaoka1, Hiroaki Tsushima1, Toshitaka Baba2, Patricio A. Catalán3,4,5, Cecilia Zelaya6, Felipe Riquelme Vasquez7, Rodrigo Sanchez-Olavarria8, and Sergio Barrientos8
1Meteorological Research Institute, Japan Meteorological Agency, Nagamine 1-1, Tsukuba, Ibaraki Prefecture, Japan 2Tokushima University, Shinkura-cho 2-24, Tokushima, Tokushima Prefecture, Japan
3Departamento de Obras Civiles, Universidad Técnica Federico Santa María, Avenida España 1680, Valparaíso,
Región de Valparaíso, Chile
4Centro Nacional de Investigación para la Gestión Integrada de Desastres Naturales, CONICYT/FONDAP/1511007,
Avenida Vicuña Mackenna 4860, Santiago, Región Metropolitana, Chile
5Centro Científico Tecnológico de Valparaíso-CCTVal, Universidad Técnica Federico Santa María, Avenida España 1680,
Valparaíso, Región de Valparaíso, Chile
6Hydrographic and Oceanographic Service, Chilean Navy, Errázuriz Echaurren 254, Playa Ancha, Región Valparaíso, Chile 7National Office of Emergency of the Interior Ministry, Calle Beaucheff 1671, Santiago, Región Metropolitana, Chile 8University of Chile, Av Libertador Bernardo O’Higgins 1058, Santiago, Región Metropolitana, Chile
Correspondence to:Akio Katsumata (akatsuma@mri-jma.go.jp) Received: 12 May 2016 – Discussion started: 21 June 2016
Revised: 7 April 2017 – Accepted: 11 April 2017 – Published: 15 May 2017
Abstract.One of the quickest means of tsunami evacuation is transfer to higher ground soon after strong and long ground shaking. Ground shaking itself is a good initiator of the evac-uation from disastrous tsunami. Longer period seismic waves are considered to be more correlated with the earthquake magnitude. We investigated the possible application of this to tsunami hazard alarm using single-site ground motion ob-servation. Information from the mass media is sometimes un-available due to power failure soon after a large earthquake. Even when an official alarm is available, multiple informa-tion sources of tsunami alert would help people become aware of the coming risk of a tsunami. Thus, a device that in-dicates risk of a tsunami without requiring other data would be helpful to those who should evacuate. Since the sensitiv-ity of a low-cost MEMS (microelectromechanical systems) accelerometer is sufficient for this purpose, tsunami alarm equipment for home use may be easily realized. Amplitude of long-period (20 s cutoff) displacement was proposed as the threshold for the alarm based on empirical relationships among magnitude, tsunami height, hypocentral distance, and peak ground displacement of seismic waves. Application of this method to recent major earthquakes indicated that such
equipment could effectively alert people to the possibility of tsunami.
1 Introduction
Early-stage tsunami warnings are usually issued by govern-mental organizations, based on the estimated hypocenter and magnitude. Magnitude, a crucial factor for tsunami forecast-ing, is estimated based on amplitude of the seismic wave (Katsumata et al., 2013), rapid estimation of seismic mo-ment (Tsuboi et al., 1995), or high-frequency energy radi-ation (Hara, 2007).
warning. We feel that multiple independent warnings are much more compelling, provided the additional warnings are reasonably reliable. A stand-alone warning system would be valuable if the official warning were unavailable because of some mishap.
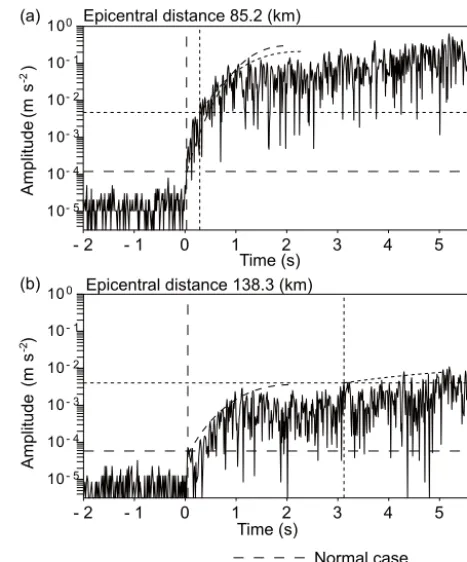
Low-cost MEMS (microelectromechanical systems) ac-celerometers could equip an ordinary house with such a single-station tsunami alarm. Some single-site processing methods have been proposed for earthquake early warning. Odaka et al. (2003) developed a method to estimate epicen-tral distance using single-site seismic data. Magnitude can be estimated based on epicentral distance and amplitude at the station. Allen and Kanamori (2003) used the P-wave predominant period to estimate earthquake magnitude. With tsunamis, it is not necessary to focus on theP-wave part of the seismic wave, because it is better to wait for comple-tion of the fault rupture to estimate earthquake magnitude. Moreover, the high noise level of an MEMS sensor may re-sult in considerable difference in the estimated value based on P-wave onset. Figure 1 presents examples of epicentral distance estimation from the onset of the P wave using the method of Odaka et al. (2003), in which sharpness of the on-set is used for epicentral-distance estimation. For example, with the 2003 Tokachi-oki earthquake (Fig. 1a), the differ-ence in sharpness of onset estimated with assumption of dif-ferent noise levels corresponds to 1.6 times the difference in distance. For the 2011 earthquake off the Pacific coast of Tohoku, known as the 2011 Great East Japan Earthquake (Fig. 1b), the difference in onset corresponds to 5 times the difference in distance. It is possible to use the whole seis-mic wave trace for tsunami evacuation purposes. Amplitude is directly related to earthquake magnitude. Strong-motion duration, which is related to earthquake magnitude (Trifunac and Brady, 1975; Dobry et al., 1978; Izutani and Hirasawa, 1987), is a candidate for single-site magnitude estimation. Although duration is a possible candidate, amplitude is used in this study. Decay of amplitude along the distance can be used to limit the area to alert.
Table 1 lists earthquakes that involved 10 or more casual-ties due to tsunamis around the Japanese islands in the past 100 years. This table indicates that earthquakes with a mag-nitude of 8 (M8) or greater caused serious disasters. Here we seek to differentiate earthquakes greater thanM8 from oth-ers. We discuss single-station seismic wave processing, fo-cusing on possible application to stand-alone tsunami alarm equipment.
2 Method
We aim to distinguish events with tsunami potential from seismic data obtained at a single station. Abe (1981) pre-sented an empirical relationship among magnitude, distance, and tsunami height as
Mt=log10H+alog10R+D, (1)
10- 5
10- 4
10- 3
10- 2
10- 1
100
(
m
s
)
- 2 - 1 0 1 2 3 4 5 6 Epicentral distance 138.3 (km)
Time (s) A m pl itu de
10- 5
10- 4
10- 3
10- 2
10- 1
100
(m
s
)
- 2 - 1 0 1 2 3 4 5 6 Epicentral distance 85.2 (km)
A m pl itu de Time (s) (a) (b) Normal case High noise-level case
-2
-2
Figure 1. Examples of epicentral distance estimation using the
method of Odaka et al. (2003).(a)Record of the 2003 Tokachi-oki earthquake on 26 September 2003;(b)record of the 2011 Great East Japan Earthquake on 11 March 2011. Two levels of noise were as-sumed. Long-dash lines: the curve ofBtexp(−At )(refer to Odaka et al., 2003) was fitted to the part where amplitude exceeded dou-ble the noise level. Short-dash lines: the curve was fitted to the part where the amplitude exceeded 0.004 m s−2, which was assumed to be twice the noise level of an MEMS sensor.
whereMt is tsunami magnitude,H is the maximum
ampli-tude of a tsunami wave in meters measured by a tide gauge, Ris the distance in kilometers from the epicenter to the tide station along the shortest oceanic path, andaandDare con-stants (a=1.0, D=5.80). This relationship was obtained with an assumption ofMt=Mw.Mw denotes the moment
magnitude. When Mt and H are assumed, R is
approxi-mately specified.
Katsumata et al. (2013) proposed a magnitudeM estima-tion method with the maximum vertical displacement ampli-tudeAof a seismic wave obtained at local distance as M=aKlog10A+bKlog10Rh+cK, (2)
whereaK,bK, andcK are constants, andRhis the
hypocen-tral distance (km). aK,bK, and cK were adjusted with an
assumption ofM=Mw. Katsumata et al. (2013) presented
aK,bK, andcK in Eq. (2) for various cutoff periods. If Mt
andRof Eq. (1) are substituted forMandRhof Eq. (2), it
Table 1.Major disastrous earthquakes and casualties due to their tsunami around the Japanese islands in the past 100 years.
Origin time (JST) Epicenter Casualties including M the missing
1 Sep 1923 at 11:58 139.14◦E, 35.33◦N 325(105 385)1 7.9 3 Mar 1933 at 02:30 145.12◦E, 39.13◦N 30642 8.1 2 Aug 1940 at 00:08 139.81◦E, 42.36◦N 102 7.5 7 Dec 1944 at 13:35 136.18◦E, 33.57◦N (1251)2 7.9 21 Dec 1946 at 04:19 135.85◦E, 32.94◦N (1443)2 8.0 4 Mar 1952 at 10:23 144.15◦E, 41.71◦N (33)2 8.2 26 May 1983 at 11:59 139.07◦E, 40.36◦N 100(104)2 7.7 12 Jul 1993 at 22:17 139.18◦E, 42.78◦N (230)2 7.8 11 Mar 2011 at 14:46 142.85◦E, 38.10◦N 18 4653 9.0
Numbers in parentheses indicate total casualties including those due to causes other than tsunami.
1Moroi and Takemura (2004).2Usami (2003).3National Police Agency (2015). The unified seismic
catalog of Japan (Japan Meteorological Agency, 2015a) provided the epicenter and magnitude.
2 m, R andA become 79 km and 0.11 m for the case of a 20 s cutoff. The tsunami height of 2 m is assumed because that could cause serious damage. The magnitude of a 20 s cutoff, as in Katsumata et al. (2013), often agreed well with that of a 100 s cutoff. We can therefore choose 0.11 m as the threshold. If the observed amplitude is larger than this value and magnitude is 8.0, the event would be close enough to cause tsunami damage at the observation point. If the ob-served amplitude is larger than this value and the epicentral distance is 79 km, the magnitude should be greater than 8.0. Equation (1) by Abe (1981) is valid in an epicentral distance range of no less than 100 km. Since the distance of about 80 km is out of range, this derivation gives a very rough esti-mate. WhenMtandHare assumed at 8.5 and at 2 m,Rand
Abecome 250 km and 0.07 m for the case of a 20 s cutoff. Taking into account the possibility of a larger earthquake, it is better to lower the threshold. Equation (2) has a standard deviation of 0.17 (σK) as magnitude value. Therefore, we set
the threshold at 0.11/10σK/aK =0.081 m.
For a 50 s cutoff, the value ofAbecomes 0.12 m forH= 2 m from Eq. (2). A longer period is considered to be better to cope with larger events of longer source duration. How-ever, there are instrumental limitations in any observational system. For the case of an MEMS sensor, the instrumental noise is considerably higher than that of a feedback-type ac-celerometer. The noise level of an MEMS accelerometer is assumed to be 0.002 m s−2 in this study, which is slightly
lower than the tremor level noticeable by humans. Sensors for this level are easily available. The 0.002 m s−2of a 20 s period corresponds to 0.02 m in displacement. For the case of a 50 s period, it corresponds to 0.13 m, which is almost the same as the threshold amplitude level. Since margin is re-quired for any kinds of observations, the case of a 50 s cutoff is not appropriate under this condition.
Figure 2.Station and epicenter map. Stations of seismic intensity
meters (open circles) and epicenters of the events (solid circles) for which seismic records were used in this study are denoted.
3 Results and discussion
3.1 Application to archived seismic records in Japan This method was applied to the data obtained with seismic in-tensity meters installed by the Japan Meteorological Agency (2015b). Station locations are indicated in Fig. 2 with the epi-centers of the events for which seismic data used in this study were obtained. The result is shown in Fig. 3. The global CMT solutions (Dziewonski et al., 1981; Ekström et al., 2012) were referenced for moment magnitudeMw. The red dot in
Figure 3. Data distribution of the maximum vertical displace-ment amplitude. Amplitude data which exceed the threshold value (0.081 m) are presented by red dots. The red line indicates the dis-tance at which tsunami height is 2 m based on the Eq. (1) by Abe (1981).
and the black dot less than that. The red curve indicates the distance corresponding toH=2 m based on Eq. (1). There are some data exceeding the threshold amplitude in small earthquakes. When the epicentral distance is short, ampli-tudes of a few data exceeded the threshold for some events even smaller than magnitude 7. This situation corresponds to a false alarm.
Figure 4 presents the relationship between amplitude and epicentral distance for the 2003 Tokachi-oki earthquake (Mw
8.3, thin circles) and the 2011 Great East Japan Earthquake (Mw9.1, thick circles). The dashed line indicates the
thresh-old amplitude. For the 2003 Tokachi-oki earthquake, most of the data at stations up to about 200 km exceeded the thresh-old. At the same time, one datum at about 140 km from the epicenter did not exceed the threshold. For the 2011 Great East Japan Earthquake, most of the data exceeded the thresh-old up to about 400 km. Source areas and observation points of these events are shown on maps in Sect. 3.2.
The false alarm due to large amplitude by a relatively small event is a problem in this method. Since the threshold of this study is a very rough estimation, false alarms are unavoid-able. We tentatively checked other quantities such as peak ground velocity, duration of strong motion, and various
com-The 2003 Tokachi-oki earthquake
The 2011 Great East Japan Earthquake
Figure 4. Amplitude data distribution of the 2003 Tokachi-oki
earthquake and the 2011 Great East Japan Earthquake. The dashed line indicates the threshold amplitude.
binations of these. No simple measure distinguished large earthquakes better than displacement amplitude.
3.2 Application to recent major events
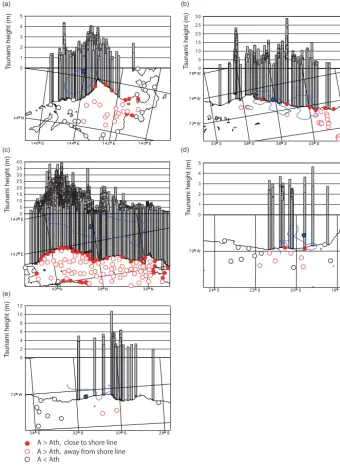
The result is applied to several major earthquakes that oc-curred around Japan and Chile. The same data used in the previous section are referenced in the trials here for events around Japan. Data archived by the University of Chile (2015) are used for events around Chile. Figure 5 represents the results with the observed tsunami heights. These are al-most all the events which occurred in the areas covered with strong motion networks and caused high tsunamis. The red dots denote stations located within 10 km of the shoreline with observational values above the threshold (0.081 m). The red open circle denotes a station that had an amplitude over the threshold but distant from the shoreline.
Figure 5.Map plot of the observational values for major earthquakes:(a)the 2003 Tokachi-oki earthquake (Mw8.3),(b)the 2010 Maule Earthquake (Mw8.8),(c)the 2011 Great East Japan Earthquake (Mw9.1),(d)the 2014 Iquique earthquake (Mw8.1), and(e)the 2015 Illapel earthquake (Mw8.3). Color is classified according to observed amplitude (A) compared with threshold value (Ath). The observed tsunami run-up heights are also indicated.
In Fig. 5, the observational values of many stations were generally above the threshold in areas of high tsunami. However, such stations did not cover all areas where high tsunamis were observed, and at some stations the ob-servational values were less than the threshold but high tsunamis were observed. For the 2003 Tokachi-oki earth-quake (Fig. 5a), the observational values were above the threshold in the areas of high-tsunami observation. However, there were some data lower than the threshold and close to
Figure 6.Seismic waves and instrumental seismic intensity obtained using prototype tsunami alarm equipment. Original acceleration records, velocity records for instrumental seismic intensity, instrumental seismic intensity, and displacement records are shown.
However, some data close to the source area were lower than the threshold. For the 2015 Illapel earthquake, the observa-tional values were above the threshold in the area close to the highest tsunami.
These examples illustrate that the single-station method is effective in indicating a high-risk area of a large tsunami in many areas and that it cannot cover the whole area of high tsunami. Even though this method does not cover a possi-ble disastrous area completely, an alert based on this method may induce caution regarding the possibility of a tsunami af-ter a large earthquake. Moreover, although threshold values were estimated with data obtained in Japan, these examples indicate that this method is applicable to earthquakes around Chile, which is located in a similar tectonic setting as Japan. We built prototype tsunami alarm equipment using an MEMS sensor and a small computer and tentatively observed
3.3 Slow events and limitation of the method
A 20 s cutoff is considered to be enough for ordinary earth-quakes of M8. However, the spectrum level of the seismic wave of a 22 s period is lower for slow earthquakes than that of ordinary earthquakes (Polet and Kanamori, 2000). Twenty seconds would be too short for typical slow events. The 1896 Meiji–Sanriku earthquake is considered one such slow event (Kanamori, 1972). If a low-noise feedback-type accelerome-ter is used, longer periods such as 50 or 100 s can possibly be used. Usage of integrated displacement such asMwp(Tsuboi
et al., 1995) is an even better way. However, we leave these subjects out of this article because these are beyond the abil-ity of a low-cost MEMS sensor.
False alarms and missed warnings are unavoidable with this method, as shown in Sects. 3.1 and 3.2. There is a trade-off between the false alarms and missed warnings. If a mes-sage promoting confirmation of the official announcement is included in the alarm from the equipment, the problem of a false alert would be amended.
4 Conclusions
We proposed a method to differentiate earthquakes with dis-astrous tsunami potential from others using ground motion at a single site. With this method, displacement amplitude ob-tained with 20 s cutoff filter is used. It is possible to develop small equipment for this purpose using a low-cost MEMS sensor.
Application of this method to recent major earthquakes in-dicated that this method is partially effective in informing people of the possibility of a disastrous tsunami. Our sen-sors would not provide a perfect tsunami alarm system; in-stead, they would complement the official alarms. The prior-ity should be placed on governmental information.
Data availability. The number of casualties of the 2011 Great East Japan Earthauke is available at https://www.npa.go.jp/archive/ keibi/biki/higaijokyo.pdf (National Police Agency, 2015). The data of hypocenters of the unified seismic catalog of Japan are available at http://www.data.jma.go.jp/svd/eqev/data/bulletin/hypo.html (Japan Meteorological Agency, 2015a). Acceleration records obtained by the seismic intensity meters of the Japan Mete-orological Agency are available at http://www.data.jma.go.jp/ svd/eqev/data/kyoshin/jishin/index.html (Japan Meteorological Agency, 2015b). Acceleration records obtained by the University of Chile are available at http://evtdb.csn.uchile.cl (University of Chile, 2015). Slip distributions of the 2010 Maule Earthquake, the 2014 Iquique earthquake, and the 2015 Illapel earthquake are available at http://earthquake.usgs.gov/ (Sladen, 2015), http: //www.tectonics.caltech.edu/slip_history/2014_chile/index.html (Wei, 2016), and http://earthquake.usgs.gov/archive/product/ finitefault/us20003k7a/us/1442454346406/eb/20003k7a.fsp, respectively. Seismic intensity records in Chile are available at
http://www.onemi.cl/informate/sismo-de-mayor-intensidad-en-las-regiones-de-metropolitana (ONEMI, 2016). Tsunami heights of the 2011 Great East Japan earthquake are available at http://www.coastal.jp/ttjt (The 2011 Tohoku Earthquake Tsunami Joint Survey Group, 2015).
Competing interests. The authors declare that they have no conflict of interest.
Acknowledgements. We are grateful to the two anonymous referees and the editor, B. D. Malamud, for their kind and thoughtful comments. This study used strong motion data obtained by the Japan Meteorological Agency and the University of Chile. We referred to hypocenter locations estimated using the seismic data of the National Research Institute for Earth Science and Disaster Prevention, Hokkaido University, Hirosaki University, Tohoku University, the University of Tokyo, Nagoya University, Kyoto University, Kochi University, Kyushu University, Kagoshima University, the National Institute of Advanced Industrial Science and Technology, the Tokyo metropolitan government, the Shizuoka prefectural government, the Kanagawa prefectural government, the city of Yokohama, Japan Agency for Marine-Earth Science and Technology, and the Japan Meteorological Agency. This study was partly supported by the SATREPS research project of “Enhance-ment of technology to develop tsunami-resilient community”.
Edited by: B. D. Malamud
Reviewed by: two anonymous referees
References
Abe, K.: Physical size of tsunamigenic earthquakes of the northwestern Pacific, Phys. Earth Planet. In., 27, 194–205, doi:10.1016/0031-9201(81)90016-9, 1981.
Allen, R. M. and Kanamori, H.: The potential for earthquake early warning in southern California, Science, 300, 786–789, doi:10.1126/science.1080912, 2003.
Aránguiz, R., González, G., González, J., Catalán, P. A., Cienfue-gos, R., Yagi, Y., Okuwaki, R., Urra, L., Contreras, K., Rio, I. D., and Rojas, C.: The 16 September 2015 Chile Tsunami from the post-tsunami survey and numerical modeling perspectives, Pure Appl. Geophys., 173, 333–348, doi:10.1007/s00024-015-1225-4, 2016.
Catalán, P. A., Aránguiz, R., González, G., Tomita, T., Cienfuegos, R., González, J., Shrivastava, M. N., Kumagai, K., Mokrani, C., Cortés, P., and Gubler, A.: The 1 April 2014 Pisagua tsunami: Observations and modeling, Geophys. Res. Lett., 42, 2918–2925, doi:10.1002/2015GL063333, 2015.
Dobry, R., Idriss, I. M., and Ng, E.: Duration characteristics of hori-zontal components of strong-motion earthquake records, B. Seis-mol. Soc. Am., 68, 1487–1520, 1978.
Dziewonski, A. M., Chou T.-A., and Woodhouse, J. H.: Determi-nation of earthquake source parameters from waveform data for studies of global and regional seismicity, J. Geophys. Res., 86, 2825–2852, doi:10.1029/JB086iB04p02825, 1981.
13,017 earthquakes, Phys. Earth Planet. In., 200–201, 1–9, doi:10.1016/j.pepi.2012.04.002, 2012.
Fritz, H. M., Petroff, C. M., Catalán, P. A., Cienfuegos, R., Winck-ler, P., Kalligeris, N., Weiss, R., Barrientos, S. E., Meneses, G., Valderas-Bermejo, C., Ebeling, C., Papadopoulos, A., Contreras, M., Almar, R., Dominguez, J. C., and Synolakis, C. E.: Field sur-vey of the 27 February 2010 Chile tsunami, Pure Appl. Geophys., 168, 1989–2010, doi:10.1007/s00024-011-0283-5, 2011. Hara, T.: Magnitude determination using duration of high
fre-quency energy radiation and displacement amplitude: applica-tion to tsunami earthquakes, Earth Planets Space, 59, 561–565, doi:10.1186/BF03352718, 2007.
Hatori, T.: Size and source area of 2003 Tokachi-oki earthquake, Research Reports of Tsunami Engineering, Disaster Control Re-search Center, Tohoku University, 21, 93–98, 2004 (in Japanese). Izutani, Y. and Hirasawa, T.: Use of strong motion duration for rapid evaluation of fault parameters, J. Phys. Earth, 35, 171–190, doi:10.4294/jpe1952.35.171, 1987.
Japan Meteorological Agency: The unified seismic catalog of Japan, http://www.data.jma.go.jp/svd/eqev/data/bulletin/hypo.html, last access: 12 February 2015a.
Japan Meteorological Agency: Strong motion data, http://www. data.jma.go.jp/svd/eqev/data/kyoshin/jishin/index.html, last ac-cess: 12 February 2015b.
Kanamori, H.: Mechanism of tsunami earthquakes, Phys. Earth Planet. In., 6, 346–359, doi:10.1016/0031-9201(72)90058-1, 1972.
Katsumata, A., Ueno, H., Aoki, S., Yoshida, Y., and Barri-entos, S.: Rapid magnitude determination from peak ampli-tudes at local stations, Earth Planets Space, 65, 843–853, doi:10.5047/eps.2013.03.006, 2013.
Moroi, T. and Takemura, M.: Mortality estimation by causes of death due to the 1923 Kanto Earthquake, Journal of Japan Association for Earthquake Engineering, 4, 21–35, doi:10.5610/jaee.4.4_21, 2004. (in Japanese)
National Police Agency: Damages by the 2011 off the Pacific coast of Tohoku earthquake and measures implemented by the police, https://www.npa.go.jp/archive/keibi/biki/higaijokyo.pdf, last ac-cess: 17 September 2015.
Odaka, T., Ashiya, K., Tsukada, S., Sato, S., Ohtake, K., and Nozaka, D.: A new method of quickly estimating epicentral dis-tance and magnitude from a single seismic record, B. Seismol. Soc. Am., 93, 526–532, doi:10.1785/0120020008, 2003. ONEMI: Earthquake of greater intensity between the regions of
At-acama and La Araucania, http://www.onemi.cl/informate/, last access: 30 March 2016.
Polet, J. and Kanamori, H.: Shallow subduction zone earthquakes and their tsunamigenic potential, Geophys. J. Int. 142, 684–702, doi:10.1046/j.1365-246x.2000.00205.x, 2000.
Sladen A.: Preliminary Result 02/27/2010 (Mw8.8) Chile, Source Models of Large Earthquakes, http://www.tectonics.caltech.edu/ slip_history/2010_chile/index.html, last access: 9 December 2015.
Tanioka, Y., Nishimura, Y., Hirakawa, K., Imamura, F., Abe, I., Abe, Y., Shindou, K., Matsutomi, H., Takahashi, T., Imai, K., Harada, K., Namegawa, Y., Hasegawa, Y., Hayashi, Y., Nanayama, F., Ka-mataki, T., Kawata, Y., Fukasawa, Y., Koshimura, S., Hada, Y., Azumai, Y., Hirata, K., Kamikawa, A., Yoshikawa, A., Shiga, T., Kobayashi, M., and Masaka, S.: Tsunami run-up heights of the 2003 Tokachi-oki earthquake, Earth Planets Space, 56, 359–365, doi:10.1186/BF03353065, 2004.
The 2011 Tohoku Earthquake Tsunami Joint Survey Group: The 2011 off the Pacific coast of Tohoku earthquake tsunami infor-mation, http://www.coastal.jp/ttjt, last access: 6 December 2015. Trifunac, M. D. and Brady, A. G.: A study on the duration of strong earthquake ground motion, B. Seismol. Soc. Am., 65, 581–626, 1975.
Tsuboi, S., Abe, K., Takano, K., and Yamanaka, Y.: Rapid deter-mination ofMwfrom broadband P waveforms, B. Seismol. Soc. Am., 85, 606–613, 1995.
University of Chile: Registration of siginificant events, http://evtdb. csn.uchile.cl, last access: 17 October 2015.
Usami, T.: Materials for comprehensive list of destructive earth-quakes in Japan [416]-2001 [Latest Edition], University of Tokyo Press, Tokyo, 605 pp., 2003 (in Japanese).
USGS: Preliminary finite fault results for the Sep 16, 2015 Mw 8.3 46 km W of Illapel, Chile Earthquake (Ver-sion 1), http://earthquake.usgs.gov/archive/product/finite-fault/ us20003k7a/us/1442454346406/web/20003k7a.fsp, last access: 15 February 2016.
Wald, D. J., Quitoriano, V., Heaton, T. H., and Kanamori, H.: Rela-tionships between peak ground acceleration, peak ground veloc-ity, and modified Mercalli intensity in California, Earthq. Spec-tra, 15, 557–564, doi:10.1193/1.1586058, 1999.
Wei, S.: Apr./01/2014 (Mw 8.1), Iquique, Chile, Source Mod-els of Large Earthquakes, http://www.tectonics.caltech.edu/slip_ history/2014_chile/index.html, last access: 15 February 2016. Yoshida, Y., Ueno, H., Muto, D., and Aoki, S.: Source process of