Parsec-Scale Kinematic and Polarization Properties of MOJAVE AGN Jets
Matthew L. Lister1,afor the MOJAVE collaborationb
1Department of Physics, Purdue University, 525 Northwestern Avenue, West Lafayette, IN 47907, USA
Abstract. We describe the parsec-scale kinematics and statistical polarization properties of 200 AGN jets based on 15 GHz VLBA data obtained between 1994 Aug 31 and 2011 May 1. Nearly all of the 60 most heavily observed jets show significant changes in their innermost position angle over a 12 to 16 year interval, ranging from 10◦ to 150◦ on the sky, corresponding to intrinsic variations of∼ 0.5◦ to∼ 2◦. The BL Lac jets show smaller variations than quasars. Roughly half of the heavily observed jets show systematic position angle trends with time, and 20 show indications of oscillatory behavior. The time spans of the data sets are too short compared to the fitted periods (5 to 12 y), however, to reliably establish periodicity. The rapid changes and large jumps in position angle seen in many cases suggest that the superluminal AGN jet features occupy only a portion of the entire jet cross section, and may be energized portions of thin instability structures within the jet. We have derived vector proper motions for 887 moving features in 200 jets having at least five VLBA epochs. For 557 well-sampled features, there are sufficient data to additionally study possible accelerations. The moving features are generally non-ballistic, with 70% of the well-sampled features showing either significant accelerations or non-radial motions. Inward motions are rare (2% of all features), are slow (<0.1 mas per y), are more prevalent in BL Lac jets, and are typically found within 1 mas of the unresolved core feature. There is a general trend of increasing apparent speed with distance down the jet for both radio galaxies and BL Lac objects. In most jets, the speeds of the features cluster around a characteristic value, yet there is a considerable dispersion in the distribution. Orientation variations within the jet cannot fully account for the dispersion, implying that the features have a range of Lorentz factor and/or pattern speed. Very slow pattern speed features are rare, comprising only 4% of the sample, and are more prevalent in radio galaxy and BL Lac jets. We confirm a previously reported upper envelope to the distribution of speed versus beamed luminosity for moving jet features. Below 1026 W Hz−1 there is a fall-offin maximum speed with decreasing 15 GHz
radio luminosity. A preliminary analysis of the multi-epoch jet polarization properties indicates a wide range of behavior in the core electric vector position angles over time, with the latter remaining relatively stable in some jets, and varying rapidly in others. The fractional polarization level generally increases down the jet, and high-synchrotron peaked (HSP) blazars tend to have lower core fractional polarization levels. A general trend of decreasing maximum jet speed for higher synchrotron peaked blazars further suggests lower Doppler factors in the radio-emitting jets of HSP BL Lac objects.
1 Introduction
High resolution multi-epoch radio observations of jetted outflows associated with active galactic nuclei (AGN) have contributed substantially to our understanding of the im-mediate environments of supermassive black holes, by providing direct measurements of jet flow kinematics and magnetic field properties. The VLBA 2cm Survey [1] sampled the jet kinematics of 110 AGN, and was suc-ceeded in 2002 by the MOJAVE program, which added full polarization imaging and defined a complete northern-sky radio flux density-limited sample [2]. Kinematic re-sults for 127 MOJAVE jets based on data spanning 1994– 2007 were presented by [3] and [4]. They showed that bright jet features typically exhibit apparent superluminal speeds and accelerated motions. These findings are
consis-ae-mail: mlister@purdue.edu
bwww.physics.purdue.edu/MOJAVE/team.html
tent with the widely accepted picture of high bulk Lorentz factor jets viewed at angles very close to the line of sight.
The MOJAVE program has confirmed an important trend, first reported by [5] in the Caltech-Jodrell AGN sur-vey, in which jets with the fastest superluminal speeds all tend to have high Doppler boosted radio luminosities. To first order, such a trend might be expected from orientation and Doppler boosting effects, but an analysis by [6] and Monte Carlo simulations presented in [3] indicated that there is a correlation between intrinsic jet speed and in-trinsic (de-beamed) luminosity present in the population. In the absence of such a correlation, we would expect to see highly superluminal jets at much lower boosted radio luminosities.
In order to further investigate these issues, we ex-panded the MOJAVE program in 2006 to include regular VLBA imaging of additional low-luminosity AGN jets. In
DOI: 10.1051/
C
Owned by the authors, published by EDP Sciences, 2013 /20136106002
epjconf
2009, we expanded the sample again to encompass new γ-ray loud blazar jets detected by Fermi [7].
We have recently published new VLBA 15 GHz im-ages of the original 135 source MOJAVE flux-density lim-ited sample obtained between 2007 and 2011, as well as VLBA images of of 124 additional AGN from three new AGN jet samples [8] . Here we present a kinematic analy-sis of these and prior data dating back to 1994, as well as preliminary results from our ongoing analysis of the multi-epoch VLBA polarization images. The full set of images and data tables can be found in [8]. We adopt a cosmology withΩm =0.27,ΩΛ =0.73 and Ho =71 km s−1 Mpc−1 throughout.
2 MOJAVE AGN Samples
The data presented here come from three MOJAVE AGN samples in the sky regionδ >−30◦with selection criteria
as follows:
Radio-selected MOJAVE 1.5 Jy sample: This in-cludes all known AGN with 15 GHz VLBA flux density exceeding 1.5 Jy at any epoch during the period 1994.0– 2010.0. There are 183 AGN in total, with the sample being heavily dominated by flat spectrum radio quasars (78%) and BL Lac objects (16%). The optical classifications are 98% complete, with redshifts available for 96% of the sample.
γ-ray-selected 1FM sample: For the joint LAT team-MOJAVE study of [7], we constructed a γ-ray sample based on the 11-month First Fermi AGN catalog [9] with average integrated > 0.1 GeV energy flux ≥ 3 ×
10−11erg cm−2s−2between 2008 August 4 and 2009 July 5 and galactic latitude|b|>10◦. The sample is complete
with respect toγ-ray flux, with the exception of twoγ-ray sources that were dropped since they had no unambigu-ous radio counterpart. There are 116 AGN in total, 56 of which are in common with the MOJAVE 1.5 Jy sample. Like our radio-selected sample, it is heavily dominated by blazars, but contains a larger fraction of BL Lac objects (36%). The remainder of the sample are quasars, with the exception of the nearby radio galaxy NGC 1275 (3C 84) and the narrow-line Seyfert 1 galaxy PMN J0948+0022.
Low-luminosity compact AGN sample: In 2006 we expanded the MOJAVE program to include regular VLBA observations of 16 AGN with VLBA 15 GHz luminosi-ties below<1026 W Hz−1. These were chosen from the VLBA Calibrator Survey [10–15], based on the following criteria: i) 8 GHz VLBA flux density greater than 0.35 Jy, ii) z≤ 0.3. By adding the AGN already in the MOJAVE program which met these criteria, we obtained a final sam-ple of 43 low-luminosity compact AGN.
These three samples, comprising 259 AGN in total, provide a broad cross-section of AGN types among bright, compact radio sources. Since only 200 of these sources had at least 5 VLBA epochs as of May 2011, the kine-matic data are incomplete. In particular, the AGNs with missing data tend to be among the weaker radio andγ-ray selected AGNs that were added later in the MOJAVE sur-vey. A statistical inter-comparison of these samples will be presented once a full, unbiased dataset has been collected.
3 VLBA Observations and Data Analysis
The 15 GHz VLBA data used in this study were obtained either from the VLBA archive, the VLBA 2 cm Survey program, or the MOJAVE program. In the latter, AGNs were monitored at intervals ranging from every 3 weeks to every 3 years, depending on the angular expansion rate of the individual AGN jets. The data were reduced using standard methods as described in [16].
We modelled the (u, v) visibility data at all AGN epochs using a series of Gaussian components in the Difmap software package [17]. In the majority of cases, we used circular Gaussians for jet features, and occasion-ally (when necessary) elliptical Gaussians for the core fea-ture. The latter was typically the brightest feature at the extreme end of a one-sided jet in most sources. In some instances, it was not possible to robustly cross-identify the same components in a jet from one epoch to the next. Af-ter discarding these, 887 robust components with at least 5 data epochs were available for more detailed kinematics analysis.
We performed two sets of kinematics analyses on the robust Gaussian jet components in our sample. The first assumed a simple non-accelerating, two-dimensional vec-tor fit to the component position over time, referenced to the core component (which we presumed to be station-ary). For the components which had measurements at 10 or more epochs, we also performed a constant acceleration fit (as described in [3], which yielded kinematic quantities at a reference (middle) epoch. If these showed a signifi-cant (≥3σ) acceleration, we adopted the kinematic values from the acceleration fit.
4 Discussion
4.1 Jet Kinematics Analysis
We examined each component with significant proper mo-tion (µ ≥ 3σµ) for non-radial motion by comparing the mean position angle of the componenthϑiwith its proper motion vector directionφ. We flagged any component for which the angular offset|hϑi −φ|was≥3σfrom either 0◦
or 180◦as “non-radial”, and “inward” if the offset was
sig-nificantly greater than 90◦. We made these determinations
using the|hϑi −φ|values from the acceleration fit for sig-nificantly accelerating components, or from the vector fits otherwise. Of the 739 (≥ 3σ) motion components clas-sified as robust, 282 (38%) exhibit significant non-radial motion.
Table 1. Summary of Kinematics Analysis Results
Property Number
AGN analyzed for kinematics 200
Jet components classified as robust 887 Robust slow pattern speed components 38 ( 4%) Robust jet components with (≥3σ) measured speeds 739 (83%) Robust inward-moving (≥3σspeed) components 17 ( 2%) Components with significant (≥3σ) non-radial motion 282 (38%) Components analyzed for acceleration 547 (62%) Components with significant acceleration 212 (39%) Components with significant perpendicular acceleration 99 (18%) Components with significant parallel acceleration 155 (28%)
by definition BL Lacs have weak emission lines or feature-less optical spectra that often make it difficult or impossi-ble to measure their redshifts.
The inward motions are all typically slow, with a me-dian value of 33µas y−1, and none are faster than ∼
100µas y−1. Considering only the AGN with a known redshift, the inward components of 1458+718 are the only ones which appear significantly superluminal, rang-ing from 1.4 c to 4.6 c. With the exception of 1458+718, 2021+614, and 2230+114, the inward motions all occur within∼1 mas of the core, in typically the innermost com-ponent. In particular, the innermost two jet components of two TeV-emitting BL Lacs in our sample: 0219+428 (3C 66A) and 1219+285 (W Comae) are both inward-moving. The small velocities and core separations of these mov-ing components may indicate that the core is not a stable reference point in these two jets. We did not find any sig-nificant inward motions in the other 15 currently known TeV-emitting AGN jets which we analyzed.
There are many scenarios under which apparent in-ward motions can be produced, including: i) curved jet motions which cross the line of sight, ii) non-stationarity of the apparent core feature, due to one or more newly emerging features below the interferometric resolution level, iii) a misidentification of the true stationary core with a moving feature, iv) internal brightness changes in a large, diffuse jet feature, and v) apparent backward pattern speeds not associated with the flow. The very small num-bers of inward-moving features strongly rules out a fully random pattern speed scenario for the motions, in which equal numbers of inward and outward motions would be expected.
4.2 Parsec-Scale Jet Orientation Variations
The tendency for the parsec-scale jets of blazars to change their position angles on the sky with time has been solidly established via long term VLBI studies of several individ-ual AGN (see [18] for a recent review). The exact origin of the wobbling is not clear, although accretion disk preces-sion, orbital motion of the accretion system, or instabilities in the jet flow have all been suggested. A main signature of precession is sinusoidal variations in the jet position an-gle, and evidence for this has been seen in blazars such as 3C 273 [19], 3C 345 [20], 0716+714 [21], BL Lac [22], and M81 [23]. Other jets have displayed monotonic po-sition angle swings with no evidence of periodicity (e.g., 3C 279: [24]; NRAO 150: [25]).
Until now, there has been no systematic survey of jet position angle variations in a large blazar sample. Using our extensive MOJAVE database, we analyzed the inner-most jet regions of 60 AGN from our radio-selected sam-ple for which we have obtained 20 or more VLBA epochs over a minimum twelve year period. We excluded sev-eral well-monitored jets in our sample for reasons of core identification uncertainty, counterjet emission, or highly curved jet structure within one mas of the core. We deter-mined the innermost jet position angle at each epoch by taking a flux density-weighted position angle average of all clean components above 3 times the image noise level in the annular region from 0.15 mas to 1 mas from the core. We also explored other methods, such as using the position angle of the innermost Gaussian modelfit compo-nent, or multiple components within a particular distance from the core, but the derived position angles were more influenced by choices made for the fitted Gaussians (e.g., elliptical versus circular, and total number of Gaussians in the inner jet region). Our position angle measurement method is subject to errors associated with wandering of the core component position due to changes in opacity or the emergence of new components below our resolution level. These are likely small, however, since they would create correlated apparent motions in components located downstream, which we have not detected in our data.
We find that the innermost jet position angles vary con-siderably over the 12 to 16 year intervals covered by our data, with ranges up to 150◦in some jets. The typical
cir-cular standard deviation in position angle is∼ 10◦. The
quasars and BL Lac objects differ significantly in their ranges, according to Kolmogorov-Smirnov tests on their range (pnull=1.1%) and standard deviation (pnull=1.3%) distributions. It is unclear whether the smaller overall vari-ations we see in the BL Lac innermost jet position angles is an intrinsic effect, or because they are oriented at slightly larger angles to the line of sight than quasars.
Some jets (e.g., NRAO 150=0355+508) show a very wide range of inner jet position angle and Gaussian com-ponent position angles, likely because the viewing angle to the inner jet lies within the opening angle of the (pre-sumably conical) outflow. In other cases, such as 3C 273 (1226+023), the jet is tranversely resolved into multiple features, some of which are moving along different po-sition angles at nearly the same radial distance from the core. Since stacked-epoch VLBA images [16] often show a smooth conical jet intensity profile in highly variable ejection angle jets such as 1308+326, the simplest inter-pretation is that individual emerging features do not fill the entire cross-section of the flow. Instead, features are ejected within a finite width “ejection cone”, which be-comes apparent only in a stacked-epoch image. The ap-parent opening angle of this cone is exaggerated by pro-jection effects by a factor of sinθ. Thus for typical blazar jet viewing angles of θ . 5◦, the intrinsic ejection cone full opening angle is likely∼ 0.5◦to∼2◦, based on the
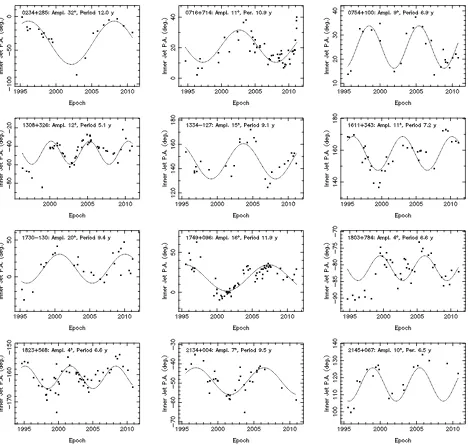
vis-Figure 1.Innermost jet position angle versus time plots for 12 selected MOJAVE jets displaying oscillatory trends. The dotted lines represent the best sine curve fits to the data, based on the peak period in the Lomb-Scargle periodogram.
ible is just the portion of the jet that is currently experi-encing enhanced synchrotron emission, due to the passage of several very bright features. These features may rep-resent flow instabilities driven at the nozzle (e.g., [26]), which vary within the jet over time and in turn influence the kinematics downstream.
The individual AGNs in our sample show a variety of inner jet evolution patterns, which we have classified into four general categories. There are 14 jets which display a monotonic trend of inner jet position angle with time, 5 which show a back and forth trend, 12 which show more than one cycle of back and forth motion (oscillatory), and 29 with no discernible trend. Within these categories, 11 jets exhibited one or more abrupt jumps in position an-gle, caused by a new feature emerging from the core with a significantly different trajectory than previously ejected features.
We performed linear regression fits on all of the jets showing monotonic trends (in some cases, we had to omit segments of the data from the fit due to abrupt jumps in po-sition angle). The most rapidly varying jet, at 9.8±1◦y−1, is 0355+508 (NRAO 150). Our measurement is consistent with the swings of up to 11◦ y−1 seen previously in this jet by [25] in VLBA images at 43 and 86 GHz. The other monotonically changing jets in our sample show swings of typically a few degrees per year.
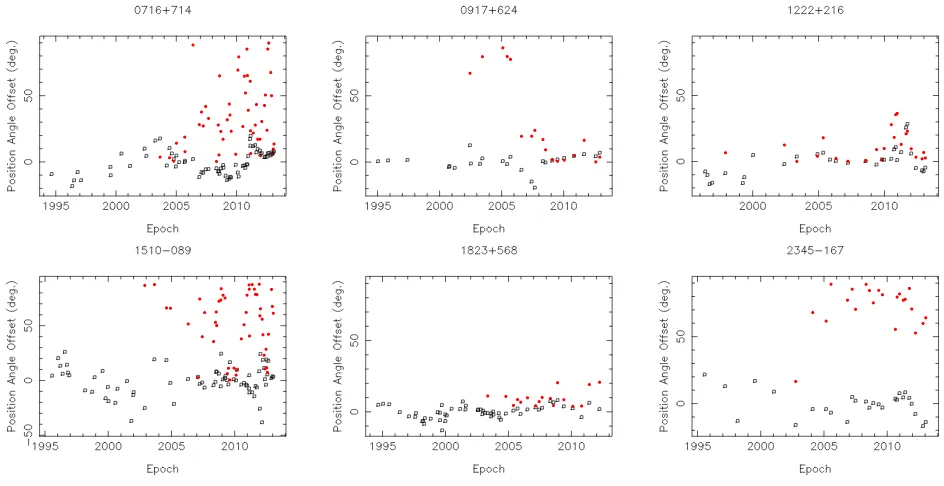
or-Figure 2.Plots of innermost jet position angle (black unfilled squares) and core electric vector position angle offset (red filled circles) versus time for selected MOJAVE jets showing a range of behaviors. The jet position angles are rotated such that the median value is at zero degrees.
der to find the best absoluteχ2 value. Assuming a typ-ical Gaussian normal error of 2◦ for the position angle measurements (based on the linear regression fit residu-als to the monotonic trend sources), the best reduced-χ2 fit values are 1.5 for 0716+714, and 2.5 for 1823+568. We cannot reliably establish periodicity in any jet, how-ever, due the lack of sufficient cycles in the data, and the fact that many of the fits have significant residuals (e.g., 1308+326, 1803+784, 2145+067), suggesting that the be-havior is more complex than a single sinusoidal variation. Using the MOJAVE VLBA polarization data, we have begun an analysis of the electric vector position angle (EVPA) of the core features, to compare these with the inner jet position angle over time. Our preliminary results indicate a wide range of behavior, with some jets main-taining EVPA orientations parallel to, or perpendicular to the jet for long periods, while others show constantly vari-able EVPAs (Fig. 2). Although Faraday rotation of the core EVPAs is minimal at 15 GHz (∼ 10−15◦; [29]), some high rotation measures are occasionally seen. A more complete statistical analysis of the core EVPA prop-erties, including the behavior during superluminal compo-nent ejections, will presented in a forthcoming paper.
4.3 Dispersion of Apparent Speeds
A longstanding question in AGN jet kinematics is whether the bright features in a given jet all tend to propagate at a characteristic speed which represents the true flow. In [3] we found that roughly 20% of the jets had one or more features which moved significantly slower than the other features in the jet. These slow pattern speed features could be the result of either stationary shocks in the flow, or jet
bending across the line of sight. We have repeated this analysis for the current data set, using more stringent cri-teria.
We first tabulated a maximum speed for each jet by considering the component with the fastest≥3σspeed. If no component in the jet had a≥3σspeed, we lowered the criterion to> 2σ. In the case of 0355+508, 1329−049, and 1520+319, which had no≥2σcomponents, we used the component speed with the smallest measured error. We dropped 16 jets from the analysis since they had no robust components with which to measure a maximum speed. We flagged components as “Slow Pattern Speed” (SPS) if they had i) no statistically significant acceleration, ii) a speed less than 20µas y−1, and iii) a speed at least 10 times slower than the fastest component in the jet. We found 38 such components in 29 different jets (14 quasars, 10 BL Lacs, and 4 radio galaxies).
A significantly higher fraction of BL Lacs and radio galaxies in our sample contain SPS components (∼25%) as compared to quasar jets (10%). We detect no signif-icant differences in the redshift distributions of SPS and non-SPS jets, but their median VLBA 15 GHz luminos-ity distributions are different at the 98% confidence level according to a Kolmogorov-Smirnov test. Of the 37 jets with radio luminosity above 1028 W/Hz, only one has a SPS component (the quasar 2134+004). This is consistent with numerical simulations (e.g., [30, 31]) which show that more highly relativistic jets exhibit fewer compact in-ternal structures and less overall instability.
10 20 30 40 50 60
N per bin
0 10 20 30 40 50
Apparent Speed [c]
10 20 30 40 50
N per bin
Fastest speed within the jet
Median speed within the jet
Shaded: jets with ≥ 5 robust features
(Jets with ≥ 5 robust features)
Figure 3.Distributions of fastest and median speed for jets in our sample with measured redshifts. The shaded histograms are for jets having at least 5 robust components.
median speed and rms dispersion value. Over half of these jets have D values above 0.8, indicating that in most cases, the overall range of apparent speed within a jet is compara-ble to its maximum speed. Removing the SPS components from the analysis did not change this general result.
Although we find there can be a large range of appar-ent speed within a jet, the speeds usually cluster around a median value, indicating they are not random. The median rms dispersion of speed within a jet is 2.8 c. This is signif-icantly less than the overall dispersion of the median val-ues (6.7c). Furthermore, the distributions of maximum and median speed in the sample are not uniformly distributed in either angular or spatial measure, but are instead peaked at low values (Fig. 3).
In Figure 4 we show the binned distribution of the speed dispersion statistic D = (µ−µmedian)/µmedian, the fractional difference with respect to the median speed in the jet. The distribution is nearly normal, although with significant kurtosis (more sharply peaked than Gaussian, according to an Anscombe-Glynn test). There is no signif-icant skewness if the outlier at 2.8 (1823+568) is omitted (D’Agostino test). One might expect an asymmetric distri-bution (positively skewed) if some fraction of the features travel at the true flow speed and none of them exceed it, but we do not see evidence of this in the data. Since we can typically identify more robust components in the jets for which we have the longest monitoring intervals, we might also expect to see a positive trend between the maximum speed of a jet and the number of robust components, but this is not evident in our data. Our findings thus suggest that in general, high ejection rate blazar jets tend to eject features with apparent speeds which cluster about a speed that is characteristic to each individual jet.
A dispersion of apparent speeds within a jet might be expected in the context of our model presented in
Sec--1 0 1 2 3
Fractional Difference from Median Speed
0 10 20 30 40 50 60
N per bin
Figure 4. Overall normalized speed distribution of moving features within jets having at least 10 robust components. The fractional difference is defined as (µ−
µmedian)/µmedian.
tion 4.2, in which features do not fill the entire jet cross section, and emerge along a radial streamline within a con-ical outflow. Evidence of thin ribbon-like instabilities has been seen in the transversely resolved jet 3C 273 [32] and the quasar S5 0836+710 [33]. The latter authors conclude that the ridgeline in VLBI images may correspond to a helically twisted pressure maximum within the jet, which slowly varies in position on decadal timescales. In the case of 3C 273, polarimetric VLBA rotation measure maps made at different epochs by [34], [35], and [29] indicate that different parts of the jet are being illuminated at dif-ferent times. Similar behavior has also been reported in the broad line radio galaxy 3C 120 by [36].
In our proposed scenario we would expect a range of apparent viewing angle roughly equal to the full opening angle of the ejection cone, and a corresponding range in apparent speed. In [8] we examined the range of expected apparent speed for conical jets with a fixed 2◦ full open-ing angle versus on-axis viewopen-ing angle, and concluded that the spread in apparent speed we see in individual jets can-not be wholly attributed to a spread in streamline viewing angle. The moving features must therefore also have an intrinsic range of bulk Lorentz factor and/or pattern speed.
4.4 Trends With Apparent Speed
4.4.1 Speed versus distance down the jet
of ages, this would tend to suppress any artificial trend of higher mean distance for faster components. However, no components are found in the upper left corner of the plot, since these fast components will have higher mean core distance values and quickly evolve towards the right hand side of the diagram. Also, sufficient time must pass to gather sufficient epochs for an apparent speed measure-ment in our survey. Components are also absent from the lower right “graveyard” region since these evolved com-ponents have likely undergone considerable adiabatic ex-pansion and synchrotron energy losses, thereby dropping their flux densities below the threshold for which we can robustly measure their centroids and speeds. There is also a notable deficit of components above∼0.4 c within∼1 pc of the core, which would be even more pronounced without the inclusion of the numerous components associ-ated with the two-sided jets of the gigahertz-peaked spec-trum galaxy NGC 1052. The two broad line radio galaxies 3C 111 and 3C 120 also occupy a distinct region among the radio galaxy data plotted in Figure 5.
The overall distribution of the components in the plot indicates a positive correlation of speed with core dis-tance for radio galaxies and BL Lac objects, even after partialling out redshift. This trend needs to be confirmed, however, using a larger, complete AGN sample which ex-tends below our low-luminosity sample limit of 0.35 Jy. It is not possible to assess the existence of a trend for the quasars due to the observational selection effects described above. Because of the low space density of bright quasars at low redshift and the fixed angular resolution limit of our survey, there is likely an artificial deficit of quasar jet com-ponents in the region below 1 c and within∼ 1 pc of the core, precisely where data are needed to test for a possible trend.
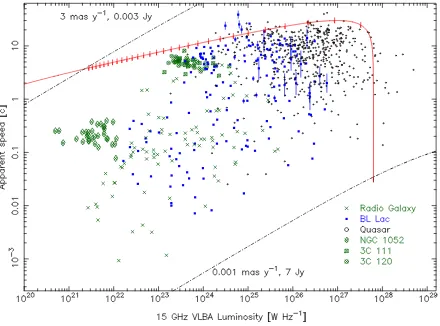
4.4.2 Speed versus luminosity
A plot of apparent speed versus luminosity for the ro-bust jet components (Fig. 6) reveals a distinct deficit of fast components at low luminosities. The apparent upper envelope to this distribution has been discussed in sev-eral studies ([2, 3, 5, 6, 37, 38]), and roughly matches the locus of points for a jet of fixed intrinsic luminos-ity and bulk Lorentz factor, oriented at different angles to the line of sight (for L > 1023 W Hz−1). The paramet-ric red curve in Figure 6) is drawn for a jet withΓ =35, Lint =1023 W Hz−1, and Doppler boostδ2.7. This curve is representative only, since jets in the population have a range of Lorentz factors and intrinsic luminosities, and thus a family of such curves exist, as described by [6]. The upper left and lower right regions of the plot (delim-ited by the dot-dashed lines) are not sampled by our sur-vey. The deficit region located below the red curve and be-low 1023 W Hz−1is partly due to the incompleteness and relatively high flux density cutoff of our low-luminosity sample. The overall fall-offin the upper edge of the distri-bution from 1026W Hz−1to 1023W Hz−1is not the result of survey bias or selection effects, however, and reflects both the existence of a maximum jet Lorentz factor in the
parent population (∼40), and an intrinsic correlation be-tween flow speed and luminosity in AGN jets. The rela-tively sharp edge to the upper envelope in Figure 6, as well as the relatively unchanging distribution of apparent speed in luminosity bins above 1026 W Hz−1 imply that intrin-sically powerful AGN jets have a wide range of Lorentz factors up to∼40, while intrinsically weak jets are only mildly relativistic.
4.5 Accelerating Components
Theoretical models of the acceleration and collimation of blazar jets indicate that the strong magnetic fields associ-ated with the putative supermassive black hole/accretion disk system play a key role in the initial acceleration and collimation of the jet [e.g., 39]. While some models in-dicate that this process is largely complete with the con-version of Poynting flux to flow energy on sub-pc scales [e.g., 40], there may still be significant magnetic [41] or hydrodynamic acceleration which extends to parsec or de-caparsec scales.
In our previous analysis of MOJAVE data from 1994– 2007 [4], we found that accelerated motions with respect to the mean apparent velocity vector~βobs were common, with significant parallel accelerations seen in roughly one third of our sample, and significant perpendicular acceler-ations in about one fifth of our sample. Due to the limited number of available epochs, we were only able to analyze 311 of the 526 moving components for possible acceler-ated motion. Using our new data spanning up to 2011 May 1, we have performed the same analysis on 547 of 887 moving components which had at least 10 epochs. We summarize our overall acceleration results in Table 1. Our incidence rates of parallel accelerations (28%) and per-pendicular accelerations (18%) are consistent with those reported in [4]. Nearly 40% of the components analyzed show significant acceleration of either type. A substantial number of components showed no significant acceleration, but had non-radial motion vectors. If we assume that these components accelerated some time prior to our monitor-ing interval, the fraction of movmonitor-ing components showmonitor-ing accelerations rises to 70%.
4.6 Polarization and other trends
Figure 5.Apparent speed versus mean projected distance from the core in parsecs for all robust jet components (excluding non-radial and inward components). The green crosses denote components in radio galaxies, the black circles quasars, and the blue squares BL Lacs. The jet components of two broad-lined radio galaxies (3C 111 and 3C 120), as well as the gigahertz-peaked spectrum radio galaxy NGC 1052 are highlighted with distinct symbols. Error bars have been omitted for the purposes of clarity. For components in jets which do not have a spectroscopic redshift, we include range bars which correspond to their known redshift constraints. The dotted lines indicate lines of constant age for components that have moved steadily outward over the time period indicated. Newly emergent fast components rapidly evolve out of the top left region of the plot, while no components are found in the bottom right graveyard region since they will likely have faded well below the MOJAVE imaging sensitivity level.
versus synchrotron peak frequency (Fig. 7). This is con-sistent with other trends with core compactness and ra-dio variability seen in ourγ-ray selected 1FM sample [7] which suggest lower Doppler factors for the radio-emitting jets in HSP BL Lac objects. We are currently obtaining kinematic data on a much larger set of HSP jets to further investigate these trends.
5 Summary
We have analyzed the kinematics of 200 parsec-scale AGN jets based on VLBA observations spanning 1994 Aug 31 to 2011 May 1. These jets were drawn from a complete radio-selected AGN sample above 1.5 Jy, a completeγ-ray selected sample, and a representative low-luminosity radio jet sample. We obtained vector motion fits to 887 robust components which were positively cross-identified over at least 5 VLBA epochs. We also measured the acceleration properties of 557 components which had at least 10 VLBA epochs. Our main findings are as follows:
1. Nearly all of the 60 most heavily observed jets show significant changes in their innermost position angle (20◦
to 150◦) over a 12 to 16 year monitoring interval, with BL
Lac jets showing smaller variations than quasars. The ob-served range corresponds to intrinsic (de-projected)
varia-13 14 15 16 17
log rest frame synchrotron peak frequency [Hz]
0 10 20 30 40
Maximum apparent jet speed [c]
TeV detected
Measured by MOJAVE
MOJAVE observations underway
Figure 7. Plot of maximum measured jet speed versus syn-chrotron peak frequency for MOJAVE AGNs.
tions of∼ 0.5◦ to∼ 2◦. Roughly half of the heavily
Figure 6.Apparent speed versus 15 GHz luminosity for all robust jet components (excluding inward components). The green crosses denote components in radio galaxies, the black circles quasars, and the blue squares BL Lacs. Error bars have been omitted for purposes of clarity. For components in jets which do not have a spectroscopic redshift, we include vertical range bars which correspond to their known redshift constraints. The red curve shows the locus of possible locations for a jet component having intrinsic luminosity 1023W Hz−1, Doppler boostδ2.7and a Lorentz factorΓ =35, viewed at different angles to the line of sight. The tick marks are drawn at one degree
intervals, ranging from a viewing angle of 30◦on the left to 1◦on the right. The dot-dashed lines correspond to observational limits; the regions in the top left and bottom
right corners of the plot are not sampled by the survey.
too long compared to the length of the dataset to firmly establish periodicity. These periods are very short com-pared to expected precession timescales from warped ac-cretion disk - black hole interactions associated with the Bardeen-Petterson effect [44]. Rather, we favor a conical jet model in which emerging features do not fill the en-tire cross-section of the flow. What is typically visible in a single-epoch, limited dynamic range VLBA image as a series of bright features may actually be the lit up portions of thin ribbon-like structures embedded within a broader conical outflow. These portions have been energized by a passing planar disturbance which originated in the VLBI core. As discussed by [33], the ribbon structures may arise from helical pressure maxima within the jet, and slowly vary in position on decadal timescales.
2. We examined the distribution of speeds within 75 jets which had at least 5 robust components. Within a particular jet, the speeds of the features usually cluster around a characteristic value, however, the range of ap-parent speed among the components is comparable to the maximum speed measured within the jet. This is not due uniquely to unusually slow pattern speed components (de-fined as having a speed less than 20 mas y−1and at least 10 times slower than the fastest component in the jet), which comprise only 4% of all the components studied and are
less prevalent in quasar jets. It is also too large to be solely due to differences in ejection angle. We conclude that the dispersion is at least partially due to an intrinsic distribu-tion of bulk Lorentz factor and/or pattern speed.
3. Apparent inward motions are rare, with only 2% of the components having apparent velocity vectors greater than 90◦from the outward jet direction. They occur more frequently in BL Lac jets. All of the detected inward mo-tions are slow (.0.1 mas y−1), and nearly all occur within 1 mas of the core component.
4. We find a trend of increasing apparent speed with distance down the jet for radio galaxies and BL Lac ob-jects. The existence of a trend could not be evaluated for quasars due to unavoidable observational selection biases, as described in Section 4.4.1.
6. A preliminary analysis of the multi-epoch jet po-larization properties indicates a wide range of behavior in the core electric vector position angles over time, with the EVPA remaining relatively stable in some jets, and varying rapidly in others. The fractional polarization level gener-ally increases down the jet, and high-synchrotron peaked (HSP) blazars tend to have lower core fractional polar-ization levels. A general trend of decreasing maximum jet speed for higher synchrotron peaked blazars suggests lower Doppler factors in the radio-emitting jets of HSP BL Lac objects.
Acknowledgments
The MOJAVE project was supported under NASA-Fermi grants NNX08AV67G and 11-NASA-Fermi11-0019. E. Ros was partially supported by the Spanish MINECO projects AYA2009-13036-C02-02 and AYA2012-38491-C02-01 and by the Generalitat Valenciana project PROM-ETEO/2009/104, as well as by the COST MP0905 action ‘Black Holes in a Violent Universe’. M. F. Aller and H. D. Aller were supported by NASA-Fermi GI grants NNX09AU16G, NNX10AP16G and NNX11AO13G and NSF grant AST-0607523. Y. Y. Kovalev was sup-ported by the Russian Foundation for Basic Research (projects 12-02-33101, 13-02-12103), the basic research program “Active processes in galactic and extragalactic objects” of the Physical Sciences Division of the Russian Academy of Sciences, and the Dynasty Foundation. A. B. Pushkarev was supported by the “Non-stationary pro-cesses in the Universe” Program of the Presidium of the Russian Academy of Sciences. D. C. Homan was sup-ported by NSF grant NSF AST-0707693. The National Radio Astronomy Observatory is a facility of the National Science Foundation operated under cooperative agreement by Associated Universities, Inc. This work made use of the Swinburne University of Technology software corre-lator [45], developed as part of the Australian Major Na-tional Research Facilities Programme and operated under licence.
References
[1] K.I. Kellermann, R.C. Vermeulen, J.A. Zensus, M.H. Cohen, AJ 115, 1295 (1998)
[2] M.L. Lister, D.C. Homan, AJ 130, 1389 (2005) [3] M.L. Lister, M.H. Cohen, D.C. Homan,
M. Kadler, K.I. Kellermann, Y.Y. Kovalev, E. Ros, T. Savolainen, J.A. Zensus, AJ 138, 1874 (2009) [4] D.C. Homan, M. Kadler, K.I. Kellermann, Y.Y.
Ko-valev, M.L. Lister, E. Ros, T. Savolainen, J.A. Zen-sus, ApJ 706, 1253 (2009)
[5] R.C. Vermeulen, Proceedings of the National Academy of Science 92, 11385 (1995)
[6] M.H. Cohen, M.L. Lister, D.C. Homan, M. Kadler, K.I. Kellermann, Y.Y. Kovalev, R.C. Vermeulen, ApJ 658, 232 (2007)
[7] M.L. Lister, M. Aller, H. Aller, T. Hovatta, K.I. Kellermann, Y.Y. Kovalev, E.T. Meyer, A.B. Pushkarev, E. Ros, MOJAVE Collaboration et al., ApJ 742, 27 (2011)
[8] M.L. Lister, M.F. Aller, H.D. Aller, D.C. Homan, K.I. Kellermann, Y.Y. Kovalev, A.B. Pushkarev, J.L. Richards, E. Ros, T. Savolainen, ArXiv e-prints, 1308.2713 (2013)
[9] A.A. Abdo, M. Ackermann, M. Ajello, A. Allafort, E. Antolini, W.B. Atwood, M. Axelsson, L. Baldini, J. Ballet, G. Barbiellini et al., ApJ 715, 429 (2010) [10] A.J. Beasley, D. Gordon, A.B. Peck, L. Petrov, D.S.
MacMillan, E.B. Fomalont, C. Ma, ApJS 141, 13 (2002)
[11] E.B. Fomalont, L. Petrov, D.S. MacMillan, D. Gor-don, C. Ma, AJ 126, 2562 (2003)
[12] L. Petrov, Y.Y. Kovalev, E. Fomalont, D. Gordon, AJ 129, 1163 (2005)
[13] L. Petrov, Y.Y. Kovalev, E.B. Fomalont, D. Gordon, AJ 131, 1872 (2006)
[14] Y.Y. Kovalev, L. Petrov, E.B. Fomalont, D. Gordon, AJ 133, 1236 (2007)
[15] L. Petrov, Y.Y. Kovalev, E.B. Fomalont, D. Gordon, AJ 136, 580 (2008)
[16] M.L. Lister, H.D. Aller, M.F. Aller, M.H. Cohen, D.C. Homan, M. Kadler, K.I. Kellermann, Y.Y. Ko-valev, E. Ros, T. Savolainen et al., AJ 137, 3718 (2009)
[17] M.C. Shepherd (San Francisco: ASP, 1997), Vol. 125 of Astronomical Society of the Pacific Conference Se-ries, p. 77
[18] I. Agudo (2009), Vol. 402 of Astronomical Society of the Pacific Conference Series, p. 330
[19] T. Savolainen, K. Wiik, E. Valtaoja, M. Tornikoski, A&A 446, 71 (2006)
[20] A.P. Lobanov, J. Roland, A&A 431, 831 (2005) [21] U. Bach, T.P. Krichbaum, E. Ros, S. Britzen, W.W.
Tian, A. Kraus, A. Witzel, J.A. Zensus, A&A 433, 815 (2005)
[22] A.M. Stirling, T.V. Cawthorne, J.A. Stevens, S.G. Jorstad, A.P. Marscher, M.L. Lister, J.L. Gómez, P.S. Smith, I. Agudo, D.C. Gabuzda et al., MNRAS 341, 405 (2003)
[23] I. Marti-Vidal, J.M. Marcaide, A. Alberdi, A. Brun-thaler, ArXiv e-prints, 1301.4782 (2013)
[24] S.G. Jorstad, A.P. Marscher, M.L. Lister, A.M. Stir-ling, T.V. Cawthorne, J.L. Gómez, W.K. Gear, AJ 127, 3115 (2004)
[25] I. Agudo, U. Bach, T.P. Krichbaum, A.P. Marscher, I. Gonidakis, P.J. Diamond, M. Perucho, W. Alef, D.A. Graham, A. Witzel et al., A&A 476, L17 (2007) [26] P.E. Hardee (2011), Vol. 275 of IAU Symposium, pp.
41–49
[27] N.R. Lomb, Ap&SS 39, 447 (1976) [28] J.D. Scargle, ApJ 263, 835 (1982)
[29] T. Hovatta, M.L. Lister, M.F. Aller, H.D. Aller, D.C. Homan, Y.Y. Kovalev, A.B. Pushkarev, T. Savolainen, AJ 144, 105 (2012)
[30] G.C. Duncan, P.A. Hughes, ApJ 436, L119 (1994) [31] A. Rosen, P.A. Hughes, G.C. Duncan, P.E. Hardee,
[32] A.P. Lobanov, J.A. Zensus, Science 294, 128 (2001) [33] M. Perucho, Y.Y. Kovalev, A.P. Lobanov, P.E.
Hardee, I. Agudo, ApJ 749, 55 (2012)
[34] R.T. Zavala, G.B. Taylor, ApJ 626, L73 (2005) [35] K. Asada, M. Inoue, S. Kameno, H. Nagai, ApJ 675,
79 (2008)
[36] J.L. Gómez, M. Roca-Sogorb, I. Agudo, A.P. Marscher, S.G. Jorstad, ApJ 733, 11 (2011)
[37] R.C. Vermeulen, M.H. Cohen, ApJ 430, 467 (1994) [38] M.L. Lister, A.P. Marscher, ApJ 476, 572 (1997) [39] D.L. Meier, S. Koide, Y. Uchida, Science 291, 84
(2001)
[40] M. Sikora, M.C. Begelman, G.M. Madejski, J.P. La-sota, ApJ 625, 72 (2005)
[41] N. Vlahakis, A. Königl, ApJ 605, 656 (2004) [42] D.C. Homan, M.L. Lister, AJ 131, 1262 (2006) [43] A.A. Abdo, M. Ackermann, I. Agudo, M. Ajello,
H.D. Aller, M.F. Aller, E. Angelakis, A.A. Arkharov, M. Axelsson, U. Bach et al., ApJ 716, 30 (2010) [44] P. Natarajan, J.E. Pringle, ApJ 506, L97 (1998) [45] A.T. Deller, W.F. Brisken, C.J. Phillips, J. Morgan,