Licensed under Creative Common Page 1
http://ijecm.co.uk/
ISSN 2348 0386
ECONOMIC GROWTH AND POVERTY REDUCTION
IN SIERRA LEONE
Alie Faroh
School of Economics, Capital University of Economics and Business, Beijing, PR China farohali@yahoo.com
Abstract
Today there is a great challenge in explaining the contemporary economic developing
processes and one of the greatest contradictions are the fact that many countries do experience
economic growth, but yet they suffer from the severe bearings of poverty. This paper attempts
to identify the relationship between the economic growth and poverty in Sierra Leone. This
study used econometrics regression analysis by constructing multivariate linear regression
model based on time series study design under the period 1995-2012. Our main findings of this
study are: (i) indeed economic growth has a positive effect of reducing poverty in the country
under study. (ii) Agriculture value addition as share of Gross Domestic Product (GDP) has no
power to reduce poverty if appropriate policy that has to do with income distribution by
government is not implemented. The study concluded with some policy options, the policies
should be such that would emphasis on the income distribution from agriculture sector efficient
strategy given its ability to reduce poverty by increasing employment and improving the
opportunities for productive activities among the poor more especially the farmers.
Keywords: Economic growth, Agriculture, Poverty, Poverty Reduction Strategy, Sierra Leone
INTRODUCTION
Licensed under Creative Common Page 2
One of the objectives of Millennium Development Goals set by the United Nations in 2000 is to reduce extreme poverty by half by the year 2015. A country suffering high poverty rates as Sierra Leone where 70 percent of the 6.2 million people in Sierra Leone were classified as poor in 2009 and 52 percent of the population were living below the extreme poverty line. In addition to the high poverty, Sierra Leone is one of the most unequal countries in the world. The top 20 percent of the population share 43.6 percent of the total household income while the lowest 20 percent share only 7.81percent of the income.
The world is marked by massive inequalities the effects of the disparities are multifaceted, and they are constantly present in our daily lives, their daily interaction, their capabilities and empowerment. None the less it affects the greater part of the population that lives under extreme poverty. With the turn of the new millennium, the world has experienced structural changes, and countries across the world have managed to reduce the fraction of poor, hand in hand with the increased economic growth. Poverty reduction strategies have traditionally focused on economic growth as the main policy to reduce poverty. However, according to recent studies the distribution of income is an essential determinant of poverty reduction. Research on the relationship between growth, inequality and poverty on a cross-country basis has failed to give significant results because it neglects cross-country heterogeneity. This implies that all countries have different structures and conditions, which need to be taken into account in formulating policies for effective poverty reduction. Therefore, we will analyze the effect of growth on poverty on a country specific context for Sierra Leone.
The article is structured as follows: The next section present literatures review, section three the methodology employed in the study and the sources of data and variable specification. Empirical results and analysis will be done in fourth section while the discussion is completed by conclusions and policy recommendation in section five.
Research Objective
The aim of this study is to investigate whether there is a relationship between extreme poverty and economic growth. Next is to show if economic growth has an impact to reduce the level of poverty, the analysis will be illustrated in the case of Sierra Leone, a relatively one of the fastest-growing economy amongst low income countries in recent years, but yet still large majority of its population lives on less than $1.25 a day.
MEASURING POVERTY
Licensed under Creative Common Page 3
index that measures the severity of poverty, the poverty gap index , which measures the depth of poverty and the headcount index ), which measures the prevalence of poverty.
Foster, et .al (1984), the most frequently used measurements are: (i) the head court poverty index given by the percentage of the population that live in the households with a consumption per capita less than the poverty line; (ii) poverty gap index which reflects the depth of poverty by taking in to account how far the average poor person’s income is from the poverty line; and (iii) the distributional sensitive measure of squared poverty gap defined as the means of the squared proportionate poverty gap which reflects the severity of poverty.
Encyclopedia Americana (1989) poverty can be seen from two different perspectives: (i) “moneylessness” which means both an insufficiency of cash and chronic inadequacy of resources of all types to satisfy basic human needs, such as, nutrition, rest, warmth and body care; and (ii) “powerlessness” meaning those who lack the opportunities and choices open to them and whose lives seem to them to be governed by forces and persons outside their control. That is, in positions of authority or by perceived “evil forces” or “hard luck” Aku, et. al (1997) saw poverty from five dimensions of deprivation: (i) personal and physical deprivation experienced from health, nutritional, literacy, educational disability and lack of self confidence; (ii) economic deprivation drawn from lack of access to property, income, assets, factors of production and finance; (iii) social deprivation as a result of denial from full participation in social, political and economic activities; (iv) cultural deprivation in terms of lack of access to values, beliefs, knowledge, information and attitudes which deprives the people the control of their own destinies; and (v) political deprivation in term of lack of political voice to partake in decision making that affects their lives. Related to the definition of poverty is the measurement of poverty. Recent studies by United Nations Development Programme (UNDP) advocates the use of the Human Development Index (HDI).UNDP (2009), HDI combine three components in the measurement of poverty: (i) life expectancy at birth (longevity); (ii) education attainment and; (iii) improved standard of living determined by per capita income. The first relates to survival-vulnerability to death at a relatively early age. The second relates to knowledge being excluded from the world of reading and communication. The third relates to a decent living standard in terms of overall economic provisioning.
Licensed under Creative Common Page 4
reiterates that the factor that causes poverty include; (i) structural causes that are more permanent and depend on a host of exogenous factors such as limited resources, lack of skill, location disadvantage and other factors that are inherent in the social and political set-up. The disables, orphans, landless farmers, household headed by females fall into this category; (ii) the transitional causes that are mainly due to structural adjustment reforms and changes in domestic economic policies that may result in price changes, increased unemployment and so on. Natural calamities such as wars, environmental degradation and so on also induce transitory poverty.
To make poverty lines comparable across countries, economists generally prefer to calculate income or expenditure on a purchasing power parity, or PPP basis. PPP takes into account the differences in relative prices, and therefore purchasing power, among different countries. One dollar typically buys more basic goods and services in India than in the United States, and that should be taken into account when estimating living standards
EMPIRICAL REVIEW
Licensed under Creative Common Page 5
regressions, are highly significant, as indicated by the t-ratios. Fischer (1993) investigates the effects of shorter-term, macroeconomic variables with long term growth, finds that low budget deficits (or higher surpluses), low inflation and market-based official exchange rates are associated strongly and significantly with more rapid economic growth. By extension, then, sound macroeconomic management, because it establishes conditions for sustainable growth, is associated with reduced poverty. Demery and Squire (1996) construct an index that measures the combined effects of three macroeconomic policies: a reduction in the fiscal deficit and a devaluation of the real effective exchange rate. They find that in all six countries, a favorable change in the macroeconomic policy index was associated with a favorable change in the incidence of poverty. In Cote d’Ivoire, the only country with increased poverty, the macroeconomic index worsened.
POVERTY REDUCTION STRATEGIES
Licensed under Creative Common Page 6
ECONOMIC GROWTH AND POVERTY REDUCTION
Herrick and Kindleberger (1983) economic growth involves the provisions of inputs that lead to greater outputs and improvements in the quality of life of a people. Jhingan (1985) refers to it as a quantitative and sustained increase in a country’s per capita output or income accompanied by expansion in its labor force, consumption, capital and volume of trade and welfare. In determine the growth of any country’s economy certain indicators are usually taken into consideration. These indicators include: (i) the nation’s Gross Domestic Product (GDP); (ii) the nation’s per capita income (iii) the welfare of the citizens; and (iv) the availability of social services and accessibility of the people to these services. Gross Domestic Product refers to the total output of final goods and services produced in a country during any given period of time by residence of a country irrespective of their nationality (Todaro, 1977 and World Bank 1997).
Per capita income is the total national income divided by the population of a country. Welfare is usually determined by the increased and sustained flow of goods and services consumed by the people with the resultant effects of an increase in life expectancy at birth, reduction in infant and maternal mortality. Availability of and accessibility to social services include health care services, education and clean water. (Thirlwall, 1972; Meire, 1982; World Bank 2005).
Calamitsis (1999), Hernandez-Cata (1999) Ouattara (1999) and Dollar and Kraay (2001) the progress in the above indicators are better determined by the following factors; good rule of law, a well-defined property rights for landholders and informal entrepreneurs, openness to international trade, developed financial markets that strengthens savings mobilization and intermediation and promote sound banking systems, macroeconomic stability, moderate size of government, political stability and security of life, a capable and efficient civil service, a transparent and predictable and impartial regulatory and legal system, and good governance with emphasis in tackling corruption and inefficiency and in enhancing accountability.
Licensed under Creative Common Page 7
For instance, Malaysia was able to reduce income poverty from 29 percent in 1980 to 13 percent in 1995 and lowered its Gini-coefficient from 0.49 in 1980 to 0.46 in 2002. The income of the poorest 20 percent has increased from $431 in 1970 to $14275 in 2010. By 2004, 88 percent and 99 percent of the population have access to health care services and clean water respectively. Infant mortality rate dropped from 16 per 1000 live birth in 1990 to 10 per 1000 live birth in 2006. Life expectancy at birth rose from 70 years in 1990 to 74 years in 2006 (World Bank 1997; World Bank 2008; Wikipedia 2010).
POVERTY IN SIERRA LEONE
Poverty is a daily constant for seven out of every ten Sierra Leoneans nationwide. As in many other developing countries, poverty in Sierra Leone is most pervasive in rural areas, where two-thirds of the country’s population resides and where eight out of ten are considered poor. While living conditions in Freetown are crowded, and life is difficult, poverty levels are actually much lower in the capital than in rural areas and secondary towns.
Poverty levels in Sierra Leone were assessed using 2002/03 household and individual-level survey data on a range of social and economic indicators. The PRSP distinguishes “food poverty” – i.e. the level of expenditures needed to reach the minimum nutritional requirement of 2700 calories per equivalent adult – from “total poverty,” which is the income required to purchase this food plus basic necessities (safe water and sanitation, shelter, health, education). The incidence of food poverty in Sierra Leone is 2% in Freetown, 20% in other urban areas, and 33% in rural zones, for a national average of 26%. The total poverty rate is much higher, i.e. 15% in Freetown, 70% in other urban areas, and 79% in rural zones, for a national average of 70%. It has also been estimated that the depth of poverty is greater in rural Sierra Leone, such that it will take a larger improvement in incomes to raise rural households above the poverty line. Detailed breakdowns by district of food and total poverty are shown in Table.1
Table 1: Food Poverty & Total Poverty by District (% of population below the poverty line)
% of population below the poverty line (Ordered by total poverty)
Food Poverty Total Poverty
Urban Rural Total Urban Rural Total
Kailahun 25.7 54.9 45 86.2 94.6 92
Bombali 25.1 69.6 63 83.4 90.0 89
Kenema 19.5 52.4 38 77.5 95.0 88
Bonthe 39.9 33.1 35 88.7 83.5 85
Licensed under Creative Common Page 8
Port Loko 12.7 22.6 20 71.9 85.0 82
Koinadugu 28.6 29.2 29 81.1 76.3 77
Kambia -- 11.6 9 75.6 67.7 69
Moyamba 11.1 17.4 16 59.0 70.1 68
Kono 9.2 35.2 22 52.9 79.6 66
Bo 27.3 24.3 25 59.9 66.8 64
Pujehun 7.7 16.3 14 58.5 58.6 59
Western Rural -- 26.3 15 -- 70.1 45
Western Urban 3.2 -- 2 17.1 -- 15
National 14.7 32.8 26 54.3 78.9 70
Source: Sierra Leone Integrated Household Survey, 2003/04, as per PRSP
Sierra Leone’s largely rural population is engaged in a variety of economic activities. Agriculture is the key source of livelihood for about 70 percent of the population. Small-scale artisanal mining, especially of diamonds, is a major source of income for poor households in some districts of the interior plateau. Artisanal fisheries, both coastal and inland, provide employment for a significant number of rural households. Population pressure on the land is not a major problem except in a few limited areas. In fact, the years of war reduced the rural population in some areas to such an extent that there are too few agricultural workers in relation to the land that is available. In Sierra Leone, poverty is associated with larger households, households with older heads, those that are headed by a female, and those engaged in subsistence agriculture. As stated in the PRSP, “most of the rural working population is underemployed and its productivity is very low with most of the production being home-consumed and in most cases inadequate to meet the basic daily caloric requirements”. A number of the recommendations of this study would have a direct impact on some of the poorest parts of the country. For example, two of the three poorest districts in the country – Kailahun and Kenema – are also the main sources of cocoa production. Oil palm is also prominent in these districts, although it is found throughout the country. The expansion of Gari exports would favor three of the poorest Northern districts, Bombali, Tonkolili, and Koinadugu, where cassava is a major component of the typical mixed farming system.
POVERTY REDUCTION STRATEGY PAPERS (PRSP)
In 1999 the IMF and the World Bank initiated the PRSP framework as an effective strategy for poverty reduction. The PRSP were formulated to promote a broad based development through pro-poor growth in a long term perspective. “PRSPs aim to provide the crucial link between national public actions, donor support, and the development outcomes needed to meet the United Nations’ Millennium Development Goals (MDGs), which are centered on halving poverty
Licensed under Creative Common Page 9
between 1990 and 2015” (IMF, p. 1). The PRS is updated every three years and the annual progress report evaluates the country’s social, structural and macroeconomic situation to revise the strategy.
PRSP PROGRESS AND ACHIEVEMENTS
Sierra Leone developed its first Poverty Reduction Strategy paper (PRSP) in the form of an Interim Poverty Reduction Strategy in 2001. This was designed to address the challenges of transition from war to peace by focusing on three key areas: restoring national security and good governance; re-launching the economy; and providing basic services to the most vulnerable groups. This was complemented in 2002 by a National Recovery Strategy based on district and local recovery plans that emphasized the consolidation of state authority, peace-building, promotion of reconciliation, enforcement of human rights, resettlement, reintegration and the rebuilding o f communities.
Subsequently, a long-term sustainable development plan entitled “Sierra Leone Vision 2025” was published in 2003, and it provided a long-term framework for development planning and management. This was followed by the first full Poverty Reduction Strategy Paper (PRSP-I), which was developed for the 2005-2007 period. PRSP-I reflected a move away from immediate post-conflict concerns and was constructed around three pillars: the first pillar focused on good governance, peace and security; the second on food security and job creation; and the third on growth and human development.
Upon embarking on the second PRSP process, a review was undertaken of PRSP-I to highlight the achievements and lessons learned from its planning and implementation. Furthermore, a diagnostic study was conducted to identify drivers’ of growth in Sierra Leone. Based upon these findings, it was clear that only economic growth could provide the basis for poverty reduction in Sierra Leone, and consequently the focus of the second PRSP (PRSP-II) should be on the promotion of transformational economic growth. The diagnostic study and analysis of the poverty profile has helped to identify the key sectors which will form the strategic priorities for PRSP-II. Also, in order to generate a sustainable rate of economic growth, PRSP-II emphasizes the need to develop an enabling environment to support the private and productive sectors of the economy, and identifies four key enablers and drivers’ of growth. Finally, PRSP-II has sought to strengthen the implementation process to ensure that strategies are rolled out and implemented effectively by line ministries, departments and agencies.
Macroeconomic stability - With support from the development partners, Sierra Leone has
Licensed under Creative Common Page 10
the successful implementation of the first Poverty Reduction and Growth Facility (PRGF I) arrangement (2001-2005), the Government entered into negotiations for a successor PRGF arrangement with the IMF. Based on the track record of economic performance, the Executive Board of the IMF approved the PRGF II in May 2006. With continued donor support, during the implementation of PRSP-I, Sierra Leone achieved a relatively stable macroeconomic environment with strong economic growth, moderate inflation, declining current and fiscal account balances, increased level of foreign reserves, a broadly stable exchange rate, positive real interest rates and a lower external debt burden. Sierra Leone reached the completion point under the Heavily Indebted Poor Countries (HIPC) initiated in December 2006, and qualified for debt relief under the Multilateral Debt Relief Initiative (MDRI).
Education and Training - Access to education increased over the period as the Net Enrolment
Rate increased, although the ratio of girls to boys remained constant. Due to the focus on girls in education, the number of girls accessing secondary schools increased significantly. The pupil teacher ratio target was not achieved largely due to the ceiling placed on recruitment of teachers.
Health and Nutrition Services - Similarly, access to health facilities increased, as a total of 867
public health units were made fully operational, infant and child mortality ratios reduced slightly, but still remain amongst the worst in the world. Malaria treatment and prevention was intensified with the supply of over 300,000 treated bed-nets and the provision of affordable treatment drugs. The HIV/AIDS pandemic continued to be addressed through the continuous provision of condoms, establishment of Voluntary Counseling and Confidential Testing (VCCT) sites and provision of anti-retroviral drugs and other support to people living with HIV/AIDS. Access to safe drinking water and sanitation improved slightly at 49 % and 35 % respectively.
Thus far the work on Economic growth and poverty reduction relationship were mainly based on cross country analysis and assumption of homogeneity of countrie, however, country are heterogeneous in nature and we can say that has not been any empirical on Economic growth and Poverty reduction in Serra-Leone hence the need for this paper to bring to forth the effect of economic growth on the poverty situation in Serra-Leone economy.
METHODOLOGY
Licensed under Creative Common Page 11
reduction. Following Barro and Sala (1995) and Grootaert, Kanbur and Oh (1995) methods of analysis that uses a time subscript (t) first difference operator (), we therefore model the relationship between economic growth and poverty reduction as follows:
In specifying the model emphasis is placed on whether the nation’s economic growth has significant influence on poverty reduction. Having established this link, the first equation is formulated as:
lnPOVRt = f (lnGROWTH, InAGRt ) ……….…(1)
In an explicit and econometric form, equation (1) can be stated as:
lnPOVRt = β0 + β1InGROWTH t + β2 lnAGR t + µt ………..……… (2)
Where:
lnPOVRt = log of changes in poverty reduction in Sierra Leone proxy by changes in household
consumption-expenditure per capita.
lnGROWTHt = is the average GDP per capita growth (annual % US$).
lnAGRt = agriculture value added, (% of GDP)
β0 = the intercept.
β 1 and β2 = the parameter estimates that measure the influence of independent variables on the
poverty reduction. µt = the error term.
In order to verify the validity of the model, Oyeniyi (1997) the following criteria were used: the expectation criteria which is based on the signs and magnitudes of the coefficients of the variables under investigation; and secondly statistical criteria which is based on statistical theory, which in other words is referred to as the First Order Least Square (OLS) consisting of R-square (R2), F–statistic and t–test. The R-square (R2) is concerned with the overall explanatory power of the regression analysis, the F-statistic is used to test the overall significance of the regression analysis and the t-test is used to test the significant contribution of the individual variables on the dependent.
Data Source and Description
Licensed under Creative Common Page 12
Sierra Leone Annual Abstract of Statistics for various years, World Bank, African Development Indicators, National Statistics office Sierra Leone.
Specification for Chosen Variables
Poverty Household consumption expenditure per capita
According to UNDP (2009), HDI combine three components in the measurement of poverty: (i) life expectancy at birth (longevity); (ii) education attainment and; (iii) improved standard of living determined by per capita income. The first relates to survival-vulnerability to death at a relatively early age. The second relates to knowledge being excluded from the world of reading and communication. The third relates to a decent living standard in terms of overall economic provisioning. Poverty has various manifestations which include among others: lack of income and productive resources. There household consumption expenditure per capita as a proxy to measure poverty is to relate the theory that an improve consumption expenditure the better the wellbeing of an average citizen.
Economic growth in GDP per capita
The variable growth is the one independent variable directly related to the research question about economic growth’s impact on poverty, and shows how much explanatory power per capita GDP has over poverty reduction. It is measured as an economy’s growth in per capita gross domestic product, in percent per year, based on the World Bank’s databank. It is calculated in real terms annually over the period 1995-2012, in order to obtain values that capture the growth rate in a way as complete as possible. There exist different views on whether economic growth reduces poverty, and if this is a sufficient tool, so the expected sign of the coefficient is ambiguous. Growth is commonly assumed to have a positive impact on the level of poverty reduction through an increase in the consumption.
Agriculture value addition
Licensed under Creative Common Page 13
ANALYSIS AND FINDINGS
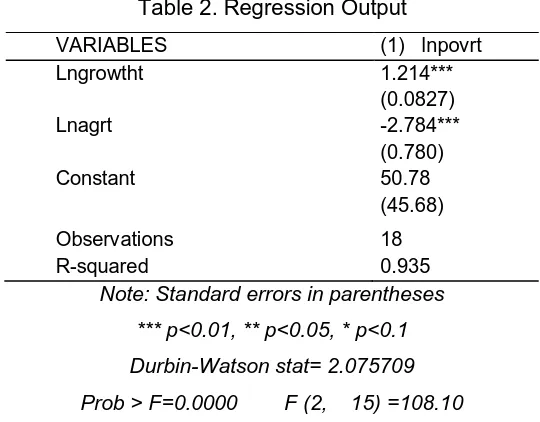
Table 2. Regression Output
VARIABLES (1) lnpovrt
Lngrowtht 1.214***
(0.0827)
Lnagrt -2.784***
(0.780)
Constant 50.78
(45.68)
Observations 18
R-squared 0.935
Note: Standard errors in parentheses
*** p<0.01, ** p<0.05, * p<0.1 Durbin-Watson stat= 2.075709 Prob > F=0.0000 F (2, 15) =108.10
The co-efficient estimates of the variable economic growth is significant positive this implies that one percent increase in economic growth would lead to increase in household consumption-expenditure per capita in Sierra Leone by 1.2 percent, so the household can meet the required standard of living therefore reduce poverty by 1.2 percent in the preceding year, which has been one of the poverty reduction strategies. While the agriculture value addition is -2.7 negative at 1% significant level, this indicate that the agriculture value added as share of GDP has no direct effect on poverty reduction, which has proved to be in contrary to most development organizations argument and general view, since it did not improved on the consumption-expenditure per capita of the households in Sierra Leone, this negative impact may has to do with subsistence nature of agriculture practice in the country, income distribution effect, the farmers who are producing the goods hardly receive subsidies or grants from government which in turn can increase household consumption, as 70% of Sierra Leonean population are farmers living in the rural areas with less than $1.25 per day.
The value of Durbin-Watson statistics insinuates that our model is free from spuriousness of model specification. F-statistic and Prob (F-statistic) points toward overall significance of the Model. A look at the model shows that it has an R2 of 0.94 which in other words means that 94 percent variation in the dependent variable (InPOVRt) is explained by the independent variables (InGrowtht and InAgrt), while the error term take care of the remaining 6
Licensed under Creative Common Page 14
independent variables in the model is significant in determining the influence on the dependent variable, as the computed F- statistic which is 108.10 is greater than the tabular F-statistic (2, 20) valued at 6.36.
CONCLUSION
Poverty is a multidimensional phenomenon, and its complexity does not decrease the more carefully it is investigated. Economic growth decreases the level of extreme poverty. This is a main conclusion drawn from the regression, which confirms theory and earlier studies. By using a multiple regression analysis technique that includes the economic growth and agriculture value added as share of gross domestic product (GDP) as in independent variables regressed against the change household consumption expenditure per capita as dependent variable, the paper explored the relationship between economic growth and poverty reduction in Sierra Leone. From the analysis, our findings indicate that an increase in economic growth has a positive effect on poverty reduction, while agriculture has not proved to reduce poverty in Sierra Leone scenario, a situation that can only be sustained and improved upon if certain policy measures are put in place. Prominent among policy measures are stable macroeconomic policies, such as, sound fiscal and monetary policies that would create a hospitable climate for private investment and thus promote productivity that the poor and non-poor would benefit from. The policies should also be such that would emphasis on the income distribution from agriculture sector efficient strategy given its ability to reduce poverty by increasing employment and improving the opportunities for productive activities among the poor more especially the farmers. And if the strategy is associated with increase productivity it will improve wages and under most circumstances the poorest segments of the society will see an improvement in their life conditions.
POLICY RECOMMENDATIONS
Licensed under Creative Common Page 15
turn, would increase income and public revenue (Hailu and Soares, 2009). Economic growth is necessary but not sufficient instrument to generate a broad based poverty reduction in Sierra Leone without proper coordination with stakeholders, smallholder farmers, petty traders and other entrepreneurs. Donors and the Government may need to stress not only the social areas but also pay more attention to agriculture and creation of nonfarm employment opportunities. NGOs should complement effort to implement policies that relates to agricultural growth and income diversification. To reduce poverty, it may be more effective to devise regional strategies instead of a national. As the household survey done by statistics office recognizes that there are significant regional differences in terms of poverty, food security, and agricultural potential. But this recognition is not translated into clear regional strategies to reduce poverty.
LIMITATIONS
The first limitation of this study is the small sample size/ number of observation which is (n=18). Due to the problem of data availability for larger sample size was a serious constraint. Secondly, there are a great number of possible variables that could impact poverty either negatively or positively, but because of time and some other factors outside the control of the researcher, this study only considers a few of these variables in the light of data availability and ease of measurement procedures. Of course it must of sometimes impossible to include all the variables in one study, even if we know them. Therefore, this limitation could be considered partly as a result of necessary decisions about the resources available for this research. Also, as the data was collected over a short period in time.
Although this study makes a number of contributions, there are also some of issues that need to be addressed further. It is therefore recommended that the present study be extended by using many variables and the same method to examine the relationship between poverty and the target variables in other African or emerging countries in the different regions and compare them with Sierra Leone.
REFERENCES
Aku, P.S, Ibrahim, M.J. & Bulus, Y.D (1997) Perspective on Poverty Alleviation Strategies in Nigeria. In Proceedings of the Nigeria Economic Society Annual Conference on Poverty Alleviation in Nigeria 1997. Ibadan: NES: 41-54
Boeninger, E. (1992) Governance and Development: Issues and Constraints. Proceeding of the World Bank Annual Conference in Development Economics. 1991. Washington. D.C: The World Bank.
Licensed under Creative Common Page 16 Calamitsis, E .A. (1999) Adjustment and Growth in Sub-Saharan Africa: The Unfinished Agenda.IMF Finance and Development. Vol. 36 No.1: 6-9
Chenery, H.B Ahluwalia, M.S, Bell, C.L.G, Dulloy. J. H, & Jolly,R (1974 ) Re- distribution with Growth.
Oxford University Press: London.
Dollar, D & Kraay, A (2000) Growth is Good for the Poor. The World Bank. Washington D.C
Datt, G. & Ravallion, M., (1998). Farm Productivity and Rural Poverty in India, Journal of Development Studies, 34(4), pp. 62-86
Dollar, D. & Kraay, A., (2002). Growth Is Good for the Poor, Journal of Economic Growth, 7(3), pp.195-225.
Deaton, Angus, & J. Muellbauer, (1980). Economics and Consumer Behavior.Cambridge University Press.
Demery, Lionel, & Lyn, S. (1996). “Macroeconomic Adjustment and Poverty in Africa: An Emerging Picture.” World Bank Research Observer 11-1: 39-59.
Edwards, P (1995) Crisis and Reform in Latin American from Despair to Hope. New York: The World Bank
Encyclopedia Americana (1989) Poverty. Vol. 22 Connecticut: Grolier inc. P 495 – 495
Economic and Social Statistics on Africa. African Development Report 2008. New York: Oxford University Press. African Development Bank (2010) Gender, Poverty and Environmental Indicators on African Countries 2010 Abidjan: ADB
Foster, J. Greer, J. & Thorbecke, E., (1984). A Class of Decomposable Poverty Measures, Econometrica, 52(3), pp.761–66.
Fos, A., (1996). Growth, Inequality and Poverty Reduction in Developing Countries: Recent Global Evidence, OECD Development Centre, Background Paper for the Global Development Outlook 1996: Shifting Wealth and the Implications for Development.
Fischer, Stanley, (1993). “The Role of Macroeconomic Factors in Growth.” Journal of Monetary Economics 32: 485-512.
Fields, Gary, (1989). “Changes in Poverty and Inequality in Developing Countries” The World Bank Research Observer, 4-2: 167-182.
Fields, Gary, (1980). Poverty, Inequality, and Development. Cambridge: Cambridge University Press.
Fields, Gary and George H. Jakubson, (1993). “New Evidence on the Kuznets Curve.” Cornell University, Mimeo.
IMF, (2009) Poverty Reduction Strategy Papers, Factsheet. Available at: http://www.imf.org/external/np/exr/facts/pdf/prsp.pdf.
IMF and World Bank, (2000). Decision Point Document for the Enhanced Heavily Indebted Poor Countries (HIPC) Initiative. Available at:
http://www.imf.org/external/np/hipc/2000/hnd.pdf, African Development Bank (ADB) (2008)
Harris, John R. and Michael P. Todaro. (1970). “Migration, Unemployment and Development: A Two-Sector Analysis”. The American Economic Review, Vol. 60, No.1(1970),p.126-142.Accessed October 25, 2013 from: http://www.aeaweb.org/aer/top20/60.1.126-142.pdf
Haddad, L. and Ravi Kanbur(1990). “How Serious is the Neglect of Intra-household Inequality?” Economic Journal 100: 866-881.
Herrick, B & Kindleberger, C. P (1983) Economics Development Singapore: Mc Graw-Hill.
Hailu, Degol, and Sergei Suarez Dillon Soares (2009). “What Explains the Decline in Brazil’s Inequality?” One Pager No. 89, International Policy Centre for Inclusive Growth (IPC-IG), Brasilia.
Licensed under Creative Common Page 17 Meire, G (ed.) (1985) Lending Issues in Development Economics. London :Oxford University Press. Oyeniyi T.A. (1997) Fundamental Principles of Econometrics. Lagos: Cader Publication Ltd.
Picciotto, R (1992) Participatory Development: Myths and Dilemmas. World Bank Policy Research Working Paper No.930
Sierra Leone (02/08). "U.S. Department of State". Retrieved 2008-02-17. http://www.sierra-leone.org/Census/ssl_final_results.
Theilwall, A. P. (1982) Growth and the Developing World. London: Longman Press. United Nations (UN) (2002) Human Rights and Extreme Poverty. New York: UN.
Woolcock, M & Narayan, D (2000) Social Capital: Implications for Development Theory, Research and Policy. World Bank Research Observer. Vol.15. No.2:225- 250.
World Bank (1990) Poverty. World Development Report 1990. New York; Oxford University Press.
World Bank (2008) Poverty Reduction and Economic Management Country Department AFCWl Africa Region: Sierra Leone Poverty Reduction Strategy, World Bank, GDP. Accessed November 28, 2014 from: http://siteresources.worldbank.org/DATASTATISTICS/Resources/GDP.pdf